Gamma ray induced early generation polygenic
variability in medium grain aromatic non-basmati rice
1*
Nihar Ranjan Chakraborty and
2Paresh Chandra Kole
1*,2 Department of Crop Improvement, Horticulture & Agril. Botany, Institute of Agriculture, Visva-Bharati, Sriniketan-731 236, West Bengal, India
Two advanced breeding lines of aromatic non-basmati rice, IET 14142 and IET 14143, irradiated with 250Gy, 350Gy and 450Gy of gamma ray induced wide variation for polygenic characters in M2 and M3 generations. Wide range of genotypic and phenotypic coefficients of variation (GCV
and PCV) for different characters indicated differential radio-sensitivity of the characters. Increase in values of GCV and PCV in M3 over M2 generation for flag leaf length and spikelet
number was due to “release of additional variability”. Heritability in M3 generation increased
over M2 in IET 14142 for days to flower and flag leaf angle at all three doses, and for other
characters only at certain doses. The genetic advance increased from M2 to M3 in IET 14142 for
some characters due to increase in variance, while it decreased in M3 generation in IET 14143
for certain characters due to increase in mean values. The overall results indicated the scope for isolating promising segregants in micro mutational population even in early generations.
Key words: Aromatic rice, gamma irradiation, micromutation, M2 and M3 generations, selection, variability
INTRODUCTION
Aromatic rice occupies a special place in World rice markets, being the highest priced rice due to fine appealing flavour it produces during cooking and in the cooked rice. The leading aromatic rice in world trade is ‘Basmati’ produced in Punjab area along both sides of the Indus River in India and Pakistan. But, in West Bengal, an important rice growing state in India, performance of ‘Basmati’ varieties is not satisfactory due to high humid conditions along with heavy infestation of insect-pests. Moreover, ‘Basmati’ varieties, when grown in West Bengal, produce grains with reduced aroma than they do in traditional Basmati growing zones of northwestern India. Hence, some non-basmati aromatic rice cultivars such as Tulaipanja, Gobindabhog, Seetabhog, Kaminibhog, Gopalbhog, Radhunipagol etc., are very popular in West Bengal. Although these varieties have excellent grain quality and appealing aroma, they are not recognized as ‘Basmati’ rice due to their small to medium grain size. In addition, these cultivars are handicapped by low yield potential (2.5 to 3.0 t/ha),
susceptibility to lodging due to very tall and less sturdy stem and droopy leaves. Farmers are reluctant to replace these varieties because of their excellent grain quality, aroma, high premium market price, and export to Middle East countries. Besides, the demand for high grain-quality rice in India is on increase due to rising standard of living and to promote export. Therefore, there is an urgent need to improve the yield potential of such aromatic non-Basmati rice cultivars.
Corresponding author: Dr. Nihar Ranjan Chakraborty, Department of Crop Improvement, Horticulture & Agril. Botany, Institute of Agriculture, Visva-Bharati, Sriniketan-731 236, West Bengal, India, Email: [email protected], +91-9434559884
Gamma ray induced early generation polygenic variability in medium grain aromatic non-basmati rice The complex nature of the quality characters and the
complicated inheritance of the quality components make it very difficult to retain the quality characteristics of aromatic rice through hybridization with non-aromatic high yielding genotypes. Alternatively, induced mutations provide for an important source of genetic variability. Sigurbjornsson and Micke (1974) have shown the increasing role of induced mutation in crop improvement. It has been demonstrated that induced mutation, being able to induce even polygenic mutation, can be useful in improving yield as well as other agronomic characters such as stiffness of straw, time of maturity, adaptability, disease resistance, protein content, baking quality, malting quality and numerous other characters (Borojevic, 1990 and Brunner, 1991) in addition to quick rectification of defects in varieties and advanced breeding lines, and development of ideotypes for various agro-climatic conditions.
Even though the frequency of desirable mutation is very low; the occurrence of even a few desirable mutations could be exploited to isolate superior genotypes in a couple of generations. Mutation breeding has been very successful worldwide in different crops including rice. A great majority of directly developed mutant varieties were obtained with the use of radiations, particularly gamma rays as mutagen (Kharkwal et al., 2004).
Keeping these points in view, gamma ray mutagenesis in two non-basmati aromatic rice genotypes was carried out to study magnitude and nature of variability, heritability and genetic advance for different characters besides determining the generation in which high degree of genetic variation is expected.
MATERIAL AND METHODS
The seeds of two semi-dwarf medium grain non-basmati lines viz., IET 14142 (designated as T1) and IET 14143
(designated as T2) derived from aromatic rice cultivar
Tulaipanja were irradiated with three different doses of gamma rays viz., 250Gy, 350Gy and 450Gy (1 Gray = 1 joule per kg of matter undergoing irradiation = 0.1 kR) from 60Co source at Central Research Institute for Jute
and Allied Fibre (CRIJAF), Barrackpore, West Bengal. The seeds unexposed to radiation from each genotype were used as control. Seeds from bagged panicles of suspected mutant plants in M1 generation were sown in
nursery bed to raise M2 generation. Thirty-day-old
seedlings from each of those nursery beds, where at least one type of chlorophyll mutation occurred, were transplanted in puddled field as progeny-row with one seedling per hill. Total number of M2 families planted was
142 for T1and 112 for T2. Each family consisted of two
rows of fifteen plants each with a spacing of 15 20 cm. The M2 populations were thoroughly screened for
segregation of chlorophyll and other mutations based on
visual observation. M3 generation was raised from the
seeds of ten randomly selected M2 mutant plants showing
segregation in the progeny-row. Therefore, in all, 60 plants (2 genotypes 3 doses x 10 plants) were selected in M2 generation, which were advanced to M3 generation.
The above selected 60 M2 plants were tested for aroma
(Singh et al., 1986). Thirty-day-old M3 seedlings from
nursery @ one seedling per hill were transplanted in compact family block design along with control with three replications. A mutant family plot consisted of three rows of fifteen plants each with a spacing of 15 20 cm. Standard cultural practices were followed to raise a good healthy crop in both the generations. Data on following quantitative characters viz., days to flower, flag leaf angle, flag leaf length(cm), plant height(cm), panicle number, panicle length, spikelet number, grain number, grain yield per plant(gm) were recorded from the five plants selected at random. Data were analysed following standard statistical and biometrical methods (Burton, 1952; Johnson et al., 1955; Snedecor and Cochran, 1967)
RESULTS AND DISCUSSION
Polygenic variation in M2 and M3 generations
Analyses of variance for between families and within families of induced mutants derived from each genotype for different polygenic characters indicated that the mean sum of squares due to between families for all the characters were highly significant in both M2 and M3
indicating the induction of genetic variability through irradiation (Table 1 and 2). Wide variability for different characters observed within different mutant families in comparison to control might be accounted for by the accumulation of micromutations through segregation of mutant genes.
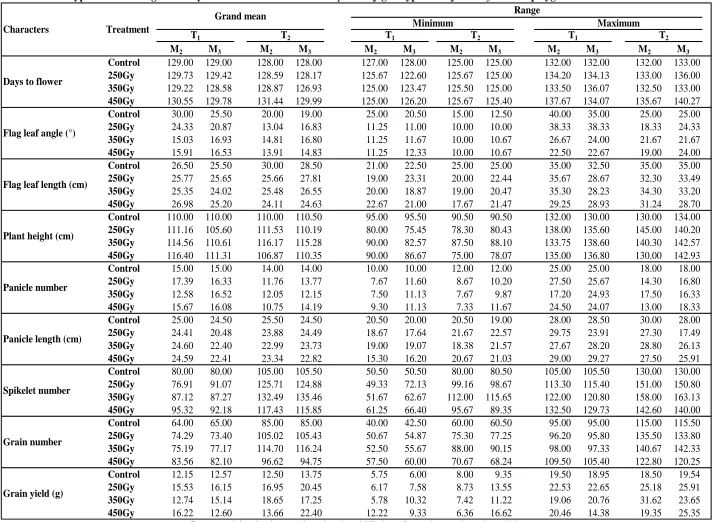
The mutagenic treatments induced wider range of values (Table 3) compared with control (positive or negative direction) for all the economic characters in M2
generation. In this regard, high doses of gamma ray (350Gy and 450Gy) deserve a special mention for inducing wide variability particularly for flag leaf angle, plant height, spikelet number, grain number and grain yield. However, in general, the mean values of M2
families for days to flower, flag leaf length, plant height, panicle number, panicle length, spikelet number per panicle, grain number per panicle and grain yield per plant did not deviate substantially from that of respective control population. But, there was an increase in mean values of grain number per panicle and grain yield per plant at 450Gy in T1; spikelet number and grain number
Source df Days to flower
Flag leaf angle
Flag leaf length
Plant height
Panicle number
Panicle length
Spikelet number
Grain number
Grain yield
Between families 28 18.44* 124.74** 65.13** 726.86* 68.28* 41.33** 1574.30* 1165.20** 92.14** Within families 116 10.43 60.14 24.9 375.1 44.14 17.94 620.49 443.28 21.48
Between families 20 25.29** 67.09** 18.27** 541.93* 28.16* 22.99* 2212.80**1282.70** 53.38** Within families 84 11.42 28.73 4.02 225.6 14.36 11.48 772.48 450.8 22.33
Between families 28 43.80* 94.93** 14.19** 854.62** 48.26** 33.78** 1989.20**1154.30** 69.94* Within families 116 11.99 51.1 4.57 334.29 18.54 8.44 843.47 564.27 31.20
Between families 15 29.77* 39.65* 32.34* 1488.40* 14.38* 19.99* 1414.80* 1382.60** 92.28* Within families 64 14.89 21.84 11.67 444.05 5.42 9.79 630.8 429.26 42.45
Between families 10 77.46** 90.93* 46.88** 1387.40* 21.81* 25.98** 1328.80* 1189.70* 127.03* Within families 44 19.72 44.36 11.26 621.81 9.26 8.55 648.39 584.13 46.85
Between families 7 51.54** 31.76* 37.31* 1679.60* 15.43* 14.48* 1354.40* 995.26* 48.67** Within families 32 16.33 12.59 12.49 580.08 6.69 6.2 547.06 413.57 20.84
Source df Days to flower
Flag leaf angle
Flag leaf length
Plant height
Panicle number
Panicle length
Spikelet number
Grain number
Grain yield
Between families 9 98.56** 123.96** 45.04* 625.83** 82.85* 14.32* 1886.60** 1366.20* 96.96** Within families 140 7.82 7.19 18.66 224.53 38.34 6.21 581.7 656.45 21.28
Between families 9 74.05** 71.78** 51.11* 529.77** 50.78** 23.90** 2087.30** 742.26** 39.46** Within families 140 1.99 9.38 22.28 131.69 22.25 5.98 645.72 225.25 13.67
Between families 9 58.80** 82.67** 86.62** 461.59** 60.78* 30.55** 2317.30* 1266.10* 51.09* Within families 140 1.46 13.38 31.75 151.17 28.03 8.49 1091.34 515.86 19.85
Between families 9 30.45** 38.24** 56.92** 645.59** 12.88* 13.49* 1222.60** 789.22* 88.26** Within families 140 1.52 12.69 17.12 211.02 5.21 5.64 470.82 342.99 34.48
Between families 9 28.37** 35.26** 36.36** 575.94** 14.02* 17.77* 1897.90**1185.00** 59.37* Within families 140 2.09 11.05 11.37 189.1 6.16 7.53 444.25 469.09 26.86
Between families 9 40.29** 42.09* 40.36** 592.03** 12.32* 16.18* 1676.10** 972.76** 78.59** Within families 140 1.6 18.36 12.87 197.94 5.39 6.34 487.99 428.92 19.33
*, ** Significant at P = 0.05 , 0.01 respectively
350Gy
450Gy 350Gy
450Gy
350Gy
450Gy
T2 genotype
250Gy 250Gy T1 genotype
250Gy
Table 1. ANOVA for between and within families in M2 generation for nine characters in four aromatic rice
genotypes in three treatments
T1 genotype
Table 2. ANOVA for between and within families in M3 generation for nine characters in four aromatic rice
genotypes in three treatments
350Gy
450Gy
T2 genotype
250Gy
observed for flag leaf angle at all three doses in both genotypes.
Gopinathan Nair (1972) reported that the mean values for various quantitative characters in rice were not altered significantly following treatments with radiations. The
Gamma ray induced early generation polygenic variability in medium grain aromatic non-basmati rice be attributed to the induction of a higher proportion of
positive mutations than the negative ones.
All the selected 60 M2 plants were aromatic and testing of
25 M3 seeds from each of the 60 M2 plants indicated
true-breeding nature of aroma. This is expected as aroma in this group of rice is controlled by a single recessive gene pair (Kole, 2005). Moreover, chances of obtaining non-aromatic plants in mutated population are less, because frequency of dominant mutation, in general, is less. In M3 generation, wide range of variation (Table 3) among
different mutant families derived from a radiation dose was observed for all the polygenic characters in both the genotypes. However, variation within some mutant families decreased over M2 generation due to increase in
homozygosity.
Flag leaf angle at all three doses in both genotypes showed lower mean than control in M3. The mean values
of spikelet number, grain number and grain yield per plant at all doses of gamma radiation in both genotypes were higher than their respective control. The shift in mean of characters in M3 could be due to the elimination
of detrimental effects through selfing in M2.
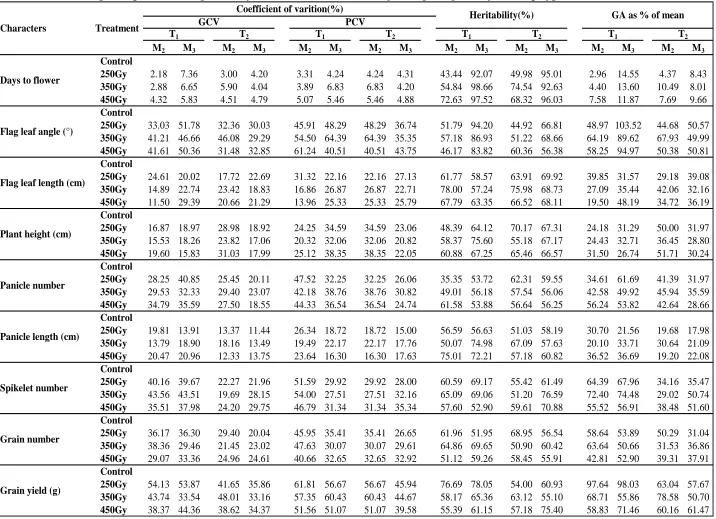
Phenotypic and Genotypic Coefficients of Variation (PCV and GCV)
The highest estimates of PCV (39.58 to 61.81%) and GCV (33.16 to 54.13%) were observed in grain yield in bothT1 and T2 genotypes in M2 generation as well as M3
generation across the three doses (Table 4) followed by flag leaf angle while, lowest estimates were observed for days to flower (2.18% to 7.36%). These estimates, in general, were high in M2 generation as expected, which
was particularly so in T2 mutants. However, PCV and
GCV increased in M3 generation in mutant families of T1
for days to flower, flag leaf angle and panicle number in all doses indicating the presence of hidden variability in M2 generation. Thus it might be better to wait till M3
generation to start practicing selection for these characters. Besides, five out of remaining six characters showed increase in these estimates at 450Gy.
In addition, the values of GCV and PCV were high (>20%) for flag leaf angle, spikelet number, panicle number and grain number per panicle in both T1 and T2
mutant families in both M2 and M3 generations at all three
doses. For flag leaf length, GCV and PCV were high at all the three doses in M3 generation in both T1 and T2 (except
at 350Gy). High estimates of GCV and PCV at 450Gy in both generations were observed in T1 for panicle length,
which showed moderate values at the remaining doses and in T2. For plant height, high PCV were observed in
mutants of both genotypes in both generations while high GCV were observed in M2 generation among T2 mutants
only. Remaining character and dose combinations showed moderate GCV and PCV.
Similar results with high GCV and PCV values for flag leaf angle (Basak and Ganguli, 1996), panicle number
(Hasib and Kole, 2004), spikelet number (Hasib, 2005), grain number (Kole and Hasib, 2003; Hasib and Kole, 2004) and grain yield (Kole and Hasib, 2003; Hasib and Kole, 2004; Hasib, 2005) were reported earlier.
Moderate GCV and PCV for plant height (Hasib et al.,
2000; Kole and Hasib, 2003), low GCV and PCV for days to flower (Hasib and Kole, 2004) and panicle length (Hasib and Kole 2008) have also been reported.
From M2 generation to M3 generation, variability
increased for flag leaf length at 350Gy and 450Gy in T1
and at 250Gy in T2, and spikelet number per panicle at
350Gy in T2, which could be attributed to increase in
genetic variation due to release of potential variability existed in M2 generation. However, it decreased for flag
leaf length at 350Gy in T2 and plant height at all three
doses in T2.
Heritability
The heritability estimates (Table 4) were moderate (<75%) for most of the characters in both the generations at different doses of gamma ray. However, estimates were high in M3 generation among mutant families of both
the genotypes for days to flower, and for flag leaf angle in T1 mutants only. In addition, heritability estimates were
high in few trait-dose-genotype-generation combinations. For instance, heritability was high in M2 generation for flag
leaf length at 350Gy in the mutant families of both T1 and
T2; and in M3 generation for grain yield per plant at 250Gy
only in T1 and at 450Gy in T2, plant height at 350Gy in T1,
panicle length at 450Gy in T1 and spikelet number at
350Gy in T2. Further, mutants of T1 showed low
heritability for days to flower and plant height at 250Gy, flag leaf angle at 450Gy, and panicle number at 250 and 350Gy in M2 generation. In T2 mutants, all treatment-trait
combinations showed either moderate (in most cases) or high heritability in both M2 and M3 generations except
days to flower and flag leaf angle at 250Gy, which recorded low estimates in M2.
High estimates of heritability in above economic characters in both generations indicated a close correspondence between the genotype and the phenotype and hence, single plant selection could be effective for these characters. The results are in agreement with Hasib and Kole (2004) for days to flowering, plant height and grain yield. Kole and Hasib (2003) and Hasib (2005) also obtained high heritability for grain yield and panicle length. High heritability has also been reported by Hasib et al. (2000) for days to flower and grain number, and Basak and Ganguli (1996) for spikelet number and flag leaf angle. However, moderate to low heritability for panicle number (Hasib et al., 2000; Kole and Hasib, 2003), grain number (Kole and Hasib, 2003) and plant height (Hasib et al., 2000) have also been reported.
Heritability increased from M2 to M3 generations
M2 M3 M2 M3 M2 M3 M2 M3 M2 M3 M2 M3
Control 129.00 129.00 128.00 128.00 127.00 128.00 125.00 125.00 132.00 132.00 132.00 133.00
250Gy 129.73 129.42 128.59 128.17 125.67 122.60 125.67 125.00 134.20 134.13 133.00 136.00
350Gy 129.22 128.58 128.87 126.93 125.00 123.47 125.50 125.00 133.50 136.07 132.50 133.00
450Gy 130.55 129.78 131.44 129.99 125.00 126.20 125.67 125.40 137.67 134.07 135.67 140.27
Control 30.00 25.50 20.00 19.00 25.00 20.50 15.00 12.50 40.00 35.00 25.00 25.00
250Gy 24.33 20.87 13.04 16.83 11.25 11.00 10.00 10.00 38.33 38.33 18.33 24.33
350Gy 15.03 16.93 14.81 16.80 11.25 11.67 10.00 10.67 26.67 24.00 21.67 21.67
450Gy 15.91 16.53 13.91 14.83 11.25 12.33 10.00 10.67 22.50 22.67 19.00 24.00
Control 26.50 25.50 30.00 28.50 21.00 22.50 25.00 25.00 35.00 32.50 35.00 35.00
250Gy 25.77 25.65 25.66 27.81 19.00 23.31 20.00 22.44 35.67 28.67 32.30 33.49
350Gy 25.35 24.02 25.48 26.55 20.00 18.87 19.00 20.47 35.30 28.23 34.30 33.20
450Gy 26.98 25.20 24.11 24.63 22.67 21.00 17.67 21.47 29.25 28.93 31.24 28.70
Control 110.00 110.00 110.00 110.50 95.00 95.50 90.50 90.50 132.00 130.00 130.00 134.00
250Gy 111.16 105.60 111.53 110.19 80.00 75.45 78.30 80.43 138.00 135.60 145.00 140.20
350Gy 114.56 110.61 116.17 115.28 90.00 82.57 87.50 88.10 133.75 138.60 140.30 142.57
450Gy 116.40 111.31 106.87 110.35 90.00 86.67 75.00 78.07 135.00 136.80 130.00 142.93
Control 15.00 15.00 14.00 14.00 10.00 10.00 12.00 12.00 25.00 25.00 18.00 18.00
250Gy 17.39 16.33 11.76 13.77 7.67 11.60 8.67 10.20 27.50 25.67 14.30 16.80
350Gy 12.58 16.52 12.05 12.15 7.50 11.13 7.67 9.87 17.20 24.93 17.50 16.33
450Gy 15.67 16.08 10.75 14.19 9.30 11.13 7.33 11.67 24.50 24.07 13.00 18.33
Control 25.00 24.50 25.50 24.50 20.50 20.00 20.50 19.00 28.00 28.50 30.00 28.00
250Gy 24.41 20.48 23.88 24.49 18.67 17.64 21.67 22.57 29.75 23.91 27.30 17.49
350Gy 24.60 22.40 22.99 23.73 19.00 19.07 18.38 21.57 27.67 28.20 28.80 26.13
450Gy 24.59 22.41 23.34 22.82 15.30 16.20 20.67 21.03 29.00 29.27 27.50 25.91
Control 80.00 80.00 105.00 105.50 50.50 50.50 80.00 80.50 105.00 105.50 130.00 130.00
250Gy 76.91 91.07 125.71 124.88 49.33 72.13 99.16 98.67 113.30 115.40 151.00 150.80
350Gy 87.12 87.27 132.49 135.46 51.67 62.67 112.00 115.65 122.00 120.80 158.00 163.13
450Gy 95.32 92.18 117.43 115.85 61.25 66.40 95.67 89.35 132.50 129.73 142.60 140.00
Control 64.00 65.00 85.00 85.00 40.00 42.50 60.00 60.50 95.00 95.00 115.00 115.50
250Gy 74.29 73.40 105.02 105.43 50.67 54.87 75.30 77.25 96.20 95.80 135.50 133.80
350Gy 75.19 77.17 114.70 116.24 52.50 55.67 88.00 90.15 98.00 97.33 140.67 142.33
450Gy 83.56 82.10 96.62 94.75 57.50 60.00 70.67 68.24 109.50 105.40 122.80 120.25
Control 12.15 12.57 12.50 13.75 5.75 6.00 8.00 9.35 19.50 18.95 18.50 19.54
250Gy 15.53 16.15 16.95 20.45 6.17 7.58 8.73 13.55 22.53 22.65 25.18 25.91
350Gy 12.74 15.14 18.65 17.25 5.78 10.32 7.42 11.22 19.06 20.76 31.62 23.65
450Gy 16.22 12.60 13.66 22.40 12.22 9.33 6.36 16.62 20.46 14.38 19.35 25.35
Minimum Maximum
T1 T2 T1 T2
Plant height (cm)
Panicle number
Table 3. Phenotypic variation in gamma ray induced mutant families of T
1and T
2genotypes in M
2and M
3for nine polygenic traits
Range
Grain number
Grain yield (g) Panicle length (cm)
Spikelet number Flag leaf angle (°)
Flag leaf length (cm)
T1 T2
Days to flower
Characters Treatment
Gamma ray induced early generation polygenic variability in medium grain aromatic non-basmati rice
M2 M3 M2 M3 M2 M3 M2 M3 M2 M3 M2 M3 M2 M3 M2 M3
Control
250Gy 2.18 7.36 3.00 4.20 3.31 4.24 4.24 4.31 43.44 92.07 49.98 95.01 2.96 14.55 4.37 8.43
350Gy 2.88 6.65 5.90 4.04 3.89 6.83 6.83 4.20 54.84 98.66 74.54 92.63 4.40 13.60 10.49 8.01
450Gy 4.32 5.83 4.51 4.79 5.07 5.46 5.46 4.88 72.63 97.52 68.32 96.03 7.58 11.87 7.69 9.66
Control
250Gy 33.03 51.78 32.36 30.03 45.91 48.29 48.29 36.74 51.79 94.20 44.92 66.81 48.97 103.52 44.68 50.57
350Gy 41.21 46.66 46.08 29.29 54.50 64.39 64.39 35.35 57.18 86.93 51.22 68.66 64.19 89.62 67.93 49.99
450Gy 41.61 50.36 31.48 32.85 61.24 40.51 40.51 43.75 46.17 83.82 60.36 56.38 58.25 94.97 50.38 50.81
Control
250Gy 24.61 20.02 17.72 22.69 31.32 22.16 22.16 27.13 61.77 58.57 63.91 69.92 39.85 31.57 29.18 39.08
350Gy 14.89 22.74 23.42 18.83 16.86 26.87 26.87 22.71 78.00 57.24 75.98 68.73 27.09 35.44 42.06 32.16
450Gy 11.50 29.39 20.66 21.29 13.96 25.33 25.33 25.79 67.79 63.35 66.52 68.11 19.50 48.19 34.72 36.19
Control
250Gy 16.87 18.97 28.98 18.92 24.25 34.59 34.59 23.06 48.39 64.12 70.17 67.31 24.18 31.29 50.00 31.97
350Gy 15.53 18.26 23.82 17.06 20.32 32.06 32.06 20.82 58.37 75.60 55.18 67.17 24.43 32.71 36.45 28.80
450Gy 19.60 15.83 31.03 17.99 25.12 38.35 38.35 22.05 60.88 67.25 65.46 66.57 31.50 26.74 51.71 30.24
Control
250Gy 28.25 40.85 25.45 20.11 47.52 32.25 32.25 26.06 35.35 53.72 62.31 59.55 34.61 61.69 41.39 31.97
350Gy 29.53 32.33 29.40 23.07 42.18 38.76 38.76 30.82 49.01 56.18 57.54 56.06 42.58 49.92 45.94 35.59
450Gy 34.79 35.59 27.50 18.55 44.33 36.54 36.54 24.74 61.58 53.88 56.64 56.25 56.24 53.82 42.64 28.66
Control
250Gy 19.81 13.91 13.37 11.44 26.34 18.72 18.72 15.00 56.59 56.63 51.03 58.19 30.70 21.56 19.68 17.98
350Gy 13.79 18.90 18.16 13.49 19.49 22.17 22.17 17.76 50.07 74.98 67.09 57.63 20.10 33.71 30.64 21.09
450Gy 20.47 20.96 12.33 13.75 23.64 16.30 16.30 17.63 75.01 72.21 57.18 60.82 36.52 36.69 19.20 22.08
Control
250Gy 40.16 39.67 22.27 21.96 51.59 29.92 29.92 28.00 60.59 69.17 55.42 61.49 64.39 67.96 34.16 35.47
350Gy 43.56 43.51 19.69 28.15 54.00 27.51 27.51 32.16 65.09 69.06 51.20 76.59 72.40 74.48 29.02 50.74
450Gy 35.51 37.98 24.20 29.75 46.79 31.34 31.34 35.34 57.60 52.90 59.61 70.88 55.52 56.91 38.48 51.60
Control
250Gy 36.17 36.30 29.40 20.04 45.95 35.41 35.41 26.65 61.96 51.95 68.95 56.54 58.64 53.89 50.29 31.04
350Gy 38.36 29.46 21.45 23.02 47.63 30.07 30.07 29.61 64.86 69.65 50.90 60.42 63.64 50.66 31.53 36.86
450Gy 29.07 33.36 24.96 24.61 40.66 32.65 32.65 32.92 51.12 59.26 58.45 55.91 42.81 52.90 39.31 37.91
Control
250Gy 54.13 53.87 41.65 35.86 61.81 56.67 56.67 45.94 76.69 78.05 54.00 60.93 97.64 98.03 63.04 57.67
350Gy 43.74 33.54 48.01 33.16 57.35 60.43 60.43 44.67 58.17 65.36 63.12 55.10 68.71 55.86 78.58 50.70
450Gy 38.37 44.36 38.62 34.37 51.56 51.07 51.07 39.58 55.39 61.15 57.18 75.40 58.83 71.46 60.16 61.47
Table 4. Estimates of genetic parameters in gamma ray induced mutant families of T
1and T
2in M
2and M
3for nine polygenic traits
Characters Treatment
Coefficient of varition(%)
Heritability(%) GA as % of mean
GCV PCV
T1 T2
T1 T2 T1 T2
Days to flower
Flag leaf angle (°)
Grain number
Grain yield (g)
T1 T2
Flag leaf length (cm)
Plant height (cm)
Panicle number
Panicle length (cm)
450Gy in T2; flag leaf angle at all three doses in T1; plant
height and panicle length at 350Gy in T1; spikelet number
per panicle at 350Gy in T2 and grain yield per plant at
450Gy in T2. Increase in the estimates of heritability of
such characters is due to higher contribution of genetic factors, which might have resulted due to release of potential variability present in M2 generation. In M3
generation, heritability decreased for flag leaf length at 350Gy in T1 and T2. Decrease in the estimates of
heritability of this character is due to reduction in genetic variability as a result of increase in homozygosity in the mutant populations.
Genetic Advance
The estimates of genetic advance (Table 4) were high for grain yield (50.70% in T2 at 350Gy in M3 generation to
97.64% in T1 at 450Gy in M2 generation) while it was low
for days to flower (2.96% to 14.55% in T1 at 250Gy in M2
generation) at all the combinations of dose-genotype-generation. Besides, in the mutant families of T1 high
genetic advance were recorded for grain number and spikelet number at all dose-generation combinations. Some combinations of trait-dose-genotype-generation showed more than or close to 50% genetic advance e.g., flag leaf angle at all combinations and grain number as well as spikelet number in T1. Most of the remaining
combinations recorded moderate genetic advance and it was more so for the mutant families of T2.
However, the values of genetic advance were low in the mutant families of T1 for flag leaf length at 450Gy in M2,
plant height at 250 and 350Gy in M2, panicle length at
350Gy in M2 and at 250Gy in M3 generation. The same
was true for panicle length at 250 and 450Gy in M2
generation and at all three doses in M3 generation in the
mutants of T2 genotype.
The high estimates of genetic advance as per cent of mean obtained in the present study are in agreement with the results of Basak and Ganguli (1996) for flag leaf angle, panicle number, spikelet number per panicle, grain number per panicle; Hasib et al. (2000), Kole and Hasib (2003) and Hasib and Kole (2004) for grain number per panicle and grain yield per plant and Hasib (2005) for spikelet number per panicle and grain yield per plant.
As in the present study, estimates of genetic advance in both M2 and M3 were low in the earlier studies
for days to flower (Hasib et al., 2000; Kole and Hasib, 2003) and panicle length (Hasib and Kole, 2004; Kole and Hasib, 2003; Hasib, 2005). Moderate genetic advance for plant height was recorded by Hasib et al. (2000) and Kole and Hasib (2003).
Some of the characters showed increase in genetic advance in M3 over M2 generation, the frequency
of which was more in the mutants of T1 (days to flower,
flag leaf angle and spikelet number across the doses; Flag leaf length and panicle length at 350 and 450Gy;
flag leaf angle at 250Gy; panicle number at 250Gy and grain number at 450Gy). Similar results were obtained in very few trait-dose combinations in T2, such as spikelet
number across doses; days to flower, flag leaf length and flag leaf angle at 250 and 450Gy; grain number at 350Gy and panicle length at 450Gy. Such increase could be attributed to increase in variation and heritability in M3
generation due to release of hidden variability (Solanki and Sharma, 2001).
Genetic advance as percentage of mean decreased in T2 genotypes from M2 to M3 generation for
flag leaf angle at 350Gy, plant height at 450Gy and grain number at 250Gy. In the M3 generation, the genetic
advance as percent of mean for different characters decreased owing to increase in means (Solanki and Sharma, 2001).
According to Johnson et al. (1955) and Lerner (1958) heritability when used in conjunction with genetic advance provides better information for selecting the best individuals than the heritability alone. High to moderate estimates of heritability accompanied with high to moderate genetic advance indicated the predominance of additive gene action for the expression of the characters in respective generation, which further indicated that selection would be effective for improving such characters.
In M2 generation, high to moderate heritability
accompanied with high to moderate genetic advance were observed for flag leaf angle at 450 Gy in T2; plant
height at 450 Gy in T1 and at 250Gy and 450Gy in T2;
panicle length at 450Gy in T1; flag leaf length, spikelet
number, grain number and grain yield per plant at all three doses in both the genotypes.
In M3 generation, high to moderate heritability
along with high to moderate genetic advance were observed for panicle number, flag leaf angle, spikelet number per panicle, grain number per panicle and grain yield per plant at all three doses in both the genotypes
The results of PCV, GCV, h2 and GA revealed
differential response of polygenic characters to different doses of mutagen. It would be worth noting that flag leaf angle recorded high genetic variation, high to moderate heritability and genetic advance coupled with decreased mean value over control in both M2 and M3. Thus it would
Gamma ray induced early generation polygenic variability in medium grain aromatic non-basmati rice degree to which the parental genome operates as a
balanced set. Ganeshan and Subramanian (1990) stated that change in the direction from one segregating generation to next segregating generation might be due to differential segregation and recombination, whereas change in a particular direction between generations may result from change in gene frequency due to selection. The M2 being the first segregating generation, it would be
reasonable to expect the manifestation of mutagen-induced variability in the M2 itself. Selection in M2 can
certainly help identify progenies that are likely to show more variability and better response to selection and simultaneously reduce the volume of unwanted material by rejecting the unmutated “roughage” (Sharma, 1986). The increase in variability of different characters in M3
generation over M2 generation was due to the “release of
additional variability” in M3 (Solanki and Sharma, 2001).
The “release of additional variability” might be due to segregation and recombination of mutant genes induced through radiation treatment.
Decrease in variability of different characters in both genotypes in M3 over M2 was due to increase in
homozygosity in M3. Increase in homozygosity is
sometimes quickly attained due to inheritance of mutant genes as a block. The change in the values of different genetic parameters over generations may be due to changes in the genetic components of the populations. From one segregating generation to the next the dominance components decreased due to increase in homozygosity. Shebeski (1967) advocated that the most desirable gene combinations could be identified even in the heterozygous population and proportion of plants with the most desirable combination of genes decreases rapidly with the advancing generations and these may be lost if not selected in the early generations.
The outcomes of the present study have given strong cues for higher chances of success in the macro-mutational population for isolation of promising progeny even for polygenic variants (Solanki and Sharma, 1999 and Tikoo and Chandra, 1999). In fact, selection for polygenic characters can also be applied to the normal looking M2 plants, for concentration on such progenies
can lead to a great economy of effort with simultaneous improvement in selection efficiency (Sarkar and Sharama, 1988). The heterozygotes for macromutations among such promising selections can be discarded on the basis of segregation in M3 generation.
CONCLUSION
The present studies conclude that breeders point of view, working with a reduced volume of mutagenized material which was obtained in M2 and M3, by rejecting unwanted
material and selecting desirable ones in M2,
consequently, resulting in higher frequency of promising progenies. Higher estimates of heritability and genetic
advance for different characters were observed in both the generations. Thus there is ample scope for improving the grain yield and its component characters in aromatic rice, especially where aroma is controlled by single recessive gene pair(s), by exercising selection in M2 and
M3 generations.
ACKNOWLEDGEMENT
The authors are thankful to the Department of Crop Improvement, Horticulture and Agricultural Botany, Visa-Bharati University for providing the facilities to carry out the work.
REFERENCES
Amirthadevarathinam A, Sevugaperumal S, Soundarapandian G (1990). Induced polygenic variability in rice. Madras Agric J 77: 525-528.
Basak AK, Ganguli PK (1996). Variability and correlation studies on yield and yield components in induced plant type mutants of rice. Indian Agric 40: 171-181.
Borojevic S (1990). Mutations in plant breeding. In:
Principles and methods of plant breeding. Elsevier Science Publishing Company INC. New York, USA. pp. 252-262.
Brock RD (1970). Mutations in quantitatively inherited characters induced by neutron irradiation. Rad Bot 10: 209-223.
Brunner H (1991). Methods of induction of mutations. In:
Advances in Plant Breeding (eds Mandal AK, Ganguli PK, Banerjee SP) CBS Publishers and Distributors, Delhi, India. Vol. I, pp. 187-220
Burton GW (1952). Quantitative inheritance in grasses.
Proc. 6th Int. Grassland Cong. 1: 277-283.
Ganeshan K, Subramanian M (1990). Genetic studies of the F2 and F3 tall semidwarf rice varieties. Int Rice
Res Newsl 15: 5.
Gopinathan Nair V (1972). Studies on induced mutations in rice (Oryza sativa L.) Ph.D. Thesis (unpubl.), University of Madras, India.
Hasib KM, Kole PC (2004). Cause and effect relationship for yield and its components in scented rice hybrids involving gamma ray induced mutants. J Nuclear Agric Biol 33: 49-55.
Hasib KM, Ganguly PK, Kole PC (2000). Variability, heritability, and genetic advance in F2 populations of
aromatic rice involving induced mutants and Basmati varieties. J Nuclear Agric Biol 29: 201-206.
Hasib KM (2005). Genetic variability, interrelations and path analysis for panicle characters in scented rice.
Crop Res 30: 37-39.
Hasib KM, Kole PC (2008). Genetic variability for panicle characters in segregating populations of aromatic rice.
Madras Agric J 95: 174-178.
of genetic and environmental variability in soybeans.
Agron J 47: 314-318.
Kharkwal MC, Pandey RN, Pawar SE (2004). Mutation Breeding for crop improvement. In: Plant Breeding- Mendelian to Molecular Approaches (eds. Jain HK , Kharwal MC), Narosa Publication House, New Delhi, India, pp. 601-645.
Kole PC, Hasib KM (2003). Interrelationship and path analysis in some mutant mutant and mutant parent hybrids of aromatic rice. J Nuclear Agric Biol 32: 108-114.
Kole PC (2005). Inheritance of aroma in rice. Acta Agron.Hung 53: 439-441.
Lerner IM (1958). The genetic basis of selection John Willey and Sons, New York, pp. 57-65.
Madhusudana Rao G, Siddiq EA (1976). Studies on induced variability for amylose content with reference to yield components and protein characteristics in rice.
Env Exp Bot 16: 177-188.
Sarkar A, Sharma B (1988). Efficiency of early generation selection for induced polygenic mutations in lentil (Lens culinaris Medik). Indian J Genet 48: 155-159.
Sharma B (1986). Increasing the efficiency of mutagenesis for micromutations by early generation selection. Indian J Genet (suppl.) 46: 88-100.
Shebeski LH (1967). Wheat and Breeding In: Proc. Canadian Centennial Wheat Symp, Modern press, Saskatoon. Saskatchewan, Canada, pp. 253.
Sigurbjornsson B, Micke A (1974). Philosophy and accomplishment of mutation breeding. In: Polyploidy and induced mutations in plant Breeding, IAEA, Vienna pp. 303-343.
Singh V, Bhattacharya KR, Mahadevappa M (1986). A reliable test for identification of scented rice. Oryza, 23: 249-251.
Snedecor GW, Cochran WG (1967). Statistical Methods. Oxford & IBH Publ. Co., Calcutta, India.
Solanki IS and Sharma B (1999). Induction and exploitation of polygenic variability in lentil (Lens culinaris Medik). J Genet & Breed 53: 79-86.
Solanki IS, Sharma B (2001). Early generation selection of polygenic mutations in lentil (Lens culinaris
Medik). Indian J Genet 61: 330-334.
Tikoo JL, Chandra N (1999). Mutagen induced polygenic variability in mungbean (Vigna radiata Wilczec). Indian J Genet 59: 193-201.
Accepted 15 November, 2014
Citation: Chakraborty NR, Kole PC (2014). Gamma ray induced early generation polygenic variability in medium grain aromatic non-basmati rice. International Journal of Plant Breeding and Crop Science, 1(3): 028-035.