DOI: 10.1534/genetics.105.048447
Allele Frequency Distribution Under Recurrent Selective Sweeps
Yuseob Kim
1Department of Biology, University of Rochester, Rochester, New York 14620
Manuscript received July 18, 2005 Accepted for publication November 29, 2005
ABSTRACT
The allele frequency of a neutral variant in a population is pushed either upward or downward by direc-tional selection on a linked beneficial mutation (‘‘selective sweeps’’). DNA sequences sampled after the fixation of the beneficial allele thus contain an excess of rare neutral alleles. This study investigates the allele frequency distribution under selective sweep models using analytic approximation and simulation. First, given a single selective sweep at a fixed time, I derive an expression for the sampling probabilities of neutral mutants. This solution can be used to estimate the time of the fixation of a beneficial allele from sequence data. Next, I obtain an approximation to mean allele frequencies under recurrent selective sweeps. Under recurrent sweeps, the frequency spectrum is skewed toward rare alleles. However, the excess of high-frequency derived alleles, previously shown to be a signature of single selective sweeps, disappears with recurrent sweeps. It is shown that, using this approximation and multilocus polymorphism data, genome-wide parameters of directional selection can be estimated.
T
HE origin and spread of mutations that increase their carriers’ reproductive success are fundamen-tal processes of Darwinian evolution. In contrast to dele-terious and neutral mutations, beneficial mutations in plants and animals occur too infrequently to be ob-served directly in laboratories. As a result, we know much less about beneficial mutations (positive selection) than about neutral or deleterious mutations (purifying selec-tion). Many basic facts about beneficial mutations—their rate, fitness effects, genomic locations, and molecular properties—remain unknown. Recent developments in population genetic theory, however, have suggested some promising approaches to obtaining these quanti-ties. Given that beneficial mutations occur very rarely, basic information about them can be obtained only by inferring past evolutionary events of positive selection. As in other problems of evolutionary inference, the dom-inant approach is to search present-day sequence poly-morphism and diversity for the footprint of past events, in this case, for the signature of genetic hitchhiking.Genetic hitchhiking (or ‘‘selective sweeps’’) is the sudden loss of genetic variation at neutral loci when a new beneficial allele arises nearby and is fixed in the population (MaynardSmithand Haigh1974; Kaplan
et al. 1989; Stephanet al.1992; Barton2000). Recent
selective sweeps are expected to generate specific patterns of sequence variation, including a local re-duction of variation (Kimand Stephan2002), a skew
in the allele frequency distribution (Bravermanet al.
1995; Fay and Wu 2000), and an increase in linkage
disequilibrium (Thomson1977; Przeworski2002; Kim
and Nielsen2004). Developments of hitchhiking
the-ory, along with the rapid increase of DNA sequence data, have led to the discovery of many episodes of re-cent positive selection in natural populations (for ex-ample, Enardet al.2002; Clarket al.2004; Schlenke
and Begun2004).
It is more difficult, however, to measure the cumula-tive effect of recurrent seleccumula-tive sweeps throughout the genome. The main effect of recurrent selective sweeps is to reduce the standing level of variation, which is well understood (Kaplan et al.1989; Wieheand Stephan
1993; Gillespie2000). In particular, since
recombina-tion reduces the hitchhiking effect, a positive correla-tion between local recombinacorrela-tion rate and sequence diversity is predicted under recurrent sweeps. Such a correlation has been observed inDrosophila melanogaster (Begunand Aquadro1992) and was used to estimate
the intensity of directional selection,al, whereais the scaled selection coefficient and l is the frequency of hitchhiking events (Wieheand Stephan1993; Stephan
1995; Andolfatto2001). However, this calculation
as-sumes that selective sweeps alone create the correlation between recombination and genetic variation. In reality, the constant removal of deleterious mutations along the genome by purifying selection (‘‘background selec-tion’’; Charlesworthet al.1993) also reduces the level
of variation and contributes to the relationship between recombination and variation (Hudson and Kaplan
1995; Charlesworth1996). Therefore, fitting observed
levels of variation to selective sweep models yields only an overestimate ofal.
1Address for correspondence: Center for Evolutionary Functional Ge-nomics, The Biodesign Institute, Arizona State University, Tempe, AZ 85287-5301. E-mail: [email protected]
A second signature of the hitchhiking effect is evident in the distribution of neutral allele frequencies. With partial recombination, the hitchhiking effect causes neutral variants at intermediate frequencies to increase close to fixation or to decrease close to extinction. A sample of DNA sequences affected by selective sweeps thus contains fewer segregating alleles of intermediate frequency than expected under neutral equilibrium (Bravermanet al.1995). Background selection, on the
other hand, only slightly changes the frequency spec-trum (Golding 1997; Przeworski et al. 1997). Thus,
it may be possible to isolate the effect of directional selection from that of purifying selection by examining frequency spectra throughout the genome. For exam-ple, the observation in Andolfattoand Przeworski
(2001) that regions of theD. melanogastergenome with reduced crossing over harbor more rare variants can be used to support the hypothesis that recurrent selective sweeps affect neutral loci throughout the genome. Examination of frequency spectra may further allow us to estimate parameters of directional selection. This requires an analytic solution for sampling probabilities under selective sweep models.
Using a simple model of hitchhiking and a well-known diffusion approximation, this study first derives an approximation to allele frequency distribution for a given time after one selective sweep event. This solution then leads to an approximation under recurrent selec-tive sweeps. These approximations, along with coales-cent simulations, are used to investigate patterns of polymorphism under recurrent selective sweeps and to calculate maximum-likelihood estimates of the param-eters of directional selection.
SIMULATION METHODS
To investigate the frequency spectrum after recur-rent selective sweeps, the coalescent-with-recombination algorithm of Kimand Stephan(2002) is used with
mod-ifications (described below). A genealogy (ancestral recombination graph) is constructed for a sample ofn sequences. Time is counted backward into the past in units of either 4Ngenerations (during the neutral phase) or single generations (during the selective phase). Each sequence isMnucleotides (sites) long and recombina-tion between adjacent sites occurs with probabilityrper generation. The ancestral recombination graph starts withn edges at time 0. Recombination and coalescent events occur according to probabilities given in Kimand
Stephan(2002).
Simulations are performed under two different mod-els: a single selective sweep at a given time or recurrent selective sweeps. The genealogy for the single-sweep model has one selective phase, which begins at timet. This simulation is identical to that in Kimand Stephan
(2002), except that it uses the simulated trajectory of beneficial allele frequency (see below). For the
re-current sweep model, the construction of a genealogy begins with the neutral phase, which lasts for tnunits (4Ntngenerations).tnis exponentially distributed with mean 1/L¼1/(4NMl), wherelis the rate of strongly selected substitutions per generation per site. When the neutral phase ends, the selective phase begins, followed by another neutral phase. This process is repeated until the height of the ancestral recombination graph (cu-mulative time from the present) reachesTlimit¼5 (20N generations). For each selective phase, the location of the beneficial allele is chosen randomly between 1 andM. Before each selective phase begins, the time-dependent frequency of two genetic backgrounds—the beneficial allele (B) and the ancestral allele (b)—is predetermined by a forward simulation as described by Innanand Kim
(2004). It is modeled such that the beneficial allele starting from a single copy is fixed in a diploid pop-ulation of sizeNin which the fitnesses of genotypesbb, Bb, andBBare 1, 112hs, and 112s, respectively. For these simulations, I usedN¼105, but the outcome of the
selective sweep simulations depends little onNas long asa¼2Nsis constant (data not shown).
The allele frequency distribution is observed either at fixed distances from the location of selection (single-sweep model) or from a short (1 or 2 kb long) segment in the center of the chromosome (recurrent sweep model). For the latter, marginal coalescent trees for sites M/2499 toM/21500 (for a 1-kb segment) are ex-tracted from the recombination graph, and mutations are added on trees with probability u per 4N gener-ations. From thekth replicate of this simulation,Skjsites
segregatingjmutant alleles are generated (k¼1,. . .,K; j¼1,. . .,n1). Because mutations occur with variable tree lengths, the total number of segregating sites,Sk¼
P
jSkj, may change for differentk. The sampling
prob-ability forjmutants per site,Pnj, is estimated by
P
kSkj=
ð1000KÞ (for a 1-kb segment) from all K replicates. Since the frequency spectrum (pn1, pn2,. . .,pnn1) is
defined as the distribution of allele frequency condi-tional on polymorphism at the site,pnjis estimated from
simulations byð1=KÞPkSkj=Sk.
ANALYTIC APPROXIMATIONS
We consider single-nucleotide polymorphisms (SNPs) innhomologous DNA sequences sampled from a pop-ulation of random-matingNdiploids. The mutation rate is assumed to be very low (i.e., the infinite-sites model is assumed) such that the mutant allele can be unambig-uously distinguished from the ancestral allele by using a close outgroup sequence. The probability that a given site is polymorphic withk(¼1,. . .,n1) mutant alleles is defined asPnk. We denote byPn0the probability that the site is monomorphic. Under the model of neutral evolution in a constant-sized population,Pnk¼4Nm/k¼ u/k(Ewens2004). Kimand Stephan(2002) obtained
sweep. However, their solution assumes that the sequen-ces are sampled immediately after the fixation of the beneficial mutation. Below, a general solution ofPnkfor
arbitrary time since the fixation event is derived. Single sweeps:First,Pnkafter a single selective sweep
is investigated. I assume that the fixation of a beneficial allele occurredtgenerations ago and consider a neutral locus at a distance from the site of selection measured by the recombination fractionr. The selective advantage of the beneficial mutation is given bys, and genic selection is assumed (h¼0.5). I attempt to obtainPnkas a
func-tion of t. The number of sites segregating a neutral mutant in the frequency interval [x,x1dx] at the time when the beneficial mutation occurs is given byf(x)dx. If the beneficial mutation occurs on a chromosome carrying this neutral variant,xincreases toy1(1y)x on average, whereyis the mean increase of the identity by descent in the population due to hitchhiking (Gillespie2000), approximated by (4Ns)r/s(Kimand
Nielsen 2004). This event happens with probability
xf(x)dx(Fayand Wu2000). If the beneficial mutation
occurs in repulsion phase with the variant,xdecreases to (1y)xon average, with probability (1x)f(x)dx. This radical change of neutral allele frequency may be modeled as though it occurs instantaneously, as the sojourn time of the beneficial mutation [2 log(4Ns)/s generations] is very short relative to 4N, the coalescent timescale of the neutral model. If f(x) ¼ u/x, the expected distribution of mutant allele frequencies under neutral equilibrium, andr>s, this hitchhiking effect will produce a skewed distribution in which high-frequency mutants are as frequent as low-high-frequency mutants but intermediate-frequency mutants are rare (Fayand Wu2000; Kimand Stephan2002). However,
thisU-shaped pattern decays quickly due to mutation and genetic drift: Low-frequency mutants will increase due to new mutational input, while high-frequency mutants will drift either to lower-frequency classes or to fixation. At t generations after the fixation of the beneficial allele,Pnkis approximately
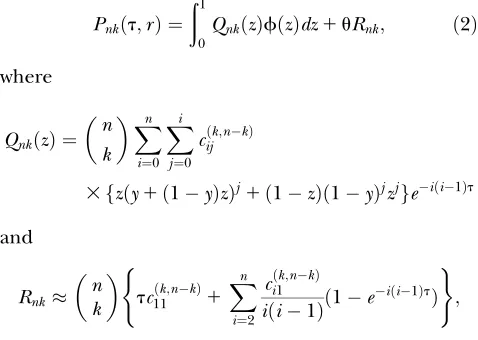
Pnkðt;rÞ ¼
n k
ð1
0
E½Xkð1XÞnkjy1ð1yÞz;tzfðzÞdz
1
ð1
0
E½Xkð1XÞnkj ð
1yÞz;tð1zÞfðzÞdz
12Nm
ðt
0
E Xkð1XÞnkj 1
2N;t9
dt9
ð1Þ
for 0,k,n. E[Xa(1X)bjz,t] is the expectation of Xa(1X)b, whereXis the frequency of a neutral allele that has drifted fortgenerations starting at frequencyz. The first two integral terms of Equation 1 represent the probability of samplingkcopies of a neutral allele that was already segregating before the hitchhiking event occurred. The third term represents the contribution by neutral variants that entered the population after the
sweep.E[Xa(1 X)bj
z,t] can be obtained using the dif-fusion approximation (Kimura1955) (seeappendix).
After rescaling time byt¼t/(4N), the explicit solution of Equation 1 is given by
Pnkðt;rÞ ¼
ð1
0
QnkðzÞfðzÞdz1uRnk; ð2Þ
where
QnkðzÞ ¼
n k
Xn
i¼0 Xi
j¼0 cijðk;nkÞ
3fzðy1ð1yÞzÞj1ð1zÞð1yÞjzjgeiði1Þt
and
Rnk
n k tc
ðk;nkÞ
11 1
Xn
i¼2 ciðk1;nkÞ iði1Þð1e
iði1ÞtÞ
( )
;
ignoring terms on the order of 1/N(a sufficiently large N is assumed). Coefficients cijða;bÞ are defined in the appendix.
Figure 1 shows the predicted sampling probabilities for eight sequences with various combinations of time and map distance. The predictions from Equation 2 agree well with simulation results, although Equation 2 predicts a slightly greater excess of extreme-frequency classes (frequencies 1 andn1 in the sample), partic-ularly fort¼0 (see also Kimand Stephan2002). This is
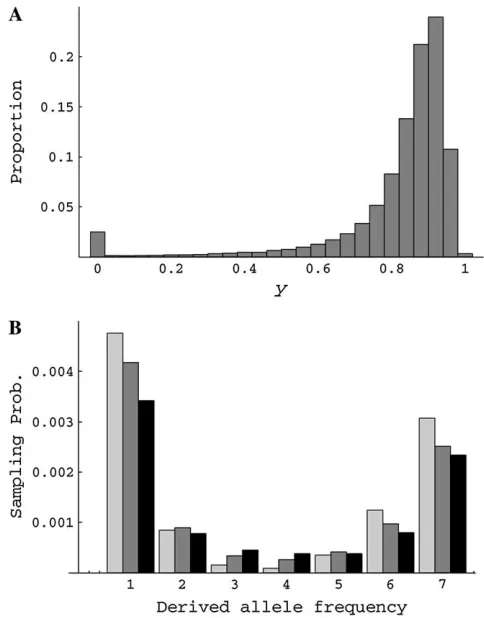
likely due to the assumption that sweeps are instanta-neous, which results in ignoring the effect of genetic drift at neutral loci and the stochastic decay of linkage disequilibrium between the beneficial and neutral al-leles during the period of the sweep. In the approxima-tion above,yrepresents only the deterministic increase in the identity by descent. However, in reality and in the simulationsyis a random variable due to genetic drift. Figure 2A shows the distribution of y observed in the forward simulation of a selective sweep. This empirically determined distribution ofycan be used to predict the hitchhiking effect on the sampling probability att¼0 (Figure 2B, shaded bars). It is shown that including the variance ofyproduces a sampling probability distribu-tion that is less skewed and is closer to the result of coalescent simulation than the prediction by Equation 2. In addition to the fluctuation ofy, the genetic drift of the neutral allele along the lineages that escape the hitchhiking-induced coalescence (the frequency of this genetic background is 1yat the end of sweep) may further reduce the skew of frequency distribution.
To connect the current solution to earlier studies, the frequency spectrum obtained here may be transformed into conventional summary statistics of the frequency spectrum—Tajima’sD(Tajima1989a) and Fay and Wu’s
H(Fayand Wu2000). Both statistics are expected to be
single selective sweep. Tajima’sDcompares the number of segregating sites (S) and the average number of pair-wise differences (ˆup;Tajima1983) in the sample. For a
givenS, the prediction of ˆupunder the current model is
E½ˆup ¼S Xn1
i¼1 pni
2iðniÞ
nðn1Þ;
wherepni¼Pni/(Pn11 1Pnn1). Then, the expected
Tajima’s D might be obtained from Equation 38 of Tajima(1989a), usingE[ˆup] instead of ˆup. Fay and Wu’s
His the difference between ˆupand ˆuH, the expected ho-mozygosity of mutant alleles summed over polymorphic sites (Fayand Wu2000). I normalize Fay and Wu’sH
by usingH¼ ðˆupuˆHÞ=ˆup instead of ˆupuˆH. MeanH might be predicted byðE½uˆp E½uˆHÞ=E½ˆup, where
E½uˆH ¼SX
n1
i¼1 pni
2i2 nðn1Þ:
Equation 2 can be used to examine how long the skewed distribution of allele frequency lasts. It was shown that the expected heterozygosity is recovered to the before-sweep level approximately in 4Ngenerations after the sweep:E½uˆp uð1y2e2tÞ(Kimand Stephan 2000). The expectations of relative heterozygosity (ˆup/ u), Tajima’sD, and Fay and Wu’sHwere calculated for a single sweep witha¼1000 andn¼15 and are plotted in Figure 3 for various map distances and times after the sweep. The decay of Tajima’sDis only slightly faster than the decay of heterozygosity. However, the decay of Fay and Wu’s H is much faster, as demonstrated in
Przeworski(2002).Hbecomes even positive aftert¼
0.1 in a position-dependent way. This reversal (ˆup.uˆH) was first observed in Kim and Stephan (2000) and is
further examined in the next section. The spatial pattern of Fay and Wu’s H through time is rather complicated. It was argued that, to produce negative Tajima’sD, the recombination fraction from the selec-tive target scaled by the selection coefficient (r/s) should not be too small or too large. The optimalr/s
that generates the most negativeHshifts upward witht
(this is also true if unnormalizedH¼uˆpuˆH is used; result not shown).
Recurrent selective sweeps: From the sampling probability for a single, isolated sweep given by Equation 1, we can obtainPnkunder a model of recurrent selective
sweeps. Consider a chromosome M nucleotides long. Recombination occurs with probabilityr between any two adjacent nucleotide sites per generation. It is as-sumed that each nucleotide site mutates into a benefi-cial allele with selection coefficients(no dominance). All sites on the chromosome have equal probability,l, of fixing a beneficial mutation each generation (l4Nus, whereuis the rate of new beneficial mutation per site). It is assumed that the site at which the variation is ob-served (focal site) is locatedMLnucleotides away from the left end andMRnucleotides from the right end (M¼ ML1MR). Under this model, the amount and pattern of variation at the focal site depends on the hitchhiking effect of recurrent substitutions on the chromosome (Wiehe and Stephan 1993; Braverman et al. 1995;
Gillespie 2000). Averaging over time, an equilibrium
distribution of mutant allele frequency will be estab-lished. Assume that, under this equilibrium, a neutral mutant at the focal site is found in the frequency interval [x, x 1 dx] with probability fðxÞdx. Let Pnk be the
corresponding sampling probability. Again, it is assumed that the substitution of a beneficial mutation occurs in-stantaneously. Going backward in time, the waiting time until the last fixation of a beneficial mutation is given by
t, which is exponentially distributed with mean 1/ (4MNl)¼1/L. Since equilibrium is assumed, the allele frequency distributions both at present and at timetare given byfðxÞ. Then,
Pnk
1 M
ðMR
ML
ð‘
0
Pnkðt;rjmjÞLeLtdtdm
¼
ð1
0
QnkðzÞfðzÞdz1uRnk; ð3Þ
Figure1.—Sampling
prob-abilities of neutral mutant alleles after a single selec-tive sweep event (n ¼ 8), for various distances from the selective target and time of the fixation of the bene-ficial allele. Analytic pre-diction is obtained from Equation 2. The simulation result is based on 105
where
QnkðzÞ ¼ 1
M ðMR
ML
ð‘
0
QnkðzÞLeLtdtdm
¼ n
k
Xn
i¼0 Xi
j¼0
cijðk;nkÞhjðzÞ L
iði1Þ1L;
hjðzÞ ¼
1 M
ðMR
ML
½zfz1ð1zÞð4NsÞð jmjr=sÞgj
1ð1zÞfzð1 ð4NsÞð jmjr=sÞÞgjdm;
and
Rnk ¼
1 M
ðMR
ML
ð‘
0
RnkLeLtdtdm¼ n
k
Xn
i¼1
cðki1;nkÞ iði1Þ1L:
AsnincreasesPnkshould approachfðk=nÞð1=nÞ. Then,
with sufficiently largen, we may approximate Equation 3 by
Pnk
Xn1
j¼1 Qnk j
n
Pnj1uRnk:
Therefore, the sampling probabilities under the model of recurrent sweeps are given by
P¼uðIQÞ13
R; ð4Þ
where P ¼ ðPn1;. . .;Pnn1ÞT;
R¼ ðRn1;. . .;Rnn1ÞT , andQis a (n1)3(n1) matrix whose element in ith row and jth column is Qniðj=nÞ. The frequency spectrum (pn1, pn2,. . .,pnn1) is defined as sampling
distribution conditional on polymorphism. Therefore, under recurrent sweeps, it is approximated by
pni¼Pni
Xn1
j¼1 Pnj:
,
ð5Þ
Figure 4A shows that sampling probabilities given by Equation 4 are in good agreement with results from sim-ulation of recurrent sweeps. As in Figure 1, the approxi-mations ofPn1 andPnn1 are slightly larger than those observed in the simulations. However, the frequency spectrum observed in the same set of simulated data shows the opposite result (Figure 4B): the analytic approximation (pni) predicts less skew of frequency
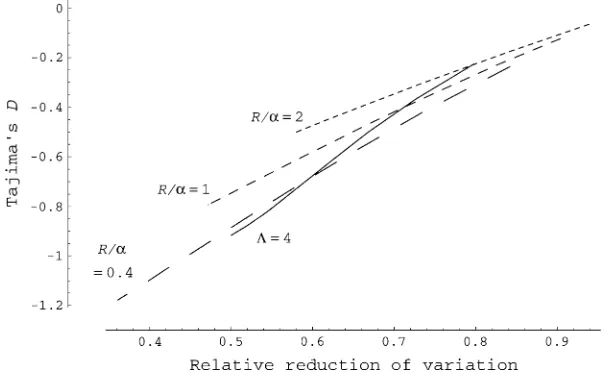
spectrum than that observed in the simulation. This dis-crepancy occurs due to the negative correlation between the number of segregating sites in the sample and the skew of the frequency spectrum. For example, if the last hitchhiking event occurs very recently and near the center, the simulated data will have smallerSand greater skew of the frequency spectrum. As the sampling probability estimated from simulation is not normalized by S, it is expected to be less skewed than the frequency spectrum. Equation 5 is transformed to summary statistics as described in the section of single sweeps. Table 1 shows that the predicted Tajima’s Dis less negative than the average observed in simulations, as expected from com-parisons of the analytic and simulation results shown in Figure 4B. Despite this bias, the predicted Tajima’sDis still useful for tracking the general change of frequency spectrum with changing parameters. First, as observed in Bravermanet al.(1995), Tajima’sDdecreases linearly
with the reduction of variability (measured by E½uˆW, where ˆuWis Watterson’s estimate ofu; Watterson1975)
relative to the neutral equilibrium (Figure 5). This result is in agreement with Figure 3 in which the heterozygosity and Tajima’sDreturn to equilibrium approximately at the same rate after a single sweep. However, the slope of the linear relationship between ˆuW and Tajima’s D changes with scaled map length of the sequence (R¼
4NMr) relative to the strength of selection (a). With smaller R/a, more negative Tajima’sDis obtained for the same reduced level of variation. This was observed also in the simulation (Table 1, cases 2–4).
Fay and Wu’sHwith recurrent selective sweeps is posi-tive (ˆup.ˆuH) for all parameter sets examined, including
Figure 2.—(A) Distribution of yat the end of a selective
sweep. A two-locus forward simulation using the method in Kimand Stephan(2000) was conducted withN¼10,000, s¼0.05, andr/s¼0.025. (B) Sampling probability forn¼8 was determined by transforming an allele frequencyx, randomly chosen from distributionf(x)¼u/x, toy1(1y)xwith prob-abilityxor to (1y)xwith probability 1x. This procedure was repeated 105times and the resulting distribution of allele
frequency was converted to the sampling probability. Columns with light shading are obtained by using a constantythat is the mean of the distribution shown in A [mean ¼ 0.815; (4Ns)r/s¼0.827]. Using variableyin A results in probabilities shown by columns with dark shading. Solid columns represent the results from coalescent simulation (a¼1000, u¼0.01,
those in Table 1. Figure 4B shows that, with a severe skew of the frequency spectrum caused by recurrent hitch-hiking events, more mutant alleles are found at high frequency than at intermediate frequency. However, this skew does not translate into a negative H because, compared to the frequency spectrum under neutrality (curves in Figure 4B), there is no excess of high-frequency mutants. On the other hand, the proportion of low-frequency mutants is much greater than that under the neutral expectation. A recent study using coalescent simulation also found that Fay and Wu’s H becomes positive under recurrent sweeps (Haddrillet al.2005).
One may argue that this results from an excessively large proportion of singletons, particularly mutant alleles with frequency 1, relative to high-frequency derived al-leles after selective sweeps. However, in all cases of recur-rent sweeps in Table 1, Fay and Wu’sHis still positive even if singletons are removed from the data sets.
This is an interesting result as previous studies found that the excess of high-frequency derived alleles (nega-tiveH) is an important signature of selective sweeps (Fay
and Wu 2000; Kim and Stephan 2002; Przeworski
2002). However, these studies modeled recent selective sweeps with no further events in the past. This ‘‘single-sweep’’ model predicts a coalescent tree with long inner branches—i.e., most gene lineages find a very recent common ancestor, but one or two lineages escape the early coalescence via recombination [see Fayand Wu’s
(2000) Figure 2B]. Mutations mapped on this tree will be found at either very low or high frequency in the sample. In the recurrent sweep model, however, the probability of finding such a tree will be small because gene lineages that have escaped the coalescence at the most recent hitchhiking event are still subject to coales-cence at hitchhiking events further back in the past. To confirm this explanation, I performed new simulations Figure3.—Decay of skewed frequency spectrum after a single selective sweep. The expectations of relative heterozygosity (ˆup),
Tajima’sD(givenS¼20), and normalized Fay and Wu’sHare plotted along the distance from the selective target (given byr/s) for increasing values oft.
Figure 4.—Allele
fre-quency distribution of neu-tral mutant alleles under recurrent selective sweeps (n¼15,a¼2000,u¼0.01,
M ¼ 2 3 105, R ¼ 400).
Shaded and solid columns show analytic approxima-tion and coalescent sim-ulation, respectively. (A) Probability of sampling i
in which, after the first hitchhiking event at time tn (distributed exponentially with mean 1/L), no more selective sweeps in the past were allowed. The mean values ofHfrom those simulations are negative (Table 1, cases 7–9).
Finally, I examined the effect of the dominance of beneficial mutations on the frequency spectrum. For similar degrees of reduction in ˆuW, Tajima’s D be-comes slightly more negative with increasing dominance (Table 1, cases 10–12).
PARAMETER ESTIMATIONS OF DIRECTIONAL SELECTION
In this section, I examine whether the analytic approximation obtained above can be used to estimate parameters of directional selection from sequence data. First, Equation 2 may allow the inference of the time
since the hitchhiking event, if only one selective sweep event has occurred in the recent past. In Kim and
Stephan(2002), the composite likelihood of the data
under the selective sweep model was calculated assum-ing that sequences were sampled immediately after the fixation of the beneficial allele (t¼0). Here, Equation 2 is used to perform a likelihood-ratio test as described in Kimand Stephan(2002) but withtbeing an unknown
variable. Przeworski (2003) also estimated t using a
different maximum-likelihood approach, a rejection-sampling method based on three summary statistics:S, Tajima’sD, and the number of distinct haplotypes.
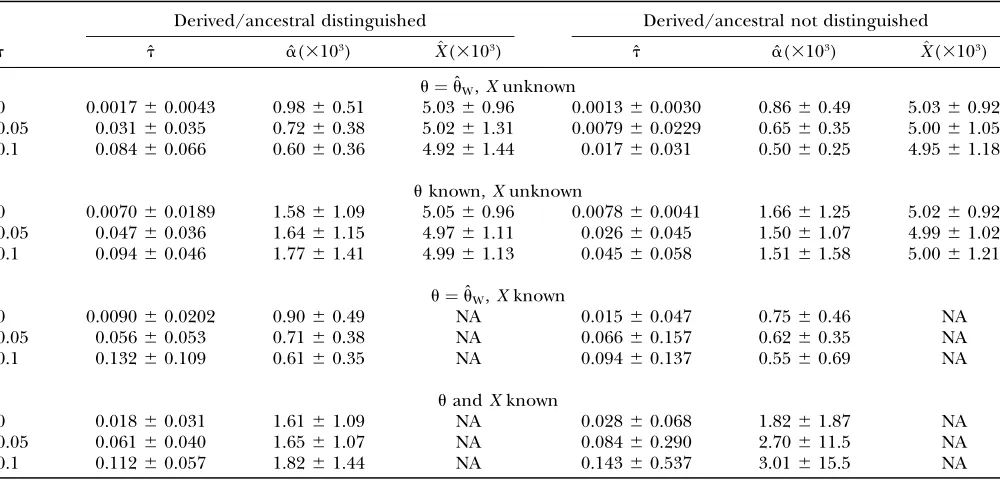
The test was applied to simulated data sets of 15 sequences (10 kb long, 4Nr¼0.05,u¼0.005). Fixation of the beneficial mutation occurs in the middle of the sequence at timet. Three values oftwere used: 0, 0.05, and 0.1. Table 2 shows the mean and standard deviation of the estimate of sweep time (t) as well as those of the
TABLE 1
Simulation of recurrent selective sweeps (a¼1000,u¼0.01,ML¼MR¼105)
Case R/a L ˆuWa uˆpa D H
1 0.4 2 0.697 [0.735] 0.618 [0.652] 0.562 [0.412] 0.068 [0.070] 2 0.4 4 0.581 [0.596] 0.471 [0.484] 0.835 [0.686] 0.084 [0.102] 3 1 8 0.555 [0.565] 0.451 [0.466] 0.796 [0.634] 0.063 [0.072] 4 2 13 0.584 [0.562] 0.493 [0.480] 0.681 [0.521] 0.009 [0.064] 5 0.4 10 0.396 [0.398] 0.272 [0.273] 1.19 [1.10] 0.114 [0.123] 6 0.1 12 0.296 [0.289] 0.173 [0.166] 1.46 [1.43] 0.346 [0.341]
7b 0.4 2 0.773 0.706 0.471 0.095
8b 0.4 4 0.691 0.597 0.678 0.227
9b 0.4 10 0.627 0.522 0.811 0.613
10c 0.4 10 0.441 0.328 1.01 0.089
11 0.4 8 0.439 [0.445] 0.318 [0.319] 1.09 [1.02] 0.106 [0.121]
12d 0.4 8 0.431 0.303 1.15 0.161
Simulation results are based on 5000 replicates. Theoretical expectations are given in brackets. a
Mean value of estimates relative tou. b
Only one selective sweep occurs in the genealogy (see text). c
Dominance of the beneficial mutation (h) is 0.2. d
Dominance of the beneficial mutation (h) is 0.8.
Figure 5.—Correlation between Tajima’s D
and relative reduction of genetic variation under recurrent selective sweeps predicted by analytic approximation. It is assumed that sequence data (n¼25) are taken from a 1-kb segment in the middle of the chromosome and u¼ 0.01. The sampling probability given by Equation 4 was transformed to the expected level of variation (E½uˆW=u), where E½uˆW ¼
Pn1
i¼1Pni, and to ex-pected Tajima’s D, using S ¼ 103E½ˆu
W. Solid curve:aincreases from 150 to 5000 withL¼4,
R¼ 400. Dashed curves:Lincreases from 1 to 12 witha¼1000 andR¼400, 1000, and 2000.
strength (a) and location (X) of the beneficial allele. Different tests were performed depending on whether the parameters u and X are known or unknown and whether derived/ancestral states of alleles are distin-guished. If the true value ofuis assumed to be unknown, Watterson’s estimate ofufrom data itself is used for the composite likelihood. Estimation oftis poor in general: standard deviations of ˆtare greater than means in many cases. Using the true value of u slightly improves the accuracy of ˆt. It is sometimes possible to infer the location of the target of directional selection from ex-ternal information (for example, Enard et al. 2002).
However, having the true value ofXdoes not improve the parameter estimation of ˆtand ˆa. Not distinguishing derivedvs.ancestral states of alleles generally results in poorer estimates, especially with largert. Whent¼0, mean ˆtranged from 0.002 to 0.018. Given that the coa-lescence of gene lineages due to hitchhiking occurs mainly when the frequency of the beneficial allele is low, the behavior of the genealogy during much of the selective phase is similar to that under neutrality. Therefore, the estimate oftwhent¼0 should reflect the length of the selective phase. The length of the selec-tive phase in this case is(1/a)ln(2a)0.007, in agree-ment with the range of ˆtobtained.
Next, I asked if Equations 4 and 5 can be used to estimate genomic parameters of directional selection under a simple model of recurrent selective sweeps. I assume that selective sweeps occur at a rate l per generation per nucleotide, regardless of recombination rates that may vary along the genome. The strength of
directional selection,a, is constant. Since the distribu-tion of allele frequency captured in the analytic approx-imation is only the average over many realizations of selective sweeps for a given parameter set, it will be essential to use data from many independently evolving loci. Assume that the data set consists ofLsuch loci. The recombination rate for each locus is assumed known. LetSijbe the number of nucleotide sites withjmutant
alleles from theith locus (j¼0,. . .,ni1;Si0is defined to be the number of monomorphic sites). A composite likelihood based on the sampling probability given by Equation 4 can then be defined as
CLða;4NlÞ ¼X
L
i¼1 Xni
j¼0
SijlogðPijÞ: ð6Þ
Note that the likelihood is given by a function of 4Nl, notl, because the effect of recurrent sweeps depends on the frequency of hitchhiking events in the coalescent time scale (4N). The composite likelihood based on the frequency spectrum is identical except thatpijis used
instead ofPijand terms withj¼0 disappear. Remember
that the sampling probability can be calculated only when the scaled mutation rate,u, of the locus is known, while the frequency spectrum does not depend onu. The estimates ofaand 4Nl(orlifNis known) may be found by maximization of the above function.
This approach was tested against simulated data sets ofL ¼30,ni¼n¼15, andu ¼0.01. One data set is
produced by simulating 30 loci individually and then combining them. The ith locus was simulated with a
TABLE 2
Parameter estimates of single selective sweep (mean6standard deviation)
Derived/ancestral distinguished Derived/ancestral not distinguished
t ˆt aˆ(3103) X^(3103) ˆt aˆ(3103) X^(3103)
u¼uˆW,Xunknown
0 0.001760.0043 0.9860.51 5.0360.96 0.001360.0030 0.8660.49 5.0360.92 0.05 0.03160.035 0.7260.38 5.0261.31 0.007960.0229 0.6560.35 5.0061.05 0.1 0.08460.066 0.6060.36 4.9261.44 0.01760.031 0.5060.25 4.9561.18
uknown,Xunknown
0 0.007060.0189 1.5861.09 5.0560.96 0.007860.0041 1.6661.25 5.0260.92 0.05 0.04760.036 1.6461.15 4.9761.11 0.02660.045 1.5061.07 4.9961.02 0.1 0.09460.046 1.7761.41 4.9961.13 0.04560.058 1.5161.58 5.0061.21
u¼uˆW,Xknown
0 0.009060.0202 0.9060.49 NA 0.01560.047 0.7560.46 NA 0.05 0.05660.053 0.7160.38 NA 0.06660.157 0.6260.35 NA 0.1 0.13260.109 0.6160.35 NA 0.09460.137 0.5560.69 NA
uandXknown
0 0.01860.031 1.6161.09 NA 0.02860.068 1.8261.87 NA 0.05 0.06160.040 1.6561.07 NA 0.08460.290 2.70611.5 NA 0.1 0.11260.057 1.8261.44 NA 0.14360.537 3.01615.5 NA
recombination rate given by 4Nri¼(i11)3103(i¼
1,. . ., L) and with chromosome length Mi ¼ 0.8a/
(4Nri). (Here each ‘‘chromosome’’ models an
indepen-dently evolving segment on the actual chromosome.Mi
is approximately the size of the region affected by a beneficial mutation of strength a; if the scaled re-combination rate is.0.4a, the heterozygosity decreases at most by 6%.) Polymorphism is observed in a 2-kb-long segment at the center of each chromosome. A total of 1000 replicate data sets were generated witha¼1000 and 4Nl¼43105. The first four replicates were used
to obtain the profile of the composite likelihood using the frequency spectrum in the parameter space ofaand 4Nl (Figure 6). The profile for each replicate has a plateau over the space defined by a product ofa and 4Nl. This suggests that the strength and the rate of selective sweeps may not be estimated separately from frequency spectra of multilocus genomic data. The same conclusion was drawn previously, using the heterozygos-ity of data: the effect of hitchhiking is given by the productal(Wieheand Stephan1993; Stephan1995).
However, it is not simple to estimate the composite pa-rameter al using Equation 3 because this equation is not expressed by this single variable.
It is often possible to obtain a separate estimate of the rate of substitutions driven by directional selection in the genome (e.g., Smithand Eyre-Walker2002). Iflis
given by an external source, the estimate ofamight be obtained. Figure 7 shows the distribution of ˆawhen the composite likelihood of the above data was maximized using the correct value of 4Nl (4 3 105). The
com-posite likelihood based on sampling probability, assum-ing the correctuis known, yields better estimates ofa, as expected. Using only the frequency spectrum lowers the accuracy of ˆa. But it still gives reasonably unbiased es-timates (mean ˆa¼1045). When the same analyses were performed without distinguishing ancestral/derived alleles, the distribution of ˆa changed slightly (from 1020[mean] 6 495[SD] to 1025 6 521 using the sampling probability; from 1045 6 647 to 1083 6 783 using the frequency spectrum). This suggests that genetic information regarding the intensity of directional selec-tion is contained in the excess of rare alleles rather than in the excess of high-frequency derived alleles. The error in the estimation ofashown in Figure 7 is quite large. Adding more independent loci will reduce this error. For example, by increasingLfrom 30 to 60 (each chromo-some is duplicated in the new data set), ˆa improves to 10456315 using the sampling probability and to 9686
392 using the frequency spectrum (distinguishing ances-tral/derived alleles; based on 500 replicates).
DISCUSSION
A skew in the site frequency spectrum,i.e., the excess of rare alleles and high-frequency derived alleles com-pared to the expectation under neutral equilibrium, is well known to be characteristic of the genetic variation resulting from positive directional selection (Braverman
et al.1995; Simonsenet al. 1995; Fayand Wu2000). The
theoretical basis of this effect has been studied for single recent selective sweeps (Kim and Stephan2002; Kim
and Nielsen 2004), in which case one can make a
simplifying assumption that genetic drift after the fixation of a beneficial allele is negligible. Relatively little progress has been made for the theory of frequency spectrum under recurrent selective sweeps. This study appears to represent the first step toward a Figure6.—Contour plots of composite likelihood
(Equa-tion 6) calculated for four random sets of multilocus data (n¼15, L¼30,a¼ 1000, and 4Nl¼43105). Contour
lines were drawn in increments of five downward from the maximum value (included in the open area).
Figure7.—Distribution of the maximum
com-posite-likelihood estimate of a when the true value of 4Nl¼43105is known. The true value
complete mathematical analysis of the frequency spec-trum under recurrent selective sweeps.
There are two sources of the rare alleles in DNA sequences after a selective sweep. First, a selective sweep may generate a star-like genealogy with many short outer branches. Mutations mapping onto those branches will be found at low frequency in the sample. Second, when only one selective sweep has occurred in the recent past, one or two lineages may escape co-alescence during the hitchhiking event and generate long inner branches. Alleles descended along such an ‘‘escaped’’ branch will also be found in low frequency in the sample. Both classes of rare alleles contribute to generate negative values of Tajima’sD. However, there are qualitative differences between the two classes. Only the second class is associated with an excess of high-frequency derived alleles and high linkage disequilib-rium (Fayand Wu2000; Kimand Nielsen2004). The
results of this study suggest that negative Tajima’s D generated under recurrent selective sweeps must be due mainly to the first class of rare alleles, since no excess of high-frequency derived alleles is predicted or observed in the simulations (Table 1). A neutral variant that has increased to a high frequency due to one hitchhiking event is likely to be dragged to fixation during sub-sequent hitchhiking events. An excess of high-frequency variants thus cannot be maintained under recurrent sweeps. Low-frequency variants, in contrast, are con-stantly replenished by new mutations and can occur with recurrent sweeps. This result raises concerns about the interpretation of Fay and Wu’sH-test as an attempt to detect positive selection from sequence polymor-phism data: a failure to observe a negativeHshould not be regarded as a failure to detect recent directional selection, particularly if the locus under test is believed to have experienced multiple adaptive substitutions (e.g., with excess nonsynonymous relative to synony-mous substitutions). It is, however, possible to observe an excess of high- compared tointermediate-frequency derived alleles under high rates of recurrent sweeps (Figure 4). We may need to develop another summary statistic that can conveniently capture this feature of recurrent selective sweeps.
The analytic approximations obtained here can be used to estimate genomic parameters of directional selection from multilocus data. However, it should be stressed that these approximations are based on a simple model of recurrent selective sweeps. In this model, selective sweeps are assumed to occur in a random-mating population of constant size and with no deleterious mutation. In reality, the frequency spectrum may be affected by both spatial and temporal changes of population structure. One possible way of removing these confounding factors and isolating the effect of selective sweeps alone is to examine whether the frequency spectrum is more skewed in genomic regions of lower recombination. Recurrent selective
sweeps are expected to produce this kind of strong cor-relation. For example, Andolfatto and Przeworski
(2001) observed more negative Tajima’sDin regions of lower crossing over in theD. melanogastergenome and argued that this correlation supports the model of recur-rent selective sweeps. We may thus estimate the intensity of selection in the Drosophila genome by finding values that produce a similar profile of Tajima’s D over re-combination rate. However, background selection, which was argued to be prevalent in D. melanogaster (Hudson
and Kaplan 1995; Charlesworth 1996), makes it
dif-ficult to apply the current model to their data.
There are two potentially opposing effects of back-ground selection on the frequency spectrum under the recurrent sweep model. First, because deleterious alleles segregate at low frequency, background selection may further skew the frequency spectrum in the di-rection of negative Tajima’s D (Charlesworth et al.
1995; Bachtrog 2004), particularly in regions of low
recombination. In this case, the intensity of directional selection is likely to be overestimated by fitting the current model to the correlation between recombina-tion and Tajima’s D. However, it is known that back-ground selection can produce substantially negative Tajima’sDonly when deleterious mutations are weakly selected and the mutation rate is high (Golding1997;
Przeworskiet al. 1997; Bachtrog2004). For example,
purifying selection in Drosophila appears to be too strong to generate significantly negative Tajima’s D
(Andolfatto and Przeworski 2001). The second
effect of background selection is to reduce the short-term effective population size, also strongly in regions of low recombination. In this case, the effect of selective sweeps on a genealogy diminishes because, for givenl, the rate of selective sweeps on the coalescent timescale, 4Nl, becomes smaller. Thus, Tajima’sDmay becomeless negative when background selection is added. The per generation substitution rate l itself will also decrease because the efficacy of directional selection on benefi-cial mutations decreases by interference from purifying selection at linked loci (Peck1994; Barton1995; Kim
and Stephan 2000). Therefore, the intensity of
di-rectional selection required to explain the observed pattern of the frequency spectrum may increase when background selection is added. In Drosophila, this second effect of background selection is likely to be more important than the first since the reduction of effective population size by background selection is predicted to be substantial (Hudsonand Kaplan1995;
Charlesworth1996).
example, Haddrillet al.(2005) showed that a simple
model of population bottleneck is the most parsimoni-ous explanation for the pattern of the frequency spec-trum along the genome ofD. melanogaster. Although it might still be possible to confirm selective sweeps by observing a positive correlation between recombination rate and Tajima’sD, if selective sweeps occur along with demographic changes, the estimate of al using the above approximation may have substantial error. An-other simplifying assumption of the current model is that a selective sweep starts with one copy of a new beneficial mutation. One recent study suggests, how-ever, that adaptive substitutions starting from standing genetic variation might be as common as those from a new beneficial mutation (Hermisson and Pennings
2005). Selective sweeps starting with multiple copies of a beneficial mutation may produce frequency spectra that are quite different from those expected under the standard model of hitchhiking (Innanand Kim2004;
Hermissonand Pennings2005).
I thank Wolfgang Stephan, Allen Orr, Andrea Betancourt, Daven Presgraves, Naoyuki Takahata, and two anonymous reviewers for help-ful comments on the manuscript. This work was funded by National Science Foundation grant DEB-0449581.
LITERATURE CITED
Andolfatto, P., 2001 Adaptive hitchhiking effects on genome
var-iability. Curr. Opin. Genet. Dev.11:635–641.
Andolfatto, P., and M. Przeworski, 2001 Regions of lower
cross-ing over harbor more rare variants in African populations of
Drosophila melanogaster.Genetics158:657–665.
Bachtrog, D., 2004 Evidence that positive selection drives
Y-chromo-some degeneration in Drosophila miranda. Nat. Genet.36:518– 522.
Barton, N. H., 1995 Linkage and the limits to natural selection.
Genetics140:821–884.
Barton, N. H., 2000 Genetic hitchhiking. Philos. Trans. R. Soc. Lond.
B355:1533–1562.
Begun, D. J., and C. F. Aquadro, 1992 Levels of naturally occurring
DNA polymorphism correlate with recombination rates inD. melanogaster.Nature356:519–520.
Braverman, J. M., R. R. Hudson, N. L. Kaplan, C. H. Langley
and W. Stephan, 1995 The hitchhiking effect on the site
fre-quency spectrum of DNA polymorphisms. Genetics 140:783– 796.
Charlesworth, B., 1996 Background selection and patterns of
genetic diversity inDrosophila melanogaster.Genet. Res.68:131– 149.
Charlesworth, B., M. T. Morgan and D. Charlesworth,
1993 The effect of deleterious mutations on neutral molecular variation. Genetics134:1289–1303.
Charlesworth, D., B. Charlesworthand M. T. Morgan, 1995 The
pattern of neutral molecular variation under the background selec-tion model. Genetics141:1619–1632.
Clark, R. M., E. Linton, J. Messingand J. F. Doebley, 2004
Pat-tern of diversity in the genomic region near the maize domestication gene tb1. Proc. Natl. Acad. Sci. USA101:700– 707.
Enard, W., M. Przeworski, S. E. Fisher, C. S. L. Lai, V. Wiebeet al.,
2002 Molecular evolution of FOXP2, a gene involved in speech and language. Nature418:869–872.
Ewens, W. J., 2004 Mathematical Population Genetics. I. Theoretical
Introduction.Springer-Verlag, New York.
Fay, J. C., and C.-I Wu, 2000 Hitchhiking under positive Darwinian
selection. Genetics155:1405–1413.
Fu, Y.-X., 1997 Statistical tests of neutrality of mutations against
pop-ulation growth, hitchhiking and background selection. Genetics
147:915–925.
Gillespie, J. H., 2000 Genetic drift in an infinite population: the
pseudohitchhiking model. Genetics155:909–919.
Golding, G. B., 1997 The effect of purifying selection on
genealo-gies, pp. 271–285 in Progress in Population Genetics and Human Evolution (IMA Volumes in Mathematics and Its Applications, Vol. 87), edited by P. Donnellyand S. Tavare. Springer-Verlag,
New York.
Haddrill, P. R., K. R. Thornton, B. Charlesworth and
P. Andolfatto, 2005 Multilocus patterns of nucleotide
vari-ability and the demographic and selection history of Drosophila melanogaster populations. Genome Res.15:790–799.
Hermisson, J., and P. S. Pennings, 2005 Soft sweeps: molecular
pop-ulation genetics of adaptation from standing genetic variation. Genetics169:2335–2352.
Hudson, R. R., and N. L. Kaplan, 1995 Deleterious background
se-lection with recombination. Genetics141:1605–1617.
Innan, H., and Y. Kim, 2004 Pattern of polymorphism after strong
artificial selection in a domestication event. Proc. Natl. Acad. Sci. USA101:10667–10672.
Kaplan, N. L., R. R. Hudsonand C. H. Langley, 1989 The
‘‘hitch-hiking effect’’ revisited. Genetics123:887–899.
Kim, Y., and R. Nielsen, 2004 Linkage disequilibrium as a signature
of selective sweeps. Genetics167:1513–1524.
Kim, Y., and W. Stephan, 2000 Joint effects of genetic hitchhiking
and background selection on neutral variation. Genetics 155:
1415–1427.
Kim, Y., and W. Stephan, 2002 Detecting a local signature of genetic
hitchhiking along a recombining chromosome. Genetics 160:
765–777.
Kimura, M., 1955 Solution of a process of random genetic drift
with a continuous model. Proc. Natl. Acad. Sci. USA41:144– 150.
MaynardSmith, J., and J. Haigh, 1974 The hitch-hiking effect of a
favourable gene. Genet. Res.23:23–35.
Peck, J. R., 1994 A ruby in the rubbish: beneficial mutations,
dele-terious mutations and the evolution of sex. Genetics137:597– 606.
Przeworski, M., 2002 The signature of positive selection at
ran-domly chosen loci. Genetics160:1179–1189.
Przeworski, M., 2003 Estimating the time since the fixation of a
beneficial allele. Genetics164:1667–1676.
Przeworski, M., B. Charlesworthand J. D. Wall, 1997
Geneal-ogies and weak purifying selection. Mol. Biol. Evol.16:246–252. Schlenke, T. A., and D. J. Begun, 2004 Strong selective sweep
asso-ciated with a transposon insertion in Drosophila simulans. Proc. Natl. Acad. Sci. USA101:1626–1631.
Simonsen, K. L., G. A. Churchill and C. F. Aquadro,
1995 Properties of statistical tests of neutrality for DNA poly-morphism data. Genetics141:413–429.
Smith, N. G. C., and A. Eyre-Walker, 2002 Adaptive protein
evolu-tion inDrosophila.Nature415:1022–1024.
Stephan, W., 1995 An improved method for estimating the rate of
fixation of favorable mutations based on DNA polymorphism data. Mol. Biol. Evol.12:959–962.
Stephan, W., T. H. E. Wieheand M. W. Lenz, 1992 The effect of
strongly selected substitutions on neutral polymorphism: analytical results based on diffusion theory. Theor. Popul. Biol.41:237–254. Tajima, F., 1983 Evolutionary relationship of DNA sequences in
fi-nite populations. Genetics105:437–460.
Tajima, F., 1989a Statistical method for testing the neutral mutation
hypothesis by DNA polymorphism. Genetics123:585–595. Tajima, F., 1989b The effect of change in population size on DNA
polymorphism. Genetics123:597–601.
Thomson, G., 1977 The effect of a selected locus on linked neutral
loci. Genetics85:752–788.
Watterson, G. A., 1975 On the number of segregating sites. Theor.
Popul. Biol.7:256–276.
Wiehe, T. H. E., and W. Stephan, 1993 Analysis of a genetic
hitch-hiking model, and its application to DNA polymorphism data fromDrosophila melanogaster.Mol. Biol. Evol.10:842–854.
APPENDIX: CALCULATION OFE[Xa(1 X)bjz, t]
Consider a neutral allele with initial frequency z reaching frequency X after t generations of random genetic drift. An approximate solution for the nth moment ofX,E[Xn
]¼E[Xnj
z,t], can be obtained from the following diffusion approximation first described by
Kimura(1955):
dE½Xn
dt ¼
nðn1Þ
4N fE½X
n1 E½Xng ðn¼1;2;. . .Þ:
ðA1Þ
His solution is expressed as a sum of infinite series. Unfortunately, this series converges very slowly for small t(,N), the range this study mainly considers. However, from an examination of the exact solutions to the above equation for smalln[e.g.,E½X ¼z,E½X2 ¼z1zðz1Þ expðt=2NÞ, and E½X3 ¼z3
2zð1zÞexpðt=2NÞ1
ðz33
2z2112zÞexpð3t=2NÞ], it can be easily shown that the solution for arbitraryntakes a form
E½Xnjz;t ¼X
n
i¼1
fiðnÞðzÞeðiði1Þ
=4NÞt ð
n$1Þ
where fiðnÞðzÞ is a polynomial function of z. Inserting
E[Xn
] andE[Xn1] of the above form into Equation A1,
we obtain
fiðnÞðzÞ ¼f ðn1Þ
i ðzÞ
nðn1Þ
nðn1Þ iði1Þ ð1#i,nÞ: ðA2Þ
SinceE½Xn ¼znfort¼0,
fnðnÞðzÞ ¼znX
n1
i¼1
fiðnÞðzÞ: ðA3Þ
E[Xnj
z,t] is thus given by obtainingfiðnÞðzÞby recursion
using Equations A2 and A3 and f1ð1ÞðzÞ ¼z. Most importantly, this exact solution has finite terms.fiðnÞðzÞ
can be written asPij¼0cijðnÞzj. Coefficientsc
ðnÞ
ij are readily
obtained from the above recursion. E[Xa(1
X)bj
z,t] is now obtained from
E½Xað1XÞbjz;t ¼X b
j¼0 b
j !
ð1ÞjE½Xa1jjz;t
¼X
b
j¼0 b
j !
ð1ÞjX
a1j
l¼0
flða1jÞðzÞe
ðlðl1Þ=4NÞt
¼X
a1b
i¼0
fiða;bÞðzÞeðiði1Þ =4NÞt;
where
fiða;bÞðzÞ ¼
Xb
j¼maxð0;iaÞ b j ð1Þ
jfða1jÞ
i ðzÞ:
fiða;bÞðzÞ can be written as
Pi k¼0c
ða;bÞ
ik zk. Therefore,
cikða;bÞ¼
Pb
j¼maxð0;iaÞð
b jÞð1Þ
j
cikða1jÞ. The table ofc
ða;bÞ
ik is