INTRODUCTION
Assessment of physical fitness has gone through a long development as well as the changed assessment approach connected with its conception and defini-tion. With respect to close relationship between fi tness and health (Heyward, 2010; Janssen & LeBlanc, 2010; Sucho mel, 2004; Vanhees et al., 2005), it seems to be appropriate to divide the term “fi tness” into two catego-ries – health-related and performance-related. As Van-hees et al. (2005) claims, health-related fi tness is then viewed as a state characterized by an ability to perform daily activities with vigour, and traits and capacities that are associated with low risk of premature development of the hypokinetic diseases (i.e., those associated with physical inactivity). Today’s conception of fi tness assess-ment has deviated from predominantly performance-related fi tness towards the health-performance-related one, which also resulted in reduction of test items within the es-tablished test batteries (Suchomel, 2003). According to Plowman et al. (2006), FITNESSGRAM, whose the last ninth ver sion refl ects its long lasting development,
belongs amongst the most elaborated fi tness test batter-ies. In a sense of increasing quality of particular tests and the whole test battery (its validity and reliability), many tests have been removed or modifi ed in the course of development (Welk & Meredith, 2008). Since 2009 a research group from the Centre for Kinanthropology Research (Faculty of Physical Culture, Palacký Univer-sity in Olomouc) has been working on a conception named “Self-assessment of physical fi tness” and forms an appropriate web-based system of motor tests (soft-ware INDA RES.com). Although some of the attributes of this conception can be presently found in the last version of the FITNESSGRAM system (strong involve-ment of an individual into the test realization; on-line data recording in special software accessible on inter-net), this diagnostic approach to assessment of physical fi tness is completely new (Welk & Meredith, 2008). The basic assumption for the self-assessment conception is a positive eff ect (Marcus & Forsyth, 2009) of a strategy called “self-orientation of an individual” (interioriza-tion) within physical activity behavioural changes. The physical fitness self-assessment is somewhat limited
A NEW VIEW ON THE QUALITY OF JACÍK’S TEST
Roman Cuberek, Aleš Jakubec, Karel Hůlka, Michal Botek
Faculty of Physical Culture, Palacký University, Olomouc, Czech Republic
Submitted in July, 2011
BACKGROUND: A self-assessment of physical fi tness requires a search for motor tests which do not make high material, spatial and skill demands necessary for tests’ realization. In this manner, Jacík’s test (JT) appears to be an appropriate one. Nevertheless, existing information about the test quality is not complete. Based on the motion content of this test, the test performance can be considered to be determined by the level of aerobic fi tness.
OBJECTIVE: The aim of this study is to assess the reliability of JT and to determine degree of infl uence of aerobic fi tness on JT performance.
METHODS: Eighty four PE university students completed the study – 43 female (participated in the validity study; 22.2 ± 2.0 year; BMI = 23.2 ± 2.5 kg/m2; JT performance = 79.1 ± 9.2 points; VO
2max = 44.6 ± 4.7 ml/kg/min.) and 41 males (participated in the reliability study; 21.5 ± 1.2 year; BMI = 25.2 ± 1.6 kg/m2; JT performance = 83.9 ± 8.2 points in the fi rst trial and 87.5 ± 9.1 points in the second trial respectively). The degree of infl uence of aerobic fi tness on the performance in JT is expressed as association between the performance in JT and VO2max estimation (measured by Maximal exercise test realized on a treadmill). The objectivity and the relative reliability of JT are expressed by ICC. Characteristics SEM and Bland-Altman’s 95% limits of agreement were computed to assess absolute reliability of JT.
RESULTS: A little of shared variability of JT and VO2max respectively was found out (only 13.3%). ICCinter-raters = 0.997 indicates a high degree of objectivity (inter-rater reliability). The result of ICCinter-trials = 0.790 points to a “ques-tionable” relative reliability. The systematic error of measurement equals to 3.54 points. Both SEM (3.96 points) and Bland-Altman’s 95% limits of agreement (–9.2, 16.3) point out to the unsatisfactory degree of absolute reliability.
CONCLUSION: Mainly due to the low degree of the testʼs reliability (both relative and absolute), JT is not an accurate tool for assessing physical fi tness in PE university students. The interpretation of testing results could be misleading.
when compared with “classic” health-related fi tness as-sessment. These limits are mainly presented by material, spatial and knowledge-based demands corresponding with specifi c test realization. Therefore, many current tests are insuffi cient for this purpose (some appropriate alternative of the test is necessary) or the tests need to be somewhat modifi ed.
Aerobic fi tness, as a part of fi ve item model of health--related fi tness (body composition, cardiovascular ca-pacity, f lexibility, muscular endurance, and muscle strength), is amongst the most important parts because of its high association with the risk of cardiovascular diseases. According to WHO (2010), physical in activity, that directly results in the level of aerobic fi tness, is an independent risk factor of chronic diseases, and annu-ally causes death of about 1,9 million people in the whole world.
The maximum oxygen consumption (VO2max) is com monly used as a suitable indicator to assess aero-bic fi tness (Caspersen, Powell, & Christenson, 1985; Hey ward, 2010; Mahar, Welk, Rowe, Crotts, & McIver, 2006; The Presidentʼs Council on Physical Fitness and Sports, 2010; Vanhees et al., 2005). Due the fact, that the most precise estimate of this parameter requires labo ratory conditions, this indicator of aerobic fi tness is hardly acceptable for fi eld use. To obtain at least rough estimate of this parameter many fi eld performance tests (Continuous to exhaustion tests, Intermittent tests, and Walking/running tests) or simple intensity tests (any of the group from step tests) are used by many test systems. Nevertheless, the accuracy of these estimates vary a lot – it depends on the type of the test and/or other factors such as “age”, “gender” etc. (e.g. in meta-analytical study Baumgartner and Jackson (1982) presented the level of criterion validity of long distance running tests – crite-rion VO2max – that ranges from 0.22 to 0.91).
In 1983 V. Jacík published his results regarding to a new formed fi eld performance test named “Overall mo-tor test” (orig. “Celostní momo-torický test”) (Jacík, 1983) (at present called “Jacík’s test” and here abbreviat ed “JT”) including characteristics of test’s quality such as validity and reliability and norms for both boys and girls aged from 7 to 20 years. The test forming relates to two principles – human ontogenetic development and global understanding of human kinetics. The changes of ele-mentary positions (reaching the vertical body position mainly) that are included in the test, the author con-sidered to be one of the culminations of childʼs kinetic ontogeny necessary for his/her following development. At once, they are usually included into the group of activities forming the base of humans’ movement base. In author’s mind the test execution doesn’t need any special skills. As a matter of this fact, an infl uence of cul-tural-social, racial, and geographical diff erence is, within the age group or gender, reduced. As the author claims,
however the test result is conditioned by a complex of several skills (hybrid base), global endurance do minates. While forming the test, the author proved concurrent validity concerning to the two criteria. The fi rst crite-rion was “The badge of fi tness” named BBPOV (“Buď připraven k práci a obraně vlasti”) where the level of validity were expressed by the correlation coeffi cient – r = 0.483 to 0.537 and the second criterion was “Test of basic physical fi tness for university students” where r = 0.642 (females) and r = 0.780 (males). The author considers the test to be “satisfactory valid” indicator of the overall physical fi tness.
In spite of the fact that JT is frequently used in a prac tice (e.g. as a particular item of an entrance exam to secondary schools or universities) no study clarifying participation of particular motor abilities that infl uence the overall performance in JT has been produced yet. In consideration of criterion choice (The badge of fi tness BPPOV), we do not agree with Jacík’s choice to deter-mine test validity as indicator of the construct “overall physical fi tness”, and we consider this determination to be inappropriate. Due to a wide content of “The badge of fi tness BPPOV” it is highly diffi cult to explain the re-sults of JT with such a poor validity. Another weak point of the test standardization by Jacík is the presented re-sults and their reliability. The rere-sults cannot be taken as suffi cient for methods of their calculation that are not sensitive to numbers of measurement errors.
When looking for appropriate field test of self-assess ment of aerobic fi tness, a lot of obstacles appear. Though some weaknesses of JT, from the material and spatial demands, such a test seems to be an adequate test useful for self-assessment of physical fi tness (in general). Moreover, because of dominance of global endurance in performance of JT, as mentioned above, one can expect high association between the test performance and the level of aerobic fi tness of individual. Considering all the se circumstances, there is a high chance that the test is suitable for aerobic fi tness self-assessment. By this means, a research problem can be specifi ed as verifying JT as suitable test for aerobic fi tness assessment.
The aim of this study is to assess the Jacík’s test reli-ability and to specify participation of aerobic fi tness on the test performance (to assess criterion validity of the test as an indicator of aerobic fi tness).
METHODS
Participants
In this sense, it was necessary divide the study into the two parts – “sex-divided” sample (validity study – 44 fe males; reliability study – 45 males). In the course of the study fi ve students did not complete all measure-ments (personal reasons, illness). Complete data were obtained from 43 females (22.2 ± 2.0 year, BMI = 23.2 ± 2.5 kg/m2) and 41 males (21.5 ± 1.2 year, BMI = 25.2 ± 1.6 kg/m2).
The Institutional research ethics committee of Facul-ty of Physical Culture of Palacký UniversiFacul-ty agreed to the proposed research and approved the study with no. 7/2011. The students were informed about the in-tention of the study and all procedures. A demand to obtain the relatively maximal possible performance was emphasized. All participants took part in this study volun tarily, after being properly informed. They were asked to participate during their PE classes and their decision to participate did not have any negative eff ects on their studies.
Measures and procedures
All measurements were realized at the Faculty of Phy sical Culture at Palacký University in Olomouc (Czech Republic) from October 2010 to February 2011. The basic somatic characteristics such as weight and height were measured in order to determine BMI. All students took part in JT and in a partial study to assess the validity, each of them had to undergo physiological load test to defi ne VO2max on a treadmill.
Maximal exercise test. The investigations were car-ried out under relatively standard conditions (tempera-ture 19–21 °C, humidity 40–50%) in the laboratory of the Faculty of Physical Culture. The participants were asked to come with an empty stomach and to abstain from drinking coff ee, alcohol and hard physical activi-ties for 24 hours before entering the laboratory.
Graded exercise test till maximum was realized on a LODE Valiant treadmill (Netherland). Heart rate and spiroergometric variables were monitored during the test. After fi ve minutes of warming-up at walking speed 7 km/hour (at last minute treadmill slope was in creased up to 5%) treadmill speed was for one minute increased to 9 km/hour. Subsequently, each 30 seconds speed increased about 1 km/hour up to 12 km/hour. Af-ter achievement of this speed, each 30 seconds tread mill slope was increased about 2% up to subject’s voli tional maxi mum. Oxygen consumption among the others spi-ro ergometric parameters was monitored with use of breath-by-breath gas analyzer (ZAN Ergo USB 600, Ger many). Simultaneously, a Polar (Finland) heart rate monitor was applied. We considered only one essential parameter from all the monitored parameters – maxi-mum oxygen consumption – VO2max [ml/kg/min.].
Jacík’s test (JT). To assess the validity of JT, fema les performed the test once (after one week from perfor-ming Maximal exercise test); to assess reliability, men performed the test twice (one week pause from the fi rst test actualization). The fi rst test performance was monitored by one observer, whereas the second (males) measurement was monitored by two observers (to as-sess objectivity). The test was always performed under the same conditions (on a pad) based on exactly set assign ment (Jacík, 1983) – to change repetitively three positions during two minutes (back-lying position is a start ing one; followed by heel-stand, abdomen-lying position, heel-stand, back-lying position etc.); each po-sition is fi nished by clapping palms to thighs and the result of this test is a number of performed positions numbered as points. The individual is informed about the last ten remaining seconds.
Statistical analysis
Software SPSS 17 (SPSS Inc., Chicago, IL) and Sta-tistica 8 (StatSoft Inc., Tulsa, OK) were used to process the data. Basic descriptive characteristics such as mean, standard deviation and 95% confi dence intervals were calculated for all the indicators. After verifying nor-mality assumption, while assessing a) criterion validity of JT, b) describing the relationship between JT and BMI, c) and verifying homoscedasticity of JT (relation-ship between variables – 1. absolute value of diff erence of repeated individual performance and 2. average value of repeated individual performance), a coeffi cient of Pear son product moment correlation completed with the value of coefficient of determination (as effect size) was used. The objectivity of JT (two observers; probed at the second attempt), as one of the sources of measure ment errors and the level of relative reliability, expressed through intra-class correlation (ICC, parallel one-way model), was calculated according to formula ICC = (MSS – MSE)/MSS, where MSS = “mean square of subjects”, MSE = “mean square of error”. Standard error of measurement (SEM), and Bland and Altmanʼs 95% limits of agreement were computed to estimate ab-solute reliability of JT. Then, these limits were graphi-cally depicted by Bland and Altman’s plot (according to Atkinson & Nevill, 1998). SEM was calculated by a formula according to the methods of Thomas, Nelson, and Silverman (2005) – SEM = SD• √(1 – ICC), where SEM = “standard error of measurement”, SD = the sam-ple standard deviation and ICC = the calculated intra-class correlation coeffi cient (unbiased error). Microsoft Excel was used to construct Bland and Altman’s plot.
for repeated measures calculated according to Cohen (1988)) were used to assess systematic bias in JT.
RESULTS
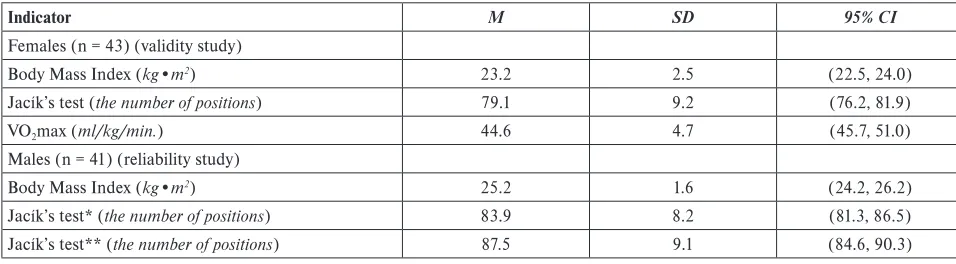
Results in TABLE 1 involve basic indicators of somat-ic and performance characteristsomat-ics in the research sam-ple. They are divided into the two groups in accordance with two parts of research – the validity study (females) and the reliability study (males). The somatic indicator is represented with BMI; the motor indicator is represented with aerobic fi tness (VO2max) and performance in JT. The observed BMI in females, WHO (2010) interprets as a normal weight, resp. immediately above the lower limit of overweight category in males. Considering this interpretation should be advised well-known limitation of usage of BMI in individuals having the above average developed musculature. Given the na ture of the sample, this limitation must be respected when interpreting ob-served BMI. According to Jacík’s (Jacík, 1983) fi ve-scale
population norm (in age category 19–20 year), it is pos-sible to assess the performance reached by females as “above average” and by males as performance as “aver-age”. According to the Czech fema le’s norm of oxygen uptake at maximal load (Seliger & Bartůněk, 1978) (al-though it is outdated there are not recent norms in the Czech Republic) sample of the ob served females can be interpreted as strongly above average.
The part A in the TABLE 2 describes the relation-ship between performance in JT and the level of aero-bic fi tness criterion (VO2max) completed with the rela-tionship of the variables towards the somatic indicator BMI. The coeffi cient of determination (r2) indicates that proportion of shared variability in JT and VO2max
is very low – 13.3% only. With reference to calculated correlation, neither BMI is a factor signifi cantly deter-mining their performance in JT. The value of Pearson’s correlation coeffi cient (the coeffi cient of determination respectively; TABLE 2, section B) between the absolute values of diff erence and the average value of repeated in-dividual performances in JT (a week interval) indicates
TABLE 1
Sample characteristics
Indicator M SD 95% CI
Females (n = 43) (validity study)
Body Mass Index (kg•m2) 23.2 2.5 (22.5, 24.0)
Jacík’s test (the number of positions) 79.1 9.2 (76.2, 81.9)
VO2max (ml/kg/min.) 44.6 4.7 (45.7, 51.0)
Males (n = 41) (reliability study)
Body Mass Index (kg•m2) 25.2 1.6 (24.2, 26.2)
Jacík’s test* (the number of positions) 83.9 8.2 (81.3, 86.5)
Jacík’s test** (the number of positions) 87.5 9.1 (84.6, 90.3)
Legend: M – mean, SD – standard deviation, 95% CI – 95% confi dence interval, * – the fi rst trial, ** – the second trial
TABLE 2
Validity and reliability characteristics of Jacík’s test – Pearson correlation coeffi cient (r) and intraclass correlation (ICC)
Pairs of variable r r2 ICC (95% CI)
A) Validity study (females, n = 43)
Jacík’s test vs. VO2max 0.365 0.133 –
Jacík’s test vs. BMI –0.093 0.009 –
VO2max vs. BMI 0.280 0.078 –
B) Reliability study (males, n = 41)
Jacík’s test (Diff retest vs. Meanretest) 0.143 0.021 –
Jacík’s test (Observer 1 vs. Observer 2) – – 0.997 (0.995, 0.999)
Jacík’s test (Week 1 vs. Week 2) – – 0.790 (0.607, 0.888)
Legend: Diff retest – absolute value of diff erence between repeated measurement of individual performances in Jacík’s test in one week
interval, Meanretest – mean of repeated measurement of individual performances in Jacík’s test in one week interval, 95% CI – 95% interval
the data homoscedasticity (the error of measurement does not grow with increasing score in JT). Therefore, it is not necessary to log-transformation of the obtain-ed data. Calculatobtain-ed high value of intra-class correla-tion ICC (TABLE 2, seccorrela-tion B, the relacorrela-tion “Jacík’s test Observer 1” vs. “Jacík’s test Observer 2”) refers to a high level of objectivity, i.e. measurement is independ-ent from the observer. The detected value of intra-class correlation for repeated measurements (TABLE 2, sec-tion B, the relasec-tion “Jacík’s test Week 1” vs. “Jacík’s test Week 2”), as an indicator of relative reliability, can be according to Atkinson et al. (1998) interpreted as a “questionable reliability”.
The paired t-test proved statistical signifi cance of the
diff erence in reached points in JT between the fi rst and
second measurement (increase of 3.54 points, t = 3.484,
p = 0.001), therefore, a null hypothesis was rejected.
The variability of intra-individual performance diff er-ences highly varied (from –10 to 31 points) – standard deviation of the increasing performance is 6.5 points.
The value of Cohen’s d is equal to 0.41 and relates to
a medium eff ect of a factor which causes the intra-indivi-dual performance diff erences in the test (Cohen, 1988). Here, the measured diff erence (3.54 points) represents a bias of measurement.
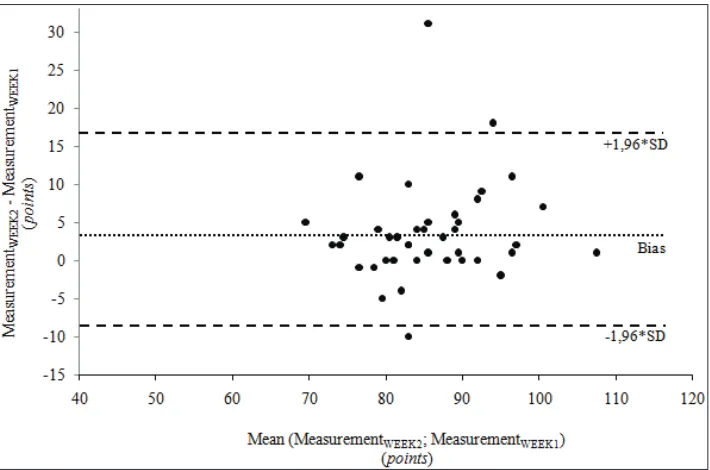
The absolute reliability is expressed by the standard error of measurement (SEM). In male participants the SEM value equals 3.96 points. The second indicator of the absolute reliability, Bland’s and Altman’s 95% limits
of agreement of repeated measurements, is graphically depicted in Fig. 1. The bias is presented with dotted line in the graph (the value equals to 3.54 points) together with 95% limits of agreement depicted with dashed lines (also 95% prediction interval) (see +/–1.96 SD in the graph), whose lower bound equals to –9.2 points and upper equals to 16.3 points.
DISCUSSION
The research sample included individuals with rela-tively consistent performance proved in JT (TABLE 1)
(variation coeffi cient for females equals to 11.6%; 9.8%
for males in the fi rst measurement and 10.4% in the second, respectively), whose performance can be clas-sifi ed, based on the general population norm, as above average in females, respectively average in males. These performance levels are expected in PE students because of their above average amount as well as intensity of realized daily physical activity (their study programme include a large number of physical activities during the week). Because of this homogeneity, the calculated
cor-relation coeffi cients can be higher than those reached
by the general population. It can be deducted that the indicators of reliability or validity expressed by these
co-effi cients are even lower among the general population.
The degree of correlation between performances
in JT and selected criterion of VO2max indicates that
Fig. 1
the validity of JT as an indicator for aerobic fi tness is not satisfactory. Considering VO2max as an indicator of aero bic fi tness, it must be claimed that this motor performance presumption infl uences only 13.3% of over-all result in JT in female PE students. For example, in step-tests (depending on type of a test and population sample) it was found out this infl uence from 16% (Cana-dian Home Fitness Test) up to 56% (Queen College Step Test).
Actually, the probably best known running tests of aerobic fi tness present still higher values (20 m Shuttle Run Test – 58%; Cooperʼs 12 m Run – 81%). However, as other results suggest, the low test validity level could be explained by the lower level of JT reliability.
Although the test objectivity seems to be highly sa-tisfactory (ICC = 0.997) in male PE students, other items of reliability analysis do not achieve such good results. The study showed that the test performance between two repeated attempts within a week interval increased on average by 3.54 points (systematic error) in male PE students. Only 14% of the cases were lower than in the previous attempt, and the variability of the re-test diff erences was high (from –10 to 31 points). The computed value of Cohen’s d (eff ect size) refers to a medium eff ect of a factor causing these changes. In the sense of high demands for accuracy of the test, we consider this value of systematic error to be practically signifi cant. It can be estimated only, whether its source is the learning eff ect and experience with the test (most of the participants did this test for the fi rst time) or not. The better participants learn, the better they can distribute their strength into the time limit of 2 minutes; a strategy they can use to increase or decrease rhythm of repeated positions within the attempt. In case learning eff ect aff ects the intra-individual diff erences, the re-test diff erences should decrease with number of attempts. The value of re-test’s ICC (TABLE 2) and the range of its 95% interval of confi dence points out a “question-able” relative reliability (Atkinson & Nevill, 1998). It indicates very “unsteady” order of individual within the group in repeated testing and consequently its “unsteadi-ness” towards all normative results. We do not expect the interval between the test realizations had a signifi -cant impact on increasing or decreasing of individual’s performance abilities for this test which would also be a possible source of measurement errors. In the case of this test, other sources of measurement errors might be tiredness, changes of health or change of motivation. The measurement was realized at the same time in one week period, and therefore we expect the contingent ti red ness to be for all athletes (regular training) in both measurements the same or roughly the same.
In monitored males, the standard error of measure-ment in JT was 3.96 points which equals to 17.8% of one category of population norm compiled by Jacík. We
consider this value to be practically signifi cant. Com-puted Bland’s and Altman’s 95% limits of agreement of repeated measurements (Fig. 1) refl ects the fact that 98% of possible following test/re-test diff erences could range from –9.2 to 16.3 points (i.e. 25.5 points!). The magnitude of this interval (together with SEM value) denotes the low level of JT absolute reliability.
While test qualities were originally verifi ed by Ja-cík, the reliability was assessed on the bases of cor-relation analysis only – the indicators of relative reli-ability respec tively. Computed coeffi cients of stability (r = 0.854–0.875), long term stability (r = 0.807) and objectivity (r = 0.981) led him to claim test reliability as satisfactory (Jacík, 1983). However, these results cannot be considered as suffi cient, because the statistics used here (test/re-test correlation coeffi cient as stabili ty and inter-rater correlation coeffi cient as objectivity) are not sen sitive to many of measurement errors (e.g. mentioned standard error of measurement) (Atkinson & Nevill, 1998; Hopkins, 2000; Thomas, Nelson, & Silverman, 2005). The source of errors such as the already men-tioned learning eff ect cannot be detected in coeffi cients computed by Jacík. Contrary to Jacík’s results, based on our results in PE students we can confi rm neither our assumption of suffi cient test reliability nor of the test validity.
Limitations. In this study, it is necessary to point out to several limitations in the research – 1. although all the participants were PE university students (same university), the reliability and validity were verifi ed se-pa rately in diff erent groups of individuals (diff erent gen-der); 2. the detected higher homogeneity of the research sample (lower data variability) could increase the level of Pearson’s correlation coefficient used in the test; 3. the test/re-test diff erences in JT, just like in most mo-tor tests, depend on a level of performance motivation of participants in partial trials – so the performance mo ti vation can be considered as source of measurement error (in the study, this limitation was partly eliminated by clarifying the importance of an achievement of maxi-mal performance in both trials to the participants).
CONCLUSIONS
con-sider the test to be used appropriately for any assess-ment purpose, unless the moveassess-ment content of the test is changed or modifi ed respectively (to increase test re liability).
ACKNOWLEDMENT
The study has been supported by the research grant from the Ministry of Education, Youth and Sports of the Czech Republic (No. MSM 6198959221) “Physical Activity and Inactivity of the Inhabitants of the Czech Republic in the Context of Behavioral Changes”.
REFERENCES
Atkinson, G., & Nevill, A. M. (1998). Statistical methods for assessing measurement error (reliability) in vari-ables relevant to sports medicine. Sports Medicine, 26(4), 217–238.
Baumgartner, T. A., & Jackson, A. S. (1982). Measure-ment for evaluation in physical education (2 ed.). Bos-ton: McGraw-Hill.
Caspersen, C. J., Powell, K. E., & Christenson, G. M. (1985). Physical activity, exercise, and physical fi t-ness: Defi nitions and distinctions for health-related research. Public Health Reports, 100(2), 126–131. Cohen, J. (1988). Statistical power analysis for behavioral
science (2nd ed.). Hillsdale, IL: Erlbaum.
Heyward, V. H. (2010). Advanced fi tness assessment and exercise prescription (6 ed.). Champaign, IL: Human Kinetics.
Hopkins, W. G. (2000). Measures of reliability in sports medicine and science. Sports Medicine, 30(1), 1–15. Jacík, V. (1983). Celostní motorický test. Tělesná
výcho-va mládeže, 50(1), 245–258.
Janssen, I., & LeBlanc, A. G. (2010). Systematic review of the health benefi ts of physical activity and fi tness in school-aged children and youth. International
Jour-nal of Behavioral Nutrition and Physical Activity, 7, 40–55.
Mahar, M. T., Welk, G. J., Rowe, D. A., Crotts, D. J., & McIver, K. L. (2006). Development and validation of a regression model to estimate VO2peak from PACER 20 m shuttle run performance. Journal of
Phy sical Activity and Health, 3(Suppl. 2), 34–46. Marcus, B. H., & Forsyth, L. H. (2009). Psychologie
aktiv ního způsobu života (L. Dobrý & J. Hendl, Trans.) (2 ed.). Praha: Portál.
Plowman, S. A., Sterling, C. L., Corbin, C. B., Mere-dith, M. D., Welk, G. J., & Morrow, J. J. R. (2006). The history of FITNESSGRAM. Journal of Physical
Activity and Health, 3, 5–20.
Seliger, V., & Bartůněk, Z. (1978). Mean values of
va-rious indices of physical fi tness in the investigation of Czech population aged 12–55 years. Praha: Olympia. Suchomel, A. (2003). Současné přístupy k hodnocení
tělesné zdatnosti u dětí a mládeže (Fitnessgram).
Čes ká kinantropologie, 7(1), 81–98.
Suchomel, A. (2004). Hodnocení tělesné zdatnosti ve školní tělesné výchově. Tělesná výchova a sport mlá-deže, 70(4), 2–7.
The Presidentʼs Council on Physical Fitness and Sports. (2010). Defi nitions: Health, fi tness, and physical
activ-ity. Retrieved 21. 3. 2011 from the World Wide Web: http://www.fi tness.gov/digest_mar2000.htm Thomas, J. R., Nelson, J. K., & Silverman, S. J. (2005).
Research methods in physical activity (5 ed.). Cham-paign, IL: Human Kinetics.
Vanhees, L., Lefevre, J., Philippaerts, R., Martens, M., Huygens, W., Troosters, T., et al. (2005). How to as-sess physical activity? How to asas-sess physical fi tness?
European Journal of Cardiovascular Prevention and Rehabilitation, 12(2), 102–114.
Welk, G. J., & Meredith, M. D. (Eds.). (2008). FIT NESS
-GRAM/ACTIVITYGRAM: Reference Guide (3 ed.). Dalas, TX: The Cooper Institute.
WHO. (2010). Diet and physical activity: A public health
priority. Retrieved 24. 2. 2010 from the World Wide Web: http://www.who.int/dietphysicalactivity/en/ index.html
JACÍKŮV TEST – NOVÝ POHLED NA KVALITU TESTU
(Souhrn anglického textu)
VÝCHODISKA: Sebehodnocení tělesné zdatnosti vyžaduje hledat motorické testy, které nekladou vysoké materiální, prostorové ani dovednostní nároky na jejich provedení. Jacíkův test (JT) se v tomto ohledu jeví jako velice výhodný. Dosavadní poznatky o vlastnostech to-hoto testu však nejsou úplné. Vzhledem k pohybové ná-plni JT lze předpokládat, že výkon v tomto testu bude do určité míry podmíněn také úrovní aerobní zdatnosti.
CÍLE: Cílem studie je posoudit reliabilitu JT a stano-vit podíl aerobní zdatnosti na testovém výkonu.
běhátku). Objektivita a míra relativní reliability je vyjá-dřena pomocí ICC. SEM a Bland-Altmanovy 95% limity shody byly stanoveny k posouzení absolutní reliability.
VÝSLEDKY: Byl zjištěn nízký podíl společné vari-ability JT a VO2max (pouhých 13,3 %). ICCinter-raters = 0,997 ukazuje na vysokou míru objektivity (inter-rater re liability). Výsledek ICCinter-trials = 0,790 naznačuje „po-chybnou úroveň“ relativní reliability. Systematická chyba měření dosahuje hodnoty 3,54 bodu. Na neuspo kojivou míru absolutní reliability ukazuje jak SEM = 3,96 bodu, tak i šíře Bland-Altmanových 95% limitů shody (–9,2; 16,3).
ZÁVĚRY: JT není vhodný nástroj pro hodnocení motorických předpokladů u vysokoškoláků, a to přede-vším z důvodů nízké reliability (relativní i absolutní). Interpretace výsledků tohoto testu by byla zavádějící.
Klíčová slova: reliabilita, sebehodnocení, studenti, testy mo-to rické, validita, VO2max.
Mgr. Roman Cuberek, Ph.D.
Education and previous work experience
2000–2007 – Ph.D. study program at the Faculty of Phy sical Culture, Palacký University, Olomouc. First-line publications
Cuberek, R., & Frömel, K. (2011). K problematice vý zkumného výběru a testování nulové hypotézy. Česko slovenská psychologie, 55(5), 468–477.
Cuberek, R., & Machová, I. (2009). The motor perform-ance progression of future undergraduate students of physical education. Acta Universitatis Palackianae
Olomucensis. Gymnica., 39(4), 15–23.
Cuberek, R., Ansari, W. E., Frömel, K., Skalik, K., & Sigmund, E. (2010). A comparison of two motion sen sors for the assessment of free-living physical ac tivity of adolescents. International Journal of
Envi ronmental Research and Public Health, 7(4),
1558–1576.
Cuberek, R., Skalik, K., & Frömel, K. (2009). Kompa-race individuální kategorizace úrovně pohybové akti-vity monitorované akcelerometrem a krokoměrem. Česká kinantropologie, 13(4), 9–15.
Kokštejn, J., Psotta, R., Frömel, K., Frýbort, P., Jaho-dová, G., & Cuberek, R. (2011). Pohybová aktivita dětí s motorickým defi citem. Česká kinantropologie, 15(3), 76–88.
Palacký University, Olomouc Faculty of Physical Culture
tř. Míru 115 771 11 Olomouc