DEMOGRAPHIC RESEARCH
VOLUME 32, ARTICLE 45, PAGES 1239
−
1266
PUBLISHED 3 JUNE 2015
http://www.demographic-research.org/Volumes/Vol32/45/ DOI: 10.4054/DemRes.2015.32.45
Research Article
One-person households in India
Premchand Dommaraju
This publication is part of the Special Collection on “Living alone: One-person households in Asia,” organized by Guest Editors Wei-Jun Jean Yeung and Adam Ka-Lok Cheung.
©2015 Premchand Dommaraju.
This open-access work is published under the terms of the Creative Commons Attribution NonCommercial License 2.0 Germany, which permits use, reproduction & distribution in any medium for non-commercial purposes, provided the original author(s) and source are given credit.
1 Introduction 1240
2 Family and households in India 1242
3 Data and methods 1245
4 Results 1246
4.1 Estimates of one-person households 1246 4.2 Characteristics of one-person households 1249 4.3 Odds of staying in one-person households 1253
5 Discussion 1257
6 Acknowledgements 1260
One-person households in India
Premchand Dommaraju1
Abstract
OBJECTIVE
The objectives of this article are: 1) to estimate the prevalence of one-person households in India; 2) to examine the demographic, social and economic characteristics of these households, and 3) to analyse the determinants of one-person households.
METHODS
Data from the Indian censuses are used to gauge the prevalence of one-person households. In addition, data from the third round of District Level Household and Facility Survey (DLHS-3), a large and nationally representative data, are used to examine the characteristics of one-person households and to estimate the odds of staying in such households.
RESULTS & CONCLUSIONS
The prevalence of one-person households in India is low compared to that in other parts of Asia. While the prevalence of OPH is low, the number of such households is large, and expected to grow in the next few decades. The results presented reveal important social, economic and demographic differences between one-person and multi-person households. Elderly females and young migrants who live alone are potential vulnerable groups. The results are situated within the socio-cultural and demographic contexts of India.
1 Division of Sociology, School of Humanities and Social Sciences, Nanyang Technological University, 14
1. Introduction
Households and families in India are being transformed by the processes of economic liberalization, structural changes and changes in social spheres (Ganguly-Scrase 2003). One such change is the expansion and creation of new economic opportunities for both men and women. These opportunities have meant that many more young men and women are economically independent, and less reliant on parents for housing and other needs (Derné, Sharma, and Sethi 2014). This, along with the trend of young people moving to urban areas in search of new opportunities, is reshaping living arrangements (Taylor and Bain 2005). Other changes such as proliferation of mass media (such as cable TV) has exposed wider society to “different possible lives”, in Appadurai’s (1996) words, and have affected people’s attitudes and behaviours (Jensen and Oster 2009). These changes in attitudes and behaviours include those related to family and living arrangements. Along with economic liberalization and mass media, other aspects of liberalization, structural changes and changes in social spheres are bound to have an influence on households.
While majority of families in India continue to be nuclear, new family forms are emerging (Niranjan, Nair, and Roy 2005; Shah 2005). Increasing urbanization, higher education, and participation in formal labour sector create opportunities for new family structures to emerge. In addition, changes in attitude and aspirations coupled with the weakening of the power exerted by parents and families may promote alternative living arrangements. However such changes have not radically altered the Indian social system as they have in many East Asian and Southeast Asian societies. Several key aspects of the Indian society such as its kinship, marriage, and family systems have not been fundamentally altered, and continue to influence household structure.
This paper focuses narrowly on one type of household, the one-person household (OPH) and investigates whether or not the socio-economic and cultural changes have led to a growth in this type of household. As such households were not common in the past, little is known about the characteristics and determinants of these households. Given the population size of India, however, the number of people living in OPH is, as will be demonstrated later in the paper, large. By 2020, it is projected that India will have the fourth highest number of OPH, after the USA, China and Japan (Euromonitor International 2012).
attitudes and behaviour, might lead to formation of even larger number of OPH in the near future, making the study of such households both necessary and timely.
Second, the influences of and the attendant changes in household structure in India are different from those experienced by Western societies, on which much of the current literature on OPH is based. Examination of OPH in India provides a counter-narrative to the current literature by illustrating how local contexts shape the pathways and meanings associated with living alone. The Indian experience also illustrates the vulnerability faced by those living alone. As the findings presented in this paper reveal, an overwhelming proportion of those living in OPH in India are poor, and a large number are elderly women. These groups are particularly disadvantaged, and living alone makes them more vulnerable. The study of OPH in India provides a useful comparison to studies from other countries in Asia (included in this Special Issue) by drawing attention to the similarities and differences across countries in Asia.
The two groups that have received extensive attention in the context of living alone are the young and the elderly. The increasing trend of living alone among the young, especially in the West, has been attributed primarily to the delay in the entry into marriage, and to non-marriage (Klinenberg 2012; Jamieson and Simpson 2013). In addition to marriage, changing profile of education and labour force, and internal and international migration has had a profound effect on living arrangements of the young (Stone, Berrington, and Falkingham 2011). The cultural shift towards individualistic lifestyles has meant that people prefer independent living, and such preferences are much more accepted now than before (Keilman 1988; Vitali 2010). Increasing rates of divorce and separation have also lead to changes in family structure including increasing levels of solo living in some countries (Demey et al. 2013; Park and Raymo 2013).
in some Indian cities. However, any move away from intergenerational co-residence is still seen as a sign of breakdown in traditional Indian values (Lamb 2011).
India’s socio-cultural and demographic experiences have influenced household structure in particular ways. It is important to understand these socio-cultural and demographic experiences before looking at changes in household transitions. The next part of the paper discusses these experiences before moving to specifics of OPH in India. Then the paper analyses various aspects of OPH, including the role of age, gender, marital status and economic factors using census and survey data.
2. Family and households in India
Jamieson and Simpson (2013) use Therborn’s concept of “family-sex-gender” system to understand the complex interactions in demographic, cultural, institutional factors giving rise to trends in living alone (Therborn 2004). The “family-sex-gender” nexus plays a crucial role in shaping family and household structures in India and in two important transitions that influence household structure − transition to adulthood and transition to old age.
Before moving into specifics of the two transitions, it is necessary to understand the key features of the family, sex and gender system in India. While the importance of family in Indian culture and society is well acknowledged, there is considerable debate about the structure of the family in the past. A recurrent image of Indian households in the past is of large and joint or extended families. This image is contrasted with the current households which are smaller in size. The smaller household size is seen as evidence for breakdown of the joint families of the past. However, the reduction in household size has been driven by lower fertility rather than any significant changes to the household composition. Though joint or extended families were idealized, the prevalence of such households in the past was limited to landholding and cultivating sections of the society (Mandelbaum 1972; Singh 2003). Earlier work on the Indian family, based on anthropological and ethnographic material, assumed the idealized household structure prevailed in the past, and explained changes in household structure using an evolutionary approach. In this approach, joint and extended households disintegrated to form the nuclear structure seen today (Patel 2005; Shah 2005). At least for the last half a century, a time in which India has undergone several social upheavals, the family structure has remained predominately nuclear, although accompanied by some changes (Breton 2013; Niranjan, Nair, and Roy 2005).
exerted by male members of the family (father, brother, husband) over women. In the context of household formation, the patriarchal system has sustained nearly universal and relatively early marriage for women. Less than five per cent of women remained unmarried at the age of 30, and marriage occurs relatively early, with Singulate Mean Age at Marriage of 19 for women (Registrar General, India 2001). An overwhelming proportion of marriages are arranged by parents or families, though many more women are now consulted and have a say in the choice of their spouse than before (Desai and Andrist 2010). The level of participation a woman has in her marriage decisions has shown to be related to post-marital autonomy and decision making (Jejeebhoy et al. 2013).
The relatively small number of self-arranged marriages is understandable in a context where such a marriage connotes promiscuity and is considered to bring disrepute to family honour (Kodoth 2008; Netting 2010). In this context, early marriage is seen as a way to control and discipline female sexuality. As caste endogamy is the norm in India the control of women’s sexuality is seen as necessary to protect the purity of caste and to assert caste pride (Abraham 2014; Chakravarti 1993; Kaur 2012). The persistence of arranged marriages despite economic and social changes shows the power of gender norms in Indian society (Kaur 2004). The persistence of early and arranged marriage means that the possibility of living alone during the transition to adulthood is limited, especially for women.
The patriarchal family system with preference for sons has skewed the sex ratios in India, resulting in more males than females at marriageable ages. Such shortages would make it difficult for some men to marry. However, as Guilmoto (2008) has noted, the inequitable sex ratios are localized to parts of northern India, spreading to other parts in recent decades. In these groups, such as those found in regions in the northern state of Haryana, due to sex ratio imbalances, men are marrying women from different castes and from other parts of the country (Kaur 2012). Such inter-regional and inter-caste marriages are not yet common in other parts of the country. The impact of skewed sex ratios on marriage markets and the situation of single men are bound to have consequences for living arrangements and households in India.
lack of support, stigma, vulnerabilities, including sexual vulnerabilities, faced by divorced and separated women have kept marriages intact for the majority of the population, with perhaps the exception of the urban poor (Aura 2008; Grover 2011).
Besides marital dissolution, changes in household structure could result from migration of household members. Migration changes the structure of households and might lead to formation of new households. While there are significant numbers of international emigrants from India, they constitute a small proportion of overall migration. Most migrants move within the country, and the majority of such migrations are temporary migrations from rural to urban regions (Czaika 2012; Keshri and Bhagat 2013). Migration could lead to reduction in household size due to the loss of a household member. But as Desai and Banerji (2008) have noted, migrant and non-migrant household sizes do not differ in size, because women who are left behind usually stay with other family members. For young married women without children migration of a husband could potentially lead to creation of an OPH. This is not common, however, because such living arrangements are considered socially unacceptable, and young married women usually live with extended family in the absence of the spouse (de Haan 2006).
The second transition that is important for household structure and size is the transition to old age. Children in many societies typically move out of the parental home in adulthood or after marriage. This means that transition to old age is preceded by shrinking of household size. Death of a spouse may further shrink household size to one person. In some societies, transition to old age might also mean moving to old age communities or institutions, thus dissolving households. Likewise in India transition to old age brings about changes in households.
Caste is a unique and important feature of Indian society. The dimension of caste that is important for household structure is its influence on household formation and expansion or contraction through marriage, childbirth, divorce or separation, migration, as well as its influence on living arrangements. Ethnographic and anthropological studies have documented and examined kinship, social, family and other aspects of particular castes and these studies show the diversity of practices among the different caste groups. While the diversity of caste groups cannot be denied, it is not easy to gauge the scale of this diversity given the sheer number of caste groups. The Indian constitution lists close to 2000 caste and tribal groups as Scheduled Castes (SC) and Scheduled Tribes (ST) which require protection against social injustices and discrimination. In addition to SC and ST, there are about 2500 odd other caste groups (Singh 1992). The myriad variations in social norms and practices among the caste groups might contribute to a diversity of household patterns. However, the difficulty in classification of castes in a socially meaningful way hinders examination of the influence of caste on household patterns. But the classification of caste as adopted by the Indian government, discussed in the next section, can be used to gain some insights on the influence of caste on household structure.
3. Data and methods
The Indian censuses collect information on several aspects of households including a complete listing of all household members and basic characteristics of the members. The census differentiates between three types of households: “normal” households, institutional households and houseless households (Census of India 2001). Institutional households refer to unrelated persons living in an institution. By definition, there cannot be a one-person institutional household as institutions are defined as places where more than one person resides. Houseless households are defined as households who do not live in a building or a census house. Such households can consist of one or more related or unrelated persons (ibid.). Households not falling in the above two categories are considered to be “normal” households. As is common for most censuses and surveys, households are defined as persons who live together and take their meals from a common kitchen. Information from the census tables are used to present the prevalence of OPH.
survey collected household data from 720,320 households, out of which 25,360 households were OPH. The household section of the questionnaire collected basic demographic and educational information for all household members. The analysis is based on data on households and individuals living in the households. The analysis is restricted to individuals aged 15 and above. There were 2,467,162 individuals age 15 and above living in 720,320 households. Logistic regression is used to estimate the effects of various covariates on the odds of living in OPH. Unadjusted and adjusted odds ratios from the models are presented. The analyses used household weights provided in the dataset.
The definition of household used in DLHS is similar to the census definition. However, the survey includes only “normal” households and excludes houseless and institutional households. The social and economic indicators presented in the paper were measured at the time of the survey. Therefore indicators, such as economic status, reflect current status and not the status at the time OPH was formed. The indicator for caste status is based on Indian government’s classification of caste as Scheduled Caste (SC), Scheduled Tribe (ST), Other Backward Classes (OBC) and others (this group is known as Forward Caste (FC)). The classification of caste depends primarily on historical status of the caste group, socio-economic status and political manoeuvring. It should be noted that the purpose of this classification is for implementation of affirmative action programmes and for social justice. This classification is not primarily based on socio-cultural characteristics of the caste groups.
4. Results
4.1 Estimates of one-person households
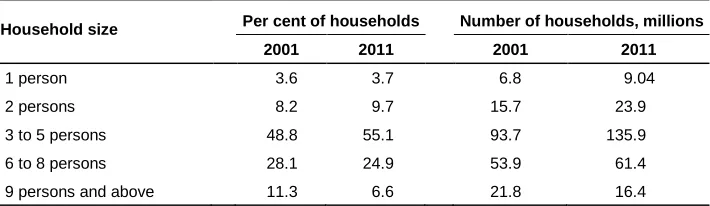
Table 1: Per cent and number of households by size, India, 2001 and 2011
Household size Per cent of households Number of households, millions 2001 2011 2001 2011
1 person 3.6 3.7 6.8 9.04
2 persons 8.2 9.7 15.7 23.9
3 to 5 persons 48.8 55.1 93.7 135.9
6 to 8 persons 28.1 24.9 53.9 61.4
9 persons and above 11.3 6.6 21.8 16.4
Source: Census data from 2001 and 2011 censuses.
Using the census data, it is possible to map the regional variation in OPH in India for 2001 and 2011. The maps presented in Figure 1 depict the variations and changes over the last decade. The southern region and the states of Madhya Pradesh and Chhattisgarh and parts of northeast had relatively high levels of OPH in 2001 and this pattern broadly remained the same in 2011. The lowest numbers of people living alone is seen in the belt stretching from Rajasthan, Uttar Pradesh and Bihar, where the percentage living alone was below 3.1 in 2001 and 2011.
The per cent of OPH estimated from the DLHS data are quite similar to those reported in the censuses. The survey data allows one to distinguish between de jure and
Figure 1: Percentage of one-person households, India, 2001 and 2011
2001
2011
4.2 Characteristics of one-person households
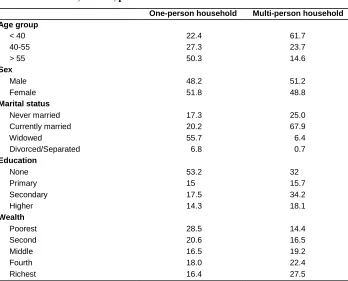
Table 2 presents demographic and socio-economic characteristics of those living in OPH and multi-person households. The values represent the per cent within each type of households. For instance, 22.4% of those living in OPH were aged below 40 while 61.7% of those in multi-person households were aged below 40. As seen from the table, the majority of those living in OPH were above the age of 55 and majority of those living in multi-person households were below the age of 40. The age distribution of those living in OPH for men and women is plotted in Figure 2. The proportion of women living alone increases steeply after the age of 40, reaching a peak around age 60 before declining. For men, however, the proportion living in OPH remains fairly uniform between the ages of 25 and 60.
Table 2: Characteristics of one and multi-person households, India, 2007−8, per cent
One-person household Multi-person household Age group
< 40 22.4 61.7
40-55 27.3 23.7
> 55 50.3 14.6
Sex
Male 48.2 51.2
Female 51.8 48.8
Marital status
Never married 17.3 25.0
Currently married 20.2 67.9
Widowed 55.7 6.4
Divorced/Separated 6.8 0.7
Education
None 53.2 32
Primary 15 15.7
Secondary 17.5 34.2
Higher 14.3 18.1
Wealth
Poorest 28.5 14.4
Second 20.6 16.5
Middle 16.5 19.2
Fourth 18.0 22.4
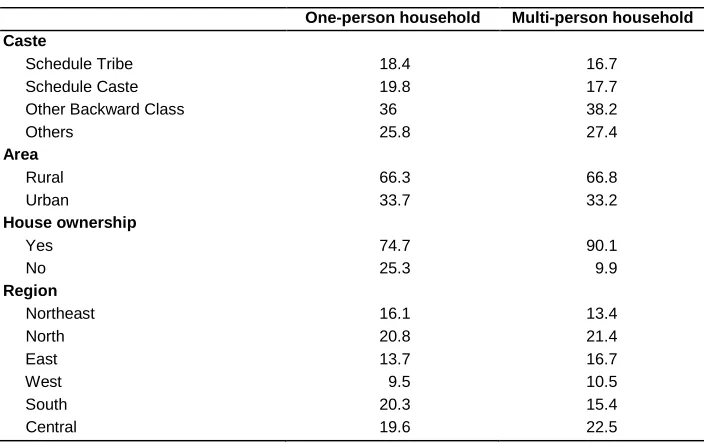
Table 2: (Continued)
One-person household Multi-person household Caste
Schedule Tribe 18.4 16.7
Schedule Caste 19.8 17.7
Other Backward Class 36 38.2
Others 25.8 27.4
Area
Rural 66.3 66.8
Urban 33.7 33.2
House ownership
Yes 74.7 90.1
No 25.3 9.9
Region
Northeast 16.1 13.4
North 20.8 21.4
East 13.7 16.7
West 9.5 10.5
South 20.3 15.4
Figure 2: Age distribution of those staying in one-person households, by sex, India, 2007−8
The proportion of women living in OPH is higher than that of men. In terms of marital status, those who were widowed comprised more than half of those living alone, and about two-thirds of those living in multi-person households were currently married. A majority of those living in OPH had no education compared to less than third of those living in multi-person households. In relation to wealth, there appears to be a negative gradient, with the poorest making up 28% of OPH and a positive wealth gradient for those living in multi-person households. The rural/urban make-up is similar for both one and multi-person households. About 90% of those living in multi-person households owned the home in which they were living, compared to 75% home-ownership for those living in OPH.
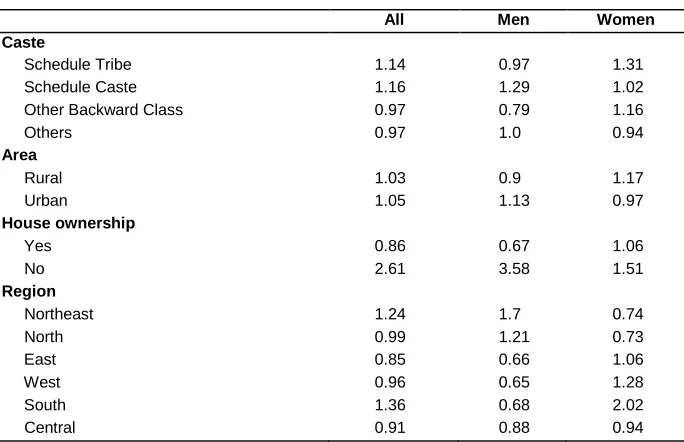
the table, of all the respondents aged over 55, nearly 3.5% were living in OPH. The following groups had a higher proportion living in OPH: older persons; widowed, divorced or separated; those who had no education; those in the poorest wealth quintile; and those living in southern India. Proportion of men living in OPH was only slightly lower than women. However, there are some notable differences by sex, especially in age and marital status, among those living in OPH. Nearly five per cent of older women were living in OPH compared to about two per cent of men. About 14 % of divorced or separated men were living alone compared to seven per cent for women. A slightly higher proportion of urban men were living in OPH than rural men, while the pattern was reversed for women.
Table 3: Per cent living in one-person households, by sex, India, 2007−8
All Men Women Age group
< 40 0.38 0.6 0.15
40-55 1.19 1.22 1.16
> 55 3.48 2.08 5.06
Sex
Male 0.98 - -
Female 1.1 - -
Marital status
Never married 0.72 0.94 0.32
Currently married 0.31 0.51 0.11
Widowed 8.37 8.88 8.22
Divorced/Separated 9.3 13.86 7.03
Education
None 1.71 1.41 1.86
Primary 0.99 1.03 0.95
Secondary 0.53 0.68 0.31
Higher 0.82 1.05 0.42
Wealth
Poorest 2.04 1.45 2.63
Second 1.29 1.02 1.57
Middle 0.89 0.83 0.96
Fourth 0.84 1.0 0.66
Table 3: (Continued)
All Men Women Caste
Schedule Tribe 1.14 0.97 1.31
Schedule Caste 1.16 1.29 1.02
Other Backward Class 0.97 0.79 1.16
Others 0.97 1.0 0.94
Area
Rural 1.03 0.9 1.17
Urban 1.05 1.13 0.97
House ownership
Yes 0.86 0.67 1.06
No 2.61 3.58 1.51
Region
Northeast 1.24 1.7 0.74
North 0.99 1.21 0.73
East 0.85 0.66 1.06
West 0.96 0.65 1.28
South 1.36 0.68 2.02
Central 0.91 0.88 0.94
4.3 Odds of staying in one-person households
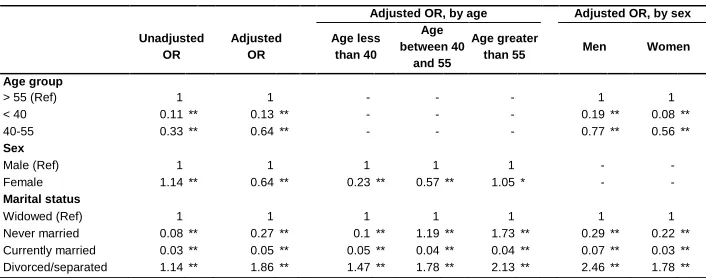
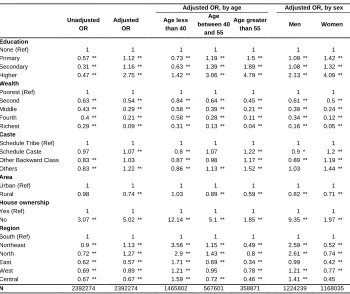
The descriptive findings presented above provide useful information on the characteristics of OPH. However, they do not provide information on how OPH differ from multi-person households. Using the unadjusted and adjusted odds ratios presented in Table 4, we discuss the determinants of staying in OPH. Table 4 shows unadjusted estimates and adjusted estimates for all, and adjusted estimates by age and sex. The adjusted estimates by age and sex help us to examine whether or not the effects of the covariates differ by age and sex. Results from analyses using interaction models for sex and other covariates are presented in Table 5.
Marital status has a significant influence on the odds of staying in OPH. While widowed men and women had higher odds than the never and currently married, those divorced and separated had higher odds than widowed respondents. The higher odds of staying in OPH for divorced and separated people compared to the widowed is similar to findings from other South Asian countries (Podhisita and Xenos 2015). However, the odds of staying in OPH were higher than the widowed for never-married people aged 40 and above. This suggests that those who have never been married as they enter middle and older ages are more likely to stay alone than the widowed, who might have children to live with.
The unadjusted estimates of education show that those with no education are more likely to live in OPH. The adjusted estimates show a different picture, however, in which higher levels of education increase the odds of staying in OPH. The adjusted estimates for both men and women show a similar pattern of higher odds of staying in OPH for those with higher education. The reversal of the effect of education is explained primarily by combination of age, wealth and marital status factors. The difference between those with higher education and those with no education is large for older persons.
The effect of wealth in both unadjusted and adjusted models show the poorest as having higher odds of living in OPH than other wealth groups. This pattern is seen for all age groups, and for both men and women. It is clear from the estimates that the odds of staying in OPH decreases with wealth. The comparison of effect of education and wealth is interesting. While the unadjusted estimates of education and wealth are in the same direction − higher education or wealth lowers odds of staying in OPH − the adjusted estimates are in different directions − higher education increases odds of staying in OPH and higher wealth decreases the odds.
Table 4: Odds ratios (OR) of staying in one-person households
Adjusted OR, by age Adjusted OR, by sex
Unadjusted OR Adjusted OR Age less than 40 Age between 40 and 55 Age greater
than 55 Men Women
Age group
> 55 (Ref) 1 1 - - - 1 1 < 40 0.11 ** 0.13 ** - - - 0.19 ** 0.08 ** 40-55 0.33 ** 0.64 ** - - - 0.77 ** 0.56 ** Sex
Male (Ref) 1 1 1 1 1 - - Female 1.14 ** 0.64 ** 0.23 ** 0.57 ** 1.05 * - - Marital status
Table 4: (Continued)
Adjusted OR, by age Adjusted OR, by sex
Unadjusted OR Adjusted OR Age less than 40 Age between 40 and 55 Age greater
than 55 Men Women
Education
None (Ref) 1 1 1 1 1 1 1 Primary 0.57 ** 1.12 ** 0.73 ** 1.19 ** 1.5 ** 1.09 ** 1.42 ** Secondary 0.31 ** 1.16 ** 0.63 ** 1.39 ** 1.89 ** 1.08 ** 1.32 ** Higher 0.47 ** 2.75 ** 1.42 ** 3.06 ** 4.79 ** 2.13 ** 4.09 ** Wealth
Poorest (Ref) 1 1 1 1 1 1 1 Second 0.63 ** 0.54 ** 0.84 ** 0.64 ** 0.45 ** 0.61 ** 0.5 ** Middle 0.43 ** 0.29 ** 0.58 ** 0.39 ** 0.21 ** 0.39 ** 0.24 ** Fourth 0.4 ** 0.21 ** 0.58 ** 0.28 ** 0.11 ** 0.34 ** 0.12 ** Richest 0.29 ** 0.09 ** 0.31 ** 0.13 ** 0.04 ** 0.16 ** 0.05 ** Caste
Schedule Tribe (Ref) 1 1 1 1 1 1 1 Schedule Caste 0.97 1.07 ** 0.8 ** 1.07 1.22 ** 0.9 * 1.2 ** Other Backward Class 0.83 ** 1.03 0.87 ** 0.98 1.17 ** 0.89 ** 1.19 ** Others 0.83 ** 1.22 ** 0.86 ** 1.13 ** 1.52 ** 1.03 1.44 ** Area
Urban (Ref) 1 1 1 1 1 1 1 Rural 0.98 0.74 ** 1.03 0.89 ** 0.59 ** 0.82 ** 0.71 ** House ownership
Yes (Ref) 1 1 1 1 1 1 1 No 3.07 ** 5.02 ** 12.14 ** 5.1 ** 1.85 ** 9.35 ** 1.97 ** Region
South (Ref) 1 1 1 1 1 1 1 Northeast 0.9 ** 1.13 ** 3.56 ** 1.15 ** 0.49 ** 2.59 ** 0.52 ** North 0.72 ** 1.27 ** 2.9 ** 1.43 ** 0.8 ** 2.61 ** 0.74 ** East 0.62 ** 0.57 ** 1.71 ** 0.69 ** 0.34 ** 0.99 0.42 ** West 0.69 ** 0.89 ** 1.21 ** 0.95 0.78 ** 1.21 ** 0.77 ** Central 0.67 ** 0.67 ** 1.59 ** 0.72 ** 0.46 ** 1.41 ** 0.45 N 2392274 2392274 1465802 567601 358871 1224239 1168035
Note: ** p < 0.01; * p < 0.05.
Table 5: Odds ratio of living in one-person households: Interaction estimates of sex and selected covariates
Odds ratio women vs. men 95% CI Age group
< 40 0.31 0.29 0.33
40-55 0.52 0.49 0.55
> 55 0.99 0.95 1.03
Marital status
Never married 0.35 0.32 0.38
Currently married 0.33 0.31 0.36
Widowed 1.01 0.97 1.05
Divorced/Separated 0.49 0.44 0.55
Education
None 0.81 0.78 0.84
Primary 0.67 0.63 0.72
Secondary 0.40 0.37 0.43
Higher 0.40 0.37 0.44
Wealth
Poorest 1.05 1.00 1.11
Second 0.89 0.84 0.95
Middle 0.63 0.59 0.67
Fourth 0.35 0.33 0.38
Richest 0.33 0.31 0.36
Area
Rural 0.77 0.75 0.80
Urban 0.42 0.40 0.44
Region
Northeast 0.28 0.26 0.30
North 0.39 0.37 0.42
East 0.92 0.86 0.99
West 0.95 0.87 1.04
South 1.25 1.16 1.34
Central 0.70 0.66 0.75
be widowed (due to the age difference between spouses and lower life expectancy for men) and more likely to be divorced or separated (because of lower rates of remarriage for women) they may be more likely to live in OPH, all other factors being equal. Looking across different age groups, females above the age of 55 are about five per cent more likely to stay in OPH than are men in the same age group.
The role of sex on OPH can be examined further using estimates from interaction models with sex and selected covariates presented in Table 5. The estimates are based on separate models for each interaction and controlled for all covariates included in Table 4. The odds ratios from all the interaction models are presented together in a single table for easy readability (the estimates for all covariates included in the models are not shown). The table also presents 95 per cent confidence intervals. If the intervals contain 1, then the estimates are not statistically significant at the 95 per cent level.
The odds ratio of females staying in OPH is lower than for males in almost all categories. To illustrate, for females aged below 40, the odds of staying in OPH is 0.31 times (or 69%) lower than males in the same age group. Older females are not significantly different from males in living in OPH. Except for the widowed, females of all other marital statuses are less likely to live in OPH. For widowed the difference between women and men is not significant. A similar pattern of lower odds of staying in OPH for females is seen for education, wealth and area of residence.
5. Discussion
The per cent of OPH in India is below five per cent. The characteristics of those living in OPH show clear demographic and socio-economic variations. The findings show that older persons are at higher risk of staying in OPH. In terms of marital status, the divorced and separated, followed by widowed, were at higher risk. But at older ages, the never married were at higher risk of staying in OPH. Higher education, controlling for other covariates, increases the risk of staying in OPH, whereas higher wealth decreases the risk. Women are at higher risk of staying in OPH, but their risk stems mainly from marital status differences. When marital status and other covariates are controlled, women have lesser risk of staying in OPH than do men. Results from the interaction models show that men in almost all demographic and socio-economic categories face higher risk of staying in OPH.
provides a good starting point for seeing the extent to which these factors influence households in India.
Hall, Ogden and Hill (1997) highlight the role of household transitions through migration, marriage or cohabitation, fertility, separation or divorce and ageing. These factors considered in the context of India help us to understand the low level of OPH. As was discussed earlier, India is characterized by strong family structures with relatively early and universal marriage. Children within marriage are the norm, and the fertility level is well above replacement. Separation and divorce remain relatively uncommon. All these demographic factors favour the creation and sustaining of multi-person households rather than OPH. A demographic factor that might lead to the creation of one-person households is the differing mortality for men and women at older ages. It is likely that higher mortality rates for men and age difference between the spouses could lead to an increase in female OPH.
In addition to demographic factors, economic and behavioural factors could lead to creation of OPH. The findings on education and wealth show a contrasting picture. The wealth gradient in the odds of staying in OPH shows that those who are well off are less likely to live in OPH. If there is a preference or desire to stay alone, then the wealthy would be more likely to be able to do so. The higher odds for the poor indicate the possibility of economic constraints rather than normative preferences for staying in OPH. However, the higher odds of the educated staying in OPH suggest greater desire among the educated to live solo. The apparent independent and opposite effect of wealth and education reveals an interesting picture, and calls for further examination to better understand their roles in formation of OPH.
The two groups that emerge from the findings as more likely to live in OPH − older persons and the poor − are unlikely to have desired to live in such households. It is difficult to chart the future of household change in India using the description of the current patterns of OPH. Increasing urbanization and employment in formal sectors might lead to a growth in OPH, especially among the young. An assessment of the social dynamics, social context, and cultural logic that underline family and household structure might provide some possible scenarios of household change. In charting the changes in households it is vital, as Thornton (2005) has cautioned, not to read history sideways and not to see changes in family or household transformations as moral progress. Changes in households do not follow an evolutionary process and do not change in a linear way.
There is undoubtedly rising desire among the young to be independent and to make their own choices in family matters, as noted by Caldwell, Reddy, and Caldwell (1982); but, this should not be equated with high degree of individualization or the deinstitutionalization of family matters. In many Western societies, demographic changes and family transformations, including formation of OPH, have been linked to greater emphasis on self-realization, self-actualization, self-fulfilment, and to deinstitutionalization and disembedding of social systems (see Cherlin 2004; Giddens 1992; Lesthaeghe and Surkyn 2007). While to a certain extent globalization and modernity have emphasized individual desires, they have not weakened social institutions in India. The changes brought about by globalization and modernity should be interpreted within the cultural logic of the Indian society, and the transformations in the family system must be understood within specific historical and social contexts (Clark‐Decès 2011; Osella 2012).
The findings in this paper present a static view of households at one point in time. Household structure and composition are fluid, and change over the life course. An individual might live in OPH at some point in their life, even if it is for a short duration. As Ram and Wong (1994) have observed, household change in India is associated with changes in life cycle, the support needs of the family, and the requirements of the production system. In the Indian context, the real limiting factor to the growth of OPH is the family-sex-gender system discussed earlier. However, a comparison of East Asian societies that share some similarities with the Indian family-sex-gender system suggests that OPH might increase even in a patriarchal society, if there were greater employment and educational opportunities for women. Such opportunities have the potential to rebalance the gender-power relationship, which might be conducive to the formation of OPH through delay in marriage or increase in non-marriage. If recent demographic and social history is a guide, the rebalancing of gender relationships and changes in marriage and family system is unlikely to be rapid in India. While the pace of change might be gradual, the changes are nevertheless in progress and are bound to influence household patterns.
6. Acknowledgements
References
Abraham, J. (2014). Contingent caste endogamy and patriarchy. Economic and Political Weekly 49(2): 56−65.
Agnes, F. (1999). Law and women of age: A short note. Economic and Political Weekly
34(44): 51−54.
Appadurai, A. (1996). Modernity at large: Cultural dimensions of globalisation. Minneapolis: University Minnesota Press.
Aura, S. (2008). Women and marital breakdown in South India. Reconstructing homes, bonds and persons. [PhD thesis]. Finland: University of Helsinki, Faculty of Social Sciences.
Bennett, J. and Dixon, M. (2006). Single person households and social policy: Looking forwards. York, UK: Joseph Rowntree Foundation.
Bhat, A.K. and Dhruvarajan, R. (2001). Ageing in India: Drifting intergenerational relations, challenges and options. Ageing & Society 21(5): 621−640.
BKPAI (2012). Report on the status of elderly in select states of India 2011. New Delhi, India: United Nations Population Fund (UNFPA).
Bloom, D.E., Mahal, A., Rosenberg, L., and Sevilla. J. (2010). Economic security arrangements in the context of population ageing in India. International Social Security Review 63(3-4): 59−89. doi:10.1111/j.1468-246X.2010.01370.x. Breton, E. (2013). Residence and autonomy in postcolonial Maharashtra. [Unpublished
thesis]. Université de Montréal.
Caldwell, J.C., Reddy, P.H., and Caldwell, P. (1982).The causes of demographic change in rural South India: a micro-approach. Population and Development Review 8(4): 689−728. doi:10.2307/1972469.
Census of India (2001). Concepts and Definitions [electronic resource]. New Delhi: Office of the Registrar General and Census Commissioner, India. www.censusindia.gov.in/.
Chakravarti, U. (1993). Conceptualising Brahmanical patriarchy in early India: Gender, caste, class and state. Economic & Political Weekly 27(14): 579−585.
Chaudhuri, A. and Roy, K. (2009). Gender differences in living arrangements among older persons in India. Journal of Asian and African Studies 44(3): 259−277.
Cherlin, A.J. (2004). The deinstitutionalization of American marriage. Journal of Marriage and Family66(4): 848−861. doi:10.1111/j.0022-2445.2004.00058.x. Chui, E. (2007). Changing norms and pragmatics of co-residence in East Asian
countries. International Journal of Sociology of the Family 33(1): 1−24.
Clark‐Decès, I. (2011). The decline of Dravidian kinship in local perspectives. In: Clark-Decès, I. (ed.). A Companion to the Anthropology of India. Oxford, UK: Wiley-Blackwell: 517−535. doi:10.1002/9781444390599.
Croll, E.J. (2006). The intergenerational contract in the changing Asian family. Oxford Development Studies 34(4): 473−491. doi:10.1080/13600810601045833.
Czaika, M. (2012). Internal versus international migration and the role of multiple deprivation: Some evidence from India. Asian Population Studies 8(2): 125−149. doi:10.1080/17441730.2012.675678.
de Haan, A. (2006). Migration, gender, poverty: family as the missing link. In: Arya, S. and Roy, A. (eds.). Poverty, Gender and Migration. New Delhi: Sage: 107−128. Demey, D., Berrington, A., Evandrou, M., and Falkingham, J. (2013). Pathways into
living alone in mid-life: Diversity and policy implications. Advances in Life Course Research 18(3): 161−174. doi:10.1016/j.alcr.2013.02.001.
Derné, S., Sharma, M., and Sethi, N. (2014). Structural changes rather than the Influence of media: People’s encounter with economic liberalization in India. In: Mathur, N. (ed.). Consumer culture, modernity and identity. New Delhi: Sage Publications: 145−167.
Desai, S. and Banerji, M. (2008). Negotiated identities: Male migration and left-behind wives in India. Journal of Population Research 25(3): 337−355. doi:10.1007/BF 03033894.
Desai, S. and Andrist, L. (2010). Gender scripts and age at marriage in India.
Demography 47(3): 667−687. doi:10.1353/dem.0.0118.
Desai, S., Dubey, A., Joshi, B.L., Sen, M., Shariff, A., and Vanneman, R. (2010).
Human development in India: Challenges for a society in transition. New Delhi: Oxford University Press.
Euromonitor, International (2012). Single living: How atomisation - the rise of singles and one-person households - is affecting consumer purchasing habits. London: Euromonitor International Ltd.
Ganguly-Scrase, R. (2003). Paradoxes of globalization, liberalization, and gender equality: The worldviews of the lower middle class in West Bengal, India.
Gender & Society 17(4): 544−566. doi:10.1177/0891243203254077.
Giddens, A. (1992). The transformation of intimacy: Sexuality, love and eroticism in modern societies. Stanford, CA: Stanford University Press.
Grover, S. (2011). “Purani aur nai shaadi”: Separation, divorce, and remarriage in the lives of the urban poor in New Delhi. Asian Journal of Women's Studies 17(1): 67−99.
Guilmoto, C. (2008). Economic, social and spatial dimensions of India’s excess child masculinity. Population 63: 91−118. doi:10.1353/pop.0.0001.
Hall, R., Ogden, P.E., and Hill. C. (1997). The pattern and structure of one-person households in England and Wales and France. International Journal of Population Geography 3: 161−181. doi:10.1002/(SICI)1099-1220(199706)3:2< 161::AID-IJPG64>3.3.CO;2-U.
Iacovou, M. and Skew, A.J. (2011). Household composition across the new Europe: Where do the new member states fit in? Demographic Research 25(14): 465−490. doi:10.4054/DemRes.2011.25.14.
International Institute for Population Sciences (IIPS) (2010). District Level Household and Facility Survey, 2007-08. Mumbai, India: IIPS.
Jamieson, L. and Simpson, R. (2013). Living alone: Globalization, identity and belonging. Basingstoke: Palgrave Macmillan (Palgrave Macmillan Studies in Family and Intimate Life). doi:10.1057/9781137318527.
Jejeebhoy, S.J., Santhya, K.G., Acharya, R., and Prakash, R. (2013). Marriage-related decision-making and young women's marital relations and agency. Asian Population Studies 9(1): 28−49. doi:10.1080/17441730.2012.736699.
Jensen, R. and Oster, E. (2009). The power of TV: Cable television and women's status in India. The Quarterly Journal of Economics 124(3): 1057−1094. doi:10.1162/q jec.2009.124.3.1057.
Kalavar, J.M. and Jamuna, D. (2011). Aging of Indian women in India: The experience of older women in formal care homes. Journal of Women & Aging 23(3): 203−215. doi:10.1080/08952841.2011.587730.
Kaur, R. (2004). Across-region marriages: Poverty, female migration and the sex ratio.
Economic and Political Weekly 39: 2595−2603.
Kaur, R. (2012). Marriage and migration: Citizenship and marital experience in cross-border marriages between Uttar Pradesh, West Bengal and Bangladesh.
Economic and Political Weekly 47(43): 78−84.
Keilman, N. (1988). Recent trends in family and household composition in Europe.
European Journal of Population 3(3/4): 297−325. doi:10.1007/BF01796903. Keshri, K. and Bhagat, R.B. (2013). Socioeconomic determinants of temporary labour
migration in India: A regional analysis. Asian Population Studies 9(2): 175−195.
doi:10.1080/17441730.2013.797294.
Klinenberg, E. (2012). Going solo: The extraordinary rise and surprising appeal of living alone. New York: Penguin Press.
Kodoth, P. (2008). Gender, caste and matchmaking in Kerala: A rationale for dowry.
Development and Change 39(2): 263−283. doi:10.1111/j.1467-7660.2008.00479 .x.
Lamb, S. (2009). Aging and the Indian diaspora: Cosmopolitan families in India and abroad. Bloomington: Indiana University Press.
Lamb, S. (2011). Ways of aging. In: Clark-Deces, I. (ed.). A companion to the anthropology of India. Oxford: Wiley-Blackwell: 500−516. doi:10.1002/978144 4390599.ch27.
Lesthaeghe, R. and Surkyn, J. (2007). When history moves on – Foundations and diffusion of a second demographic transition. In: Jayakodi, R., Thornton, A., and Axinn, W. (eds.). International Family Change: Ideational Perspectives. New York: Lawrence Erlbaum and Associates, Taylor & Francis Group: 81−118. Mandelbaum, D.G. (1972). Society in India. Bombay: Popular Prakashan.
Mulder, C.H. and Lauster, N.T. (2010). Housing and family: An introduction. Housing Studies 25(4): 433−440. doi:10.1080/02673031003771109.
Netting, N.S. (2010). Marital ideoscapes in 21st-century India: Creative combinations of love and responsibility. Journal of Family Issues 31(6): 707−726. doi:10.1177 /0192513X09357555.
Niranjan, S., Nair, S., and Roy, T.K. (2005). A socio-demographic analysis of the size and structure of the family in India. Journal of Comparative Family Studies 36: 623−651.
Osella, C. (2012). Desires under reform: Contemporary reconfigurations of family, marriage, love and gendering in a transnational south Indian matrilineal Muslim community. Culture and Religion 13(2): 241−264. doi:10.1080/14755610.2012. 675508.
Park, H. and Raymo, J.M. (2013). Divorce in Korea: Trends and educational differentials. Journal of Marriage and Family 75(1): 110−126. doi:10.1111/j.17 41-3737.2012.01024.x.
Patel, T. (2005). Introduction. In: Patel, T. (ed.). The family in India: Structure and practice. New Delhi: Sage Publications: 19−47.
Podhisita, C. and Xenos, P. (2015). Living alone in South and Southeast Asia: An analysis of census data. Demographic Research32(41): 1113−1146. doi:10.4054 /DemRes.2015.32.41.
Ram, M. and Wong, R. (1994). Covariates of household extension in rural India: Change over time. Journal of Marriage and Family 56(4): 853−864. doi:10.2307 /353598.
Registrar General, India (2001). Census of India 2001: Primary Census Abstract. New Delhi, India: Office of the Registrar General.
Shah, A.M. (2005). Family studies in India: retrospect and prospect. Economic and Political Weekly 40(1): 19−22.
Singh, J.P. (2003). Nuclearization of household and family in urban India. Sociological Bulletin 52(1): 53−70.
Singh, K.S. (1992). People of India: An introduction. New Delhi: Oxford University Press.
Stone, J., Berrington, A., and Falkingham, J. (2011). The changing determinants of UK young adults’ living arrangements. Demographic Research 25(20): 629−666.
Taylor, P. and Bain, P. (2005). ‘India calling to the far away towns’ the call centre labour process and globalization. Work, Employment & Society 19(2): 261−282.
doi:10.1177/0950017005053170.
Therborn, G. (2004). Between Sex and Power: Family in the World, 1900-2000. London: Routledge.
Thornton, A. (2005). Reading history sideways: The fallacy and enduring impact of the developmental paradigm on family life. Chicago, IL: University of Chicago Press.
United Nations (2005). Living arrangements of older persons around the world. New York: United Nations.
Vitali, A. (2010). Regional differences in young Spaniards’ living arrangement decisions: A multilevel approach. Advances in Life Course Research 15(2–3): 97−108. doi:10.1016/j.alcr.2010.04.003.