DEMOGRAPHIC RESEARCH
VOLUME 32, ARTICLE 4, PAGES 107
−
146
PUBLISHED 9 JANUARY 2015
http://www.demographic-research.org/Volumes/Vol32/4/ DOI: 10.4054/DemRes.2015.32.4
Research Article
Pathways from fertility history to later life health:
Results from analyses of the English Longitudinal
Study of Ageing
Emily Grundy
Sanna Read
This publication is part of the Special Collection on “Biodemography and Multistate Event History Analysis on Healthy Aging,” organized by Guest Editors Frans Willekens, James Carey, and Li Qiang.
©2015 Emily Grundy & Sanna Read.
This open-access work is published under the terms of the Creative Commons Attribution NonCommercial License 2.0 Germany, which permits use, reproduction & distribution in any medium for non-commercial purposes, provided the original author(s) and source are given credit.
1 Introduction 108
1.1 Previous research 109
1.1.1 Number of children 109
1.1.2 Age at parenthood 110
1.2 Hypothesised underlying mechanisms 110
1.2.1 Methodological issues 111
2 Research aims 112
2.1 Allostatic load 113
2.1.1 Measurement of allostatic load 113
3 Data and methods 114
3.1 Data 114
3.1.1 Analysis sample 115
3.2 Measures 116
3.2.1 Health measures 116
3.2.2 Fertility and parenthood history variables 118
3.2.3 Intermediate variables 118
3.2.4 Other co-variates 119
3.3 Analysis 120
3.3.1 Handling of missing data 121
4 Results 122
4.1 Descriptive results 122
4.2 Fertility history, allostatic load, and long-term illness: direct associations
125
4.3 Associations between fertility history and intermediate variables 128
4.4 Results from path models 130
5 Discussion 133
6 Acknowledgements 135
References 136
Pathways from fertility history to later life health:
Results from analyses of the English Longitudinal Study of Ageing
Emily Grundy1
Sanna Read2
Abstract
BACKGROUND
Previous research shows associations between fertility histories and later life health. The childless, those with large families, and those with a young age at entry to parenthood generally have higher mortality and worse health than parents of two or three children. These associations are hypothesised to reflect a range of biosocial influences, but underlying mechanisms are poorly understood.
OBJECTIVES
To identify pathways from fertility histories to later life health by examining mediation through health-related behaviours, social support and strain, and wealth. Additionally to examine mediation through allostatic load – an indicator of multisystem physical dysregulation, hypothesised to be an outcome of chronic stress.
METHODS
Associations between fertility histories, mediators, and outcomes were analysed using path models. Data were drawn from the English Longitudinal Study of Ageing. Outcomes studied were a measure of allostatic load based on 9 biomarkers and self-reported long-term illness which limited activities.
RESULTS
Early parenthood (<20 for women, <23 for men) was positively associated with higher (worse) allostatic load and long-term illness. These associations were partly mediated through wealth, smoking, and physical activity. Wealth, smoking, physical activity, and social strain also mediated associations between larger family size, itself associated with early parenthood, and health outcomes. We found no significant associations between childlessness and allostatic load or long-term illness, except for an association
1 London School of Economics and Political Science, U.K. E-Mail: [email protected].
between childlessness and long-term illness among women in models adjusted only for age.
CONCLUSION
In England early parenthood and larger family size are associated with less wealth and poorer health behaviours and this accounts for much of the association with health. At least part of this operates through stress-related physiological dysfunction (allostatic load).
1. Introduction
1.1 Previous research
1.1.1 Number of children
Most studies of contemporary populations have found a U- or J-shaped association between number of children born (parity) and later life mortality and health among women, and, in a few studies, among men, with both nulliparity and high parity (four, five, or more children) being associated with increased risks relative to having two children (Doblhammer 2000; Alonzo 2002; Grundy and Tomassini 2005; Hurt et al. 2006; Jaffe et al. 2009). However, in Scandinavian populations, which have generous social supports for parents, there seems to be no, or a reduced, mortality ‘penalty’ for high parity (Hinkula et al. 2006; Grundy and Kravdal 2008, 2010), indicating the importance of contextual factors.
1.1.2 Age at parenthood
Studies of age at childbearing are consistent in showing poorer later health and higher mortality among women with an early entry to motherhood (Kalil and Kunz 2002; Grundy and Tomassini 2005; Mirowsky 2005; Henretta 2007; Henretta et al. 2008; Patel and Sen 2012; Pirkle et al. 2014), although some studies indicate a different association among Black women in the USA (Spence and Eberstein 2009). Later health disadvantages of early fatherhood have also been reported (Grundy and Tomassini 2006; Grundy and Kravdal 2008; Pudrovska and Carr 2009). Results on possible effects of having children at relatively old ages are mixed. Some studies suggest that late maternity or paternity is related to better later health (Snowdon et al. 1989; Yi and Vaupel 2004; Grundy and Tomassini 2005). However, other studies of US women have found no effect (Spence 2008) or have indicated poorer health among those having children at relatively mature ages (Alonzo 2002; Mirowsky 2002). Anlyses of mortality using Norwegian register data show an inverse association between later age at last birth and later mortality for all causes and for most specific causes of death, other than breast cancer in women (Grundy and Kravdal 2010).
1.2 Hypothesised underlying mechanisms
The hypothesised causal pathways that underlie associations between reproductive histories and later health are complex. Physiological changes associated with pregnancy, childbirth, and lactation have a number of effects on women’s risks of developing various specific conditions. Nulliparity and late childbearing are associated with higher risks of breast cancer (Kvale et al. 1994; Madigan et al. 1995; Grundy and Kravdal 2010). Higher parity is also protective against some other hormonally related cancers but appears to increase risks of diabetes, obesity, degenerative changes in arterial walls, and ischemic heart disease, although reasons for this are not fully understood and may include lifestyle changes associated with parenthood (Friedlander 1996; Lawlor et al. 2003; Bastian et al. 2005).
association between number of children and risks of death from alcohol-related causes for women and men (Grundy and Kravdal 2010).
Other suggested health benefits of parenthood are through role enhancement and increased social participation and social support. Parenthood may enhance community participation (Furstenberg 2005; Knoster and Eggebeen 2006; Offer and Schneider 2007) and in later life parents may be able to draw on social support from children, with its known health benefits (Zunzunegui et al. 2001; Antonucci, Ajrouch, and Janevic 2003; Barefoot et al. 2005; Krause 2007). Older childless people, particularly childless men, appear to have less social interaction overall than older parents and there is evidence that a larger number of children, and having a daughter, is associated with an increased chance of regular social contact and with receiving help if needed (Tomassini et al. 2004; Dykstra and Hagestad 2007; Grundy and Read 2012).
Potentially adverse effects of parenthood include the stresses of rearing children, the narrowing of opportunities for fulfilment in other roles and potential role overload, substantial economic costs, and, in the case of those becoming parents at young ages, possible disruption of educational and career trajectories (Joshi 2002; Moffit et al. 2002; Evenson and Simon 2005; Pudrovska and Carr 2009; Dariotis et al. 2011; Wolf et al. 2011). The extent and effect of these stresses may vary according to parenting trajectories and other circumstances, for example partnership status and financial resources. Additionally, not all life-style changes associated with parenthood are beneficial and parenthood and higher parity are associated with weight gain and obesity in American and some other populations (Umberson et al. 2011).
1.2.1 Methodological issues
mortality, as are marital biographies (Kravdal et al. 2012). In both cases these variables may theoretically operate as confounders, mediators, or moderators of associations between fertility histories and later life health - or indeed may be spuriously related because of both being associated with some other factor, such as childhood circumstances. Directions of associations may also be hard to disentangle; for example, educational level and timing of parenthood may be associated because in some cases early parenthood may disrupt education or because low educational attainment may lead to behavioural choices resulting in early parenthood. Similarly, pregnancy may either prompt or be consequent on marriage, and both timing and level of fertility may influence risks of subsequent marital breakdown (Koropeckyj-Cox, Pienta, and Brown 2007; Pudrovska and Carr 2009). Associations between late parenthood and subsequent health may also be influenced by selection, as those with poor health in mid-life may be less able or inclined to have a(nother) child (Snowdon et al. 1989; Yi and Vaupel 2004). The direction and magnitude of associations observed may also vary according to the outcome considered and the age at which it is observed. For example, earlier fertility and higher parity reduce women’s risks of breast cancer but may increase risks from cardiovascular disease. The former constitutes a greater proportion of all-cause mortality in late middle age than in the oldest age groups, so associations between parity and female mortality could plausibly vary by age group studied. Additionally, those in the oldest age groups represent a smaller and more selected proportion of relevant birth cohorts and survival to these more advanced ages may indicate greater resilience to any health-damaging effects of particular fertility histories, as well as to other risks.
2. Research aims
literature, we hypothesised that health-related behaviours would be most important in mediating associations between childlessness and later health and also, among parents, between early entry to parenthood and health. We hypothesised that all effects of fertility histories on health would be evident in associations with allostatic load and that these would mediate associations with later self-reported health limitation.
2.1 Allostatic load
Allostatic load has been conceptualised as multisystem physical dysregulation resulting from cumulative effects of responding to multiple stressors and operating through the functioning of several regulatory systems (McEwen and Stellar 1993; Todorova et al. 2013). In early life stress-responsive systems are initiated that produce hormones that maintain the soma through continual allostatic responses. Later in life, systems designed to mitigate stressors may weaken, leading to harmful dysregulation. Consequent wear and tear across multiple physiological systems is a significant contributor to overall health risk (Seeman et al. 1997, 2001). Such wear and tear is hypothesized to ensue, at least in part, from repeated exposure to life challenges, which may include social relational conflict or adversity (Seeman et al. 2002). A recent review of 2005−10 publications which examined relationships between allostatic load and risk factors, chronic diseases, morbidity, and mortality in samples of older people concluded that allostatic load captured aspects of physiological dysregulation and somatic decline and was predictive of health deterioration (Leahy and Crews 2012). Goldman and colleagues (2006), for example, found that allostatic load provided an early indicator of later poor health in a three-year study of the Taiwanese older population. Similarly, in a study of a US cohort, allostatic load level predicted frailty in a three-year follow-up among older people (Gruenewald et al. 2009).
2.1.1 Measurement of allostatic load
has generally been in the range of 9−14 (Seplaki et al. 2005; Juster, McEwen, and Lupien 2010). Comparisons of different composite measures of allostatic load have shown relatively small differences in how powerful they are for predicting health outcomes (Seplaki et al. 2005). Composite allostatic load scores are usually based on a simple count of the number of biomarkers for which the individual falls above (or below) relevant cut points. Thus, each point on the allostatic load measure indicates that the respondent’s value for that measure was not within the healthy range. Cut points can be based on clinical thresholds but, as there is no clear agreement about what these should be in different populations, it is more usual to base them on the distribution of the measure in the sample studied (Juster et al. 2010).
3. Data and methods
3.1 Data
We use data from waves 1-3 of the English Longitudinal Study of Ageing (ELSA), a nationally representative longitudinal study of the older population of England. The first wave of ELSA, conducted in 2002−2003, included men and women then aged 50 years or more from households which had participated in any one of the 1998, 1999, or 2001 rounds of the cross-sectional Health Survey for England (HSE). Response rates for the HSE were 69% in 1998, 70% in 1999, and 67% in 2001. This process led to the recruitment of 11,392 core members to the first wave of ELSA (response rate 67%). Comparisons with other sources, including the census, showed that the baseline ELSA survey was nationally representative (Marmot et al. 2003). The sample has been followed up at two-yearly intervals. 70% of those interviewed in wave 1 also participated in waves 2 (2004−5) and 3 (2006−7) (Banks et al. 2008). Certain core information has been collected in every ELSA wave. In alternate waves the survey includes a nurse visit when more detailed data, including physical measurements and blood samples, are gathered (de Oliviera et al. 2010). Wave 3 included a retrospective life course interview which collected information about childhood and adult life prior to joining the study.
survivorship and in female fertility for relevant birth cohorts for the whole population of England and Wales are illustrated in Table 1.
Table 1: Cohort indicators of survival to older ages (males and females) and of fertility (females), England and Wales, cohorts born 1917−1952 (aged 50−85 in 2002)
Sources: Office for National Statistics 2010-based National Population Projections lifetable template, Demographic Analysis Unit, 2011. (Crown Copyright)
National Statistics Cohort fertility England and Wales , Tables 2 and 3, 2011; (Crown Copyright) released 07 March 2013. http://www.ons.gov.uk/ons/publications/re-reference-tables.html?edition=tcm%3A77-263133
3.1.1 Analysis sample
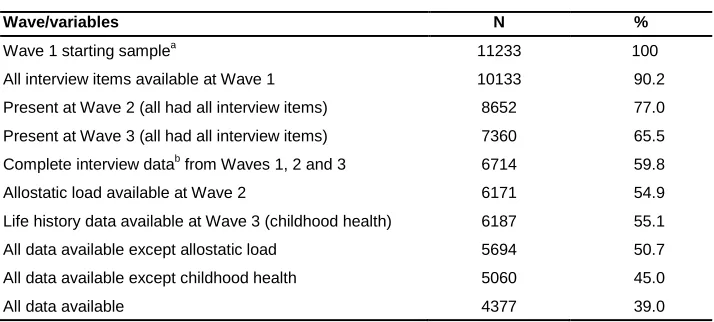
Our starting sample comprised the 11,233 core members who participated in wave 1 of ELSA and provided personal interviews (excluding those with proxy responses). All of these respondents provided information on age (and on number of children) and, as shown in Table 2, 90% had complete data for other wave 1 items used in the analysis. Measures used include those collected in waves 2 and 3 of the study and for these there was a more serious problem of missing data due to attrition from the study and failure to provide complete information or, more particularly, the blood samples and physical measurements required to derive the measure of allostatic load. Only 154 (1%) of the initial sample of respondents had died by wave 2; a further 350 (3%) died between waves 2 and 3. However, as shown in Table 2, interview items at wave 2 were available for only 8,651 of the initial sample (77%). Of these, 6,171 (71%) participated in the measurements needed to calculate allostatic load. By wave 3, 7,360 (66%) of the initial sample provided interview data but only 6,187 also completed the separate life history schedule. Strategies and methods used to deal with the problem of missing data are explained in section 3.3.
Cohort survival to age groups represented in ELSA
Completed fertility and proportions with births at ages <20, female cohorts represented in ELSA
Year of birth
% surviving to age:
Men Women Year of birth
% with birth <20
Distribution (%) by completed family size at age 45
0 1 2 3 4+
1917 85 15 30 1920 7 21 21 27 16 15
1922 80 30 47 1925 7 17 22 28 17 16
1927 75 47 61 1930 9 13 18 30 19 20
1932 70 62 73 1935 9 12 15 32 21 20
1937 65 74 81 1940 13 11 13 36 22 18
1942 60 82 87 1945 17 10 14 43 21 12
Table 2: Completeness of data for variables used in the analysis, ELSA waves 1−3
Wave/variables N %
Wave 1 starting samplea 11233 100
All interview items available at Wave 1 10133 90.2
Present at Wave 2 (all had all interview items) 8652 77.0
Present at Wave 3 (all had all interview items) 7360 65.5
Complete interview datab from Waves 1, 2 and 3 6714 59.8
Allostatic load available at Wave 2 6171 54.9
Life history data available at Wave 3 (childhood health) 6187 55.1
All data available except allostatic load 5694 50.7
All data available except childhood health 5060 45.0
All data available 4377 39.0
Note: a In-person interviewed sample core members.
b
Completedata from main interview schedule, i.e., not necessarily complete for the life history module.
3.2 Measures
3.2.1 Health measures
Two health measures were used, long-term illness that limited activities reported at wave 3 (0 = no limiting long-term illness; 1= has limiting long-term illness) and an indicator of allostatic load derived from biomarker data collected in the nurse visit at wave 2. Nine biomarkers were used to create the allostatic load score. These comprised waist to hip ratio, systolic and diastolic blood pressure, and lung function, all measured by nurses, and five indicators derived from blood samples. Details of how these were measured are outlined below and have also been reported elsewhere (Read and Grundy 2014).
Waist to hip ratio. Waist circumference was measured at the mid-point between the lower rib and the upper margin of the iliac crest and hip circumference was measured at maximal buttocks. The measures were taken twice, using the same tape, and recorded to the nearest even millimetre. The mean of the two valid measures was used. 74 individuals refused waist and hip measurement.
smoke, drink alcohol, or take vigorous exercise 30 minutes before the blood pressure measure was taken. Eleven individuals refused blood pressure measurement.
Lung function was measured using the Vitalograph Micro Spirometer. Three measures were taken of peak expiratory flow (the fastest rate of exhalation in litres per minute) with the highest used as the valid one. Seventy respondents declined to participate and, in accordance with study protocols, the lung function of a further 169 respondents was not measured because the respondent had had abdominal, tracheotomy, or chest surgery in the preceding three weeks, had been admitted to hospital with a heart complaint in the preceding six weeks, had had eye surgery in the preceding four weeks, or the room temperature was less than 15 or more than 35 degrees Celsius.
The remaining five biomarkers were derived from blood samples collected at wave 2: HDL/total cholesterol ratio (mg/dL) (index of risk for cardiovascular disease); triglycerides (index of lipid metabolism); glycosylated haemoglobin (HbA1c, %) (index of glucose metabolism over the previous 30−90 days); fibrinogen (index of inflammation and cardiovascular disease, mg/dL); and C-reactive protein (index of inflammation and cardiovascular disease, mg/dL). We were not able to include a measure of cortisol, often included in derivation of allostatic load, as although this was collected, data are not available for analysis. Blood samples were not taken from 596 people who failed to give written consent and a further 472 respondents who had a clotting or bleeding disorder, had ever had a fit, or were on anti-coagulant medication. Fasting blood samples were taken whenever possible, but those over age 80 and those who had medical conditions were not asked to fast. About 45% of the sample had fasted for at least 5 hours before the blood sample was taken. We controlled for possible variation in the measure due to variable fasting by deriving three binary variables (no fasting, respondent had fasted between 5 and 8 hours, and respondent has fasted for more than 8 hours before the blood sample was taken) which were included as co-variates in the models.
For all nine measures, individuals belonging to the highest 25 percentile indicating the health risk were identified from the sample distribution. A similar method of identifying risk quartiles has frequently been used in creating composite allostatic load scores (Juster, McEwen, and Lupien 2010; Seeman, Singer, Rowe, Horwitz, and McEwen 1997).
medication; and for peak expiratory flow if they used lung medication. The literature suggests that diabetic, cholesterol, and blood pressure-lowering medications reduce the values of C-reactive protein by 25%-30%, so those with values in the second highest 25 percentile were given the value of 1 on this indicator (Prasad 2006). Finally, use of an inhaler or puffer 24 hours prior to the nurse visit was also used as a covariate in the analysis, as this could influence peak expiratory flow.
A mean score for each of five subsystems (inflammation, cardiovascular, metabolic, body fat, and respiratory) was calculated on the basis of the number of biomarkers where the individual belonged to the risk group. This was done to weight the score by the number of biomarkers in the five systems. The weighted score was rounded to the nearest tenth so it could be used as an ordered categorical variable. Because of a very low number of values over 0.8, the highest category included all values between 0.8 and 1.0. Information on at least 5 out of 9 biomarkers had to be available to calculate the score. The high-risk cut-offs (shown in the Appendix Table) were similar to those found in previous studies (Juster, McEwen, and Lupien 2010; Seeman et al. 1997).
3.2.2 Fertility and parenthood history variables
We derived five binary variables indicating whether respondents had had 0, 1, 2, 3, or 4+ natural living children and further dichotomous variables indicating whether they had any adopted or step-children. For parents, additional dichotomous variables were derived indicating whether or not respondents had ever experienced the death of a natural child, had had a biological child before the age of 20 (women) or 23 (men), or after age 34 (women) or 39 (men). These cut points were chosen on the basis of the relevant previous literature and the distribution observed in the sample (Hobcraft 2008; Read, Grundy, and Wolf 2011). All measures were derived from wave 1, except the item on experience of death of a child, which was obtained from the wave 3 life-history interview.
3.2.3 Intermediate variables
The hypothesised mediators investigated were wealth, social support and social strain, and health-related behaviours, all derived from information collected in wave 1.
investments) and estimate the value of other assets including housing, cars, and valuables such as jewellery and antiques (Banks et al. 2008). The summed value of these, net of debts, was divided into quintiles and treated as a continuous variable in the analysis.
Health-related behaviour. We included measures of smoking and physical activity, both of which are strongly associated with health outcomes and are also hypothesised to be influenced by parenthood history. As these variables are used as mediators, we needed to be sure that they related to behaviours which followed rather than preceded fertility careers, and measures used related to current behaviours(at wave 1) rather than over the life course. The questions on smoking allowed identification of former as well as current smokers; however, in the modelling this was dichotomised (current smoker versus current non-smoker) because associations with health outcomes were similar for current and ex-smokers. Self-reported physical activity was used to create four categories: sedentary (no physical activity and, if working, in a sedentary job); low (mild physical activity at least once a week or if working in a job that was mostly standing); moderate (moderate physical activity at least once a week or if working in a job that involved physical work); and high (vigorous physical activity at least once a week or if working in a job that involved heavy manual labour). As the distribution of physical activity was approximately normal and the association with outcomes linear, this measure was treated as continuous in the analysis.
Social support and social strain. Mean scores of perceived social support and social strain from partner, children, relatives, and friends were derived from three questions asked about each. The social support questions were: ‘How much do they [partner, children, relatives, friends] really understand the way you feel about things?’ ‘How much can you rely on them if you have a serious problem?’ ‘How much can you open up to them if you need to talk about your worries?’ The indicator of social strain was based on responses to the questions: ‘How much do they criticise you?’ ‘How much do they let you down when you are counting on them?’ ‘How much do they get on your nerves?’ The mean was calculated using the items that were available. The internal consistency of the scales for both social support and strain was good (Cronbach’s alpha=0.87). People reporting having no partner, children, relatives, or friends (n = 10 in wave 1) were given a missing value.
3.2.4 Other co-variates
included a measure of age squared to test for a non-linear association between age and the health outcomes. However, this was not associated with either outcome and so was not included in the models presented here.
In the cohorts included in this analysis most people left school at the statutory minimum age (14 or 15 from 1947 to 1972) and proportions with advanced secondary or tertiary education were very low. We therefore dichotomised the education variable distinguishing respondents with any formal qualification from those with no qualifications; as there were minimal changes in this over time we used education as reported in wave 1. Marital status was dichotomised (married versus non-married) due to small numbers in some sub-groups. In addition, a variable indicating if the respondent had experienced marital termination by wave 1 (at that point remarried, separated, divorced, or widowed) was included. For parents we included a variable indicating whether or not they were co-resident with a child, as co-residence is associated with both fertility characteristics and with reported stress (Read and Grundy 2010). Both marital status and co-residence with children were included as time-varying co-variates.
We included an indicator of health in childhood, as previous studies have shown this to be associated with fertility histories and with later life health. This was derived from retrospective information collected in the wave 3 interview. Those reporting missing school, being in hospital or confined to bed for more than a month due to illness, or that poor health had restricted physical activities for more than three months in childhood were coded as having had a childhood health problem.
3.3 Analysis
whether associations between fertility history variables and outcomes were mediated by the intermediate variables, and whether allostatic load at wave 2 mediated associations with long-term illness at wave 3. In this step all intermediate factors and fertility history items were entered into the model simultaneously so results shown are fully adjusted. Full mediation was evident if the direct path between fertility history and health outcome ceased to be significant when the path through the mediator was added. All paths remaining significant suggested partial mediation. All models were fitted using maximum likelihood estimation with robust standard errors (MLR) in Mplus to take into account any non-normality in the sample.
3.3.1 Handling of missing data
hypothesized model and takes into account missingness in a single run. Maximum likelihood estimation in Mplus is available for a range of different types of variable, including continuous, binary, ordered categorical, and counts. As noted above, the assumption is that if all the variables that are responsible for the missing data-generating mechanism are included in the model, then this can be ignored and parameter estimates robustly computed for participants with missing data.
Full maximum likelihood Mplus can model covariate, mediator, and outcome missingness if the variables that are correlated with missingness and/or include missingness are brought into the model (i.e., they are dependent variables). To bring into the model all covariates, age (a variable with complete data) was used as a predictor for all variables. In order to compare the full maximum likelihood strategy with case deletion we also estimated models for the complete case sample (shown in Figures) and for samples restricted to those with complete information on allostatic load or complete information on childhood health (not shown).
4. Results
4.1 Descriptive results
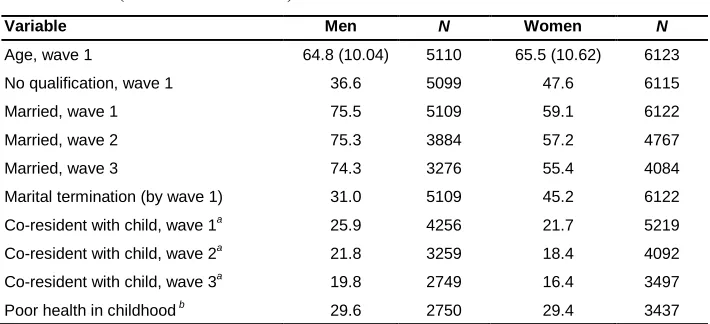
Table 3: Distribution of the sample by demographic and life history variables (% or mean and SD)
Variable Men N Women N
Age, wave 1 64.8 (10.04) 5110 65.5 (10.62) 6123
No qualification, wave 1 36.6 5099 47.6 6115
Married, wave 1 75.5 5109 59.1 6122
Married, wave 2 75.3 3884 57.2 4767
Married, wave 3 74.3 3276 55.4 4084
Marital termination (by wave 1) 31.0 5109 45.2 6122
Co-resident with child, wave 1a 25.9 4256 21.7 5219
Co-resident with child, wave 2a 21.8 3259 18.4 4092
Co-resident with child, wave 3a 19.8 2749 16.4 3497
Poor health in childhood b 29.6 2750 29.4 3437
Note: a Only among parents; b Data collected in wave 3 life history interview.
Table 4: Distribution of the fertility history variables by age group (% or mean and SD)
Men aged Women aged
Fertility history 50-64 N 65-79 N 80+ N 50-64 N 65-79 N 80+ N
Number of natural children
2691 1949 470 3111 2275 737
0 17.7 15.3 17.7 12.5 16.0 20.8
1 14.0 15.2 23.8 14.4 14.9 25.1
2 41.9 36.3 31.5 42.4 33.9 30.4
3 17.1 18.6 15.0 20.5 20.0 13.4
4+ 9.3 14.6 12.1 10.2 15.2 10.3
Early parenthood a 19.3 2120 11.7 1536 5.6 357 15.1 2623 7.1 1831 5.3 550
Late parenthood a 10.9 2121 12.1 1534 20.2 357 10.4 2624 16.4 1831 23.8 551
Adopted child 2.0 2691 3.0 1949 3.0 470 1.4 3111 2.7 2275 2.2 737
Stepchild 11.3 2691 7.6 1949 6.0 470 9.8 3111 4.6 2275 2.3 737
Child died a,b
3.8 1303 7.7 888 8.2 122 4.7 1670 9.1 1082 18.9 201
Note: a
Only among biological parents, early: <20 for women, <23 for men; late <34 for women, <39 for men.
b
Data collected in wave 3 life history interview. N represents denominator of the percentage shown.
Table 5: Distribution of the sample by intermediate variables and health outcomes (% or mean and SD)
Variables Men N Women N
Intermediate variables
Wealth, wave 1 3.1 (1.43) 5076 3.0 (1.40) 6058
Physical activity, wave 1 2.0 (0.87) 5104 1.9 (0.88) 5583
Smoking, wave 1 5104 6115
Never smoked 26.0 43.6
Ex-smoker 56.6 38.3
Current smoker 17.5 18.1
Perceived social support, wave 1 4.3 (0.53) 4661 4.3 (0.51) 5583
Perceived social strain, wave 1 2.7 (0.45) 4655 2.6 (0.46) 5570
Health outcomes
Allostatic load weighted mean score, wave 2 2835 3336
<0.1 17.1 16.9
0.1 14.5 15.6
0.2 19.2 18.9
0.3 15.0 15.5
0.4 12.5 11.7
0.5 10.3 9.4
0.6 5.0 5.7
0.7 3.6 4.3
0.8-1.0 2.7 1.9
Limiting long-term illness, wave 3 33.6 3274 37.9 4080
4.2 Fertility history, allostatic load, and long-term illness: direct associations
Table 6a: Coefficents from maximum likelihood regression models of associations between fertility history and health outcomes in men (n = 5110)
Allostatic load, Wave 2 Limiting long-term illness, Wave 3
Model 1 Model 2 Model 1 Model 2 All men Fathers All men Fathers All men Fathers All men Fathers
Number of children (ref = 2)
0 0.16 - 0.05 - 0.11 - 0.09 -
1 0.14 0.16 0.09 0.10 0.28* 0.29* 0.26* 0.27*
3 -0.03 -0.06 -0.05 -0.07 0.07 0.03 0.05 0.01
4 0.46*** 0.33* 0.37** 0.26* 0.37** 0.22 0.30* 0.18
1st birth at <23 a - 0.48*** - 0.36** - 0.29* - 0.19
Last birth at age >39 a - 0.16 - 0.11 - 0.38** - 0.36**
Has adopted child 0.12 -0.03 0.16 -0.01 -0.22 -0.31 -0.21 -0.29
Has stepchild -0.11 0.01 -0.19 -0.06 0.29* 0.27 0.18 0.20
Had child who died a
- 0.21 - 0.20 - 0.31 - 0.28
Age 0.02*** 0.02*** 0.01* 0.01* 0.03*** 0.03*** 0.02*** 0.03***
Poor childhood health - - 0.07 0.00 - - 0.28*** 0.33***
No educational qualification - - 0.58*** 0.56*** - - 0.46*** 0.45***
Currently married - - -0.26** -0.32** - - 0.03 -0.03
Marital termination - - 0.16 0.10 - - 0.21* 0.14
Co-resident with childa
- - - 0.10 - - - 0.00
Note: a
Table 6b: Coefficents from maximum likelihood regression models of
associations between fertility history and health outcomes in women (n = 6123)
Allostatic load, Wave 2 Limiting long-term illness, Wave 3
Model 1 Model 2 Model 1 Model 2
Number of children (ref = 2) All women Mothers All women Mothers All women Mothers All women Mothers
0 0.06 - 0.01 - 0.25* - 0.17 -
1 -0.00 0.00 -0.09 -0.07 0.17 0.17 0.08 0.09
3 0.17* 0.14 0.11 0.09 0.09 0.06 0.04 0.03
4 0.40*** 0.32** 0.32** 0.26* 0.40*** 0.31** 0.31** 0.24*
1st birth at <20 a
- 0.51*** - 0.42*** - 0.59*** - 0.49***
Last birth at age >34 a
- -0.13 - -0.13 - -0.28* - -0.25*
Has adopted child -0.21 0.08 0.23 0.12 0.06 0.52 0.08 0.50
Has stepchild 0.01 -0.08 -0.04 -0.15 -0.05 -0.05 -0.01 -0.03
Had child who died a
- 0.17 - 0.14 - 0.22 - 0.17
Age 0.02*** 0.03*** 0.01*** 0.02*** 0.04*** 0.04*** 0.03*** 0.03***
Poor childhood health - - 0.01 0.14 - - 0.41*** 0.37***
No educational qualification - - 0.44*** 0.39*** - - 0.34*** 0.30***
Currently married - - -0.16 -0.11 - - -0.33*** -0.30**
Marital termination - - 0.17* 0.18 - - 0.08 0.10
Co-resident with childa
- - - 0.09 - - - 0.04
Note: a Among mothers (with biological children). *P<.05; **P<.01; ***P<.001. Source: Analysis of data from ELSA, waves 1−3.
Results for women (Table 6b) were broadly similar, although being currently married was associated with limiting long-term illness, and not with allostatic load. Further differences between results for women and men were that the association between late motherhood and long-term illness was negative rather than positive. Childlessness was associated with long-term illness in Model 1, but this ceased to be significant when socio-demographic and life history factors were controlled. Early motherhood was positively associated with both allostatic load and long-term illness in all models.
4.3 Associations between fertility history and intermediate variables
Results from models adjusted for age, education, being currently married, experience of marital disruption, and co-residence with a child (Tables 7a and 7b) showed that fertility histories were associated with the hypothesised mediating variables. Men with four or more children had less wealth, were less physically active, and were more likely to be smokers and report more social strain than fathers of two children; childless men also reported less physical activity than the reference group. Having become a father by age 23 was associated with lower wealth and poorer health-related behaviours. Men experiencing fatherhood after age 39 had less wealth and reported lower physical activity and more social strain. Having had a child who had died was negatively associated with wealth.
Table 7a: Coefficents from maximum likelihood regression models of associations between fertility history and wealth, health-related behaviours and social support in men (n = 5110)
Wealth Physical activity Current smoking Perceived social support
Perceived social strain
All men Fathers All men Fathers All men Fathers All men Fathers All men Fathers
N of children (ref = 2)
0 0.03 - -0.13*** - 0.17 - -0.05 - -0.01 -
1 -0.03 -0.05 -0.05 -0.05 0.09 0.10 -0.02 -0.02 0.01 0.01
3 -0.16** -0.12* -0.01 0.01 0.23* 0.22 -0.03 -0.03 0.02 0.01
4 -0.60*** -0.47*** -0.14** -0.08 0.55*** 0.51*** -0.01 -0.01 0.05* 0.03
1st birth at <23 - -0.24*** - -0.13** - 0.32** - 0.01 - 0.01
Last birth at age >39 - -0.30*** - -0.11* - 0.20 - -0.03 - 0.06*
Has adopted child -0.00 0.09 0.16* 0.10 0.07 -0.26 0.03 -0.02 -0.01 -0.03
Has stepchild -0.11 -0.11 0.07 0.08 0.22 0.27 -0.05 -0.03 -0.01 0.01
Had child who died - -0.28* - -0.10 - 0.39 - -0.06 - 0.01
Note: Models adjusted for age, education, being married, marital termination, and co-residence with child (for fathers). *P<.05; **P<.01; ***P<.001.
Source: Analysis of data from ELSA wave 1.
Table 7b: Coefficents from maximum likelihood regression models of associations between fertility history and wealth, health-related behaviours and social support in women (n = 6123) at wave 1
Wealth Physical activity Current smoking Perceived social support
Perceived social strain
All women
Mothers All women
Mothers All women
Mothers All women
Mothers All women
Mothers
N of children (ref = 2)
0 0.22*** - -0.07* - 0.20 - -0.02 - 0.04 -
1 0.01 -0.01 -0.07* -0.08* 0.20 0.22* 0.02 0.02 0.02 0.02
3 -0.13** -0.09* 0.01 0.02 0.28** 0.27** -0.03 -0.02 0.01 -0.00
4 -0.55*** -0.43*** -0.16*** -0.11** 0.38** 0.34*** -0.07*** -0.04 0.10*** 0.09***
1st birth at <20 - -0.48*** - -0.23*** - 0.33** - -0.07* - 0.03
Last birth at age >34 - -0.03 - 0.05 - -0.19 - -0.03 - 0.04
Has adopted child -0.18 -0.02 0.07 0.08 0.31 -0.12 -0.03 -0.05 0.03 0.04
Has stepchild 0.06 0.04 -0.03 -0.04 0.04 0.06 0.02 -0.01 0.02 0.05
Had child who died - -0.06 - -0.04 - 0.17 - -0.04 - 0.06
Note: Models adjusted for age, education, being married, marital termination, and co-residence with child (for mothers). *P<.05; **P<.01; ***P<.001.
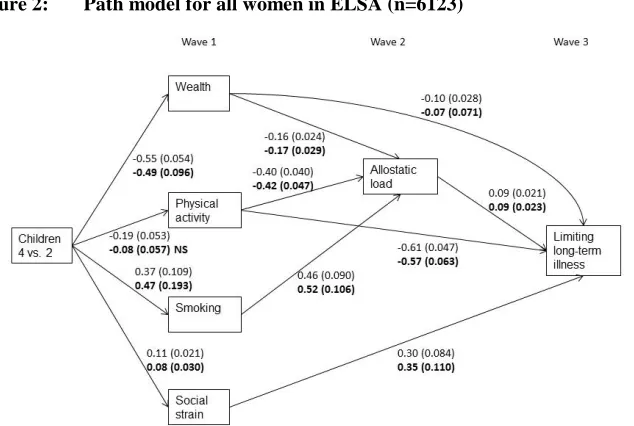
4.4 Results from path models
In the final stage of analysis we estimated path models to examine mediation from fertility history through the intermediate variables to outcomes and from allostatic load to long-term illness. The models presented include results for all fertility and parenting variables which were significantly associated, directly or indirectly, with either or both outcomes (allostatic load and long-term illness). For comparison, we also show in the figures estimates from models restricted to the complete case sample. Compared to using all available information, the models restricted to complete cases provided very similar path estimates for the health outcomes, but underestimated some of the associations between fertility history and some intermediate variables.
Figure 1: Path model for all men in ELSA (n=5110)
In bold estimates for complete cases (n=1996). Model adjusted for age, education, being married, marital disruption, and childhood health. Significant paths are shown (unstandardized estimate and standard error)
Figure 2: Path model for all women in ELSA (n=6123)
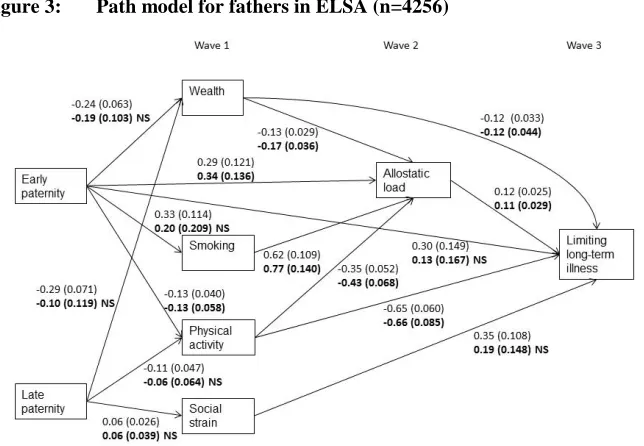
Results from models restricted to biological parents are shown in Figures 3 and 4. Associations between early fatherhood and both allostatic load and health limitation were mediated through smoking, wealth, and physical activity, although significant direct associations with both allostatic load and long-term illness remained. Allostatic load mediated influences on long-term illness, although there were also direct effects of physical activity and wealth on this outcome. Associations between late fatherhood and long-term illness were mediated via wealth, physical activity, and social strain. In mothers, as for fathers, there was a direct association between early parenthood and allostatic load, but otherwise associations were mediated through wealth, physical activity, and smoking (Figure 4). Physical activity and wealth had direct associations with health limitation, as well as associations mediated by allostatic load. Late motherhood had a direct negative association with limiting long-term illness. All associations were in the expected direction.
Figure 3: Path model for fathers in ELSA (n=4256)
Figure 4: Path model for fathers in ELSA (n=5219)
In bold estimates for complete data (n=1919). Model adjusted for age, education, being married, marital disruption and childhood health. Significant paths are shown (unstandardized estimate and standard error)
5. Discussion
larger family size and health outcomes in models including the childless. However, analyses restricted to those with biological children showed that early parenthood – but not number of children ‒ was associated with poorer health behaviours (as hypothesised). These findings together indicate that in the population studied it is early parenthood (associated with larger eventual family size) which seems most important in terms of later health: however this merits further investigation.
Although we found evidence of negative effects of social strain – which was associated with early parenthood and with large family size ‒ we failed to find beneficial effects of perceived social support. This may be related to the measure we used and the fact that the data on intermediate factors was drawn from wave 1 of the study, and we have no information on social support, strain, and health-related behaviours at earlier stages of the life course, including the main childrearing years.
We controlled to some extent for health-related selection into particular parenting pathways by including a variable indicating childhood health problems. Although this represents an advance over some previous studies which have not been able to consider any childhood factors, these data were collected retrospectively and reporting may have been influenced by current health status. This possibility is suggested by the fact that reported childhood illness was significantly associated with health limitation in wave 3 (when the retrospective data was collected) but not with allostatic load, which was based on data collected at wave 2 not subject to reporting bias.
some of the observed data) may lead to underestimation of associations. When restricting analysis to compete cases only, the variance tends to get smaller due to selection, which can cause bias and less robust estimation.
It should be recognised that characteristics of the sample we consider may reflect prior differential mortality related to fertility history. The apparent slight under-representation of those who had become parents at young ages and had large family sizes, for example, might reflect reduced chances of survival to later ages for these groups. This would mean that the influence of these factors on health estimated here might be lower than would be observed in a cohort which was followed throughout its whole post-reproductive period.
Despite these limitations, this paper adds to our understanding of the processes linking parenthood trajectories, biological processes, and health in later life. Further comparative work using data from other populations and time periods is merited, as effects may be different in other populations where social selection into early parenthood and larger family size, as well as stresses experienced by parents of larger families, may be different.
6. Acknowledgements
References
Acock, A.C. (2005). Working with missing values. Journal of Marriage and Family 67: 1012−1028. doi:10.1111/j.1741-3737.2005.00191.x.
Aiken, A.R., Angel J.L., and Miles, T.P. (2012). Pregnancy as a risk factor for ambulatory limitation in later life. Am J Public Health 102(12): 2330−2335.
doi:10.2105/AJPH.2012.300791.
Alonzo, A.A.( 2002). Long-term health consequences of delayed childbirth: Nhanes III.
Womens Health Issues 12: 37−45. doi:10.1016/S1049-3867(01)00135-9.
Antonucci, T.C., Ajrouch, K.J., and Janevic, M.R. (2003). The effect of social relations with children on the education-health link in men and women aged 40 and over.
Social Science & Medicine 56(5): 949−960. doi:10.1016/S0277-9536(02) 00099-0.
Barefoot, J.C., Grønbæk, M., Jensen, G., Schnohr, P., and Prescott, E. (2005). Social network diversity and risks of ischemic heart disease and total mortality: findings from the Copenhagen City Heart Study. American Journal of Epidemiology 161: 960−967. doi:10.1093/aje/kwi128.
Banks, J., Breeze, E., Lessof, C., and Nazroo, J. (2008). Living in the 21st Century: Older People in England: The 2006 English Longitudinal Study of Ageing. London: The Institute of Fiscal Studies.
Bastian, L.A., West, N.A., Corcoranm, C., Munger, R.G., and Memory Cache County Study (2005). Number of children and the risk of obesity in older women.
Preventive Medicine 40: 99−104. doi:10.1016/j.ypmed.2004.05.007.
Dariotis, J.K., Pleck, J.H., Astone, N.M., and Sonenstein, F.L. (2011). Pathways of early fatherhood, marriage, and employment: a latent class growth analysis.
Demography 48(2): 593−623. doi:10.1007/s13524-011-0022-7.
de Oliveira, C., Shankar, A., Kumari, M., Nunn, S., and Steptoe, A. (2010). Health risk and health protective biological measures in later life. In: Banks, J., Lessof, C., Nazroo, J., Rogers, N., Stafford, M. and Steptoe, A. (eds.). Financial Circumstances, Health and Well-Being of the Older Population in England: The 2008 English Longitudinal Study of Ageing. London: The Institute of Fiscal Studies: 275−347.
Doblhammer, G. (2000). Reproductive history and mortality later in life: a comparative study of England and Wales and Austria. Population Studies 54(2): 169−176.
Dykstra, P. and Hagestad, G. (2007). Childlessness and parenthood in two centuries: different roads ‒ different maps? Journal of Family Issues 28: 1518−1532.
doi:10.1177/0192513X07303881.
Enders, C.K. (2010). Applied missing data analysis. New York: Guildford.
Enders, C.K. and Bandalos, D.L. (2001). The relative performance of full information maximum likelihood estimation for missing data in structural equation models.
Structural Equation Modeling: A Multidisciplinary Journal 8: 430−457.
doi:10.1207/S15328007SEM0803_5.
Evenson, R.J. and Simon, R.W. (2005). Clarifying the relationship between parenthood and depression. Journal of Health and Social Behavior 46: 341−358.
doi:10.1177/002214650504600403.
Friedlander, N.J. (1996). The relation of lifetime reproduction to survivorship in women and men: A prospective study. American Journal of Human Biology 8: 771−783.
doi:10.1002/(SICI)1520-6300(1996)8:6<771::AID-AJHB9>3.3.CO;2-C.
Furstenberg, F.F. (2005). Banking on families: How families generate and distribute social capital. Journal of Marriage and Family 67(4): 809−821. doi:10.1111/j.1 741-3737.2005.00177.x.
Goldman, N., Turra, C.M., Glei, D.A., Lin, Y.H., and Weinstein, M. (2006). Physiological dysregulation and changes in health in an older population. Exp Gerontol 41: 862−870. doi:10.1016/j.exger.2006.06.050.
Graham, J.W. (2009). Missing data analysis: making it work in the real world. Annual Review of Psychology 60: 549−476. doi:10.1146/annurev.psych.58.110405.08 5530.
Graham, J.W. (2012). Missing data: analysis and design. New York: Springer.
doi:10.1007/978-1-4614-4018-5.
Gruenewald, T.L., Seeman, T.E., Karlamangla, A.S., and Sarkisian, C.A. (2009). Allostatic load and frailty in older adults. Journal of the American Geriatrics Society 57: 1525−1531. doi:10.1111/j.1532-5415.2009.02389.x.
Grundy, E. and Holt G. (2000). Adult life experiences and health in early old age in Great Britain. Social Science & Medicine 51: 1061−1074. doi:10.1016/S0277-9536(00)00023-X.
Grundy, E. and Kravdal, O. (2008). Reproductive history and mortality in late middle age among Norwegian men and women. American Journal of Epidemiology
Grundy, E. and Kravdal, Ø. (2010). Fertility history and cause-specific mortality: a register-based analysis of complete cohorts of Norwegian women and men.
Social Science & Medicine 70: 1847−1857. doi:10.1016/j.socscimed.2010. 02.004.
Grundy, E. and Read, S. (2012). Social contacts and receipt of help among older people in England: are there benefits from having more children? Journal of Gerontology: Social Sciences 67(6): 742−754. doi:10.1093/geronb/gbs082. Grundy, E. and Tomassini, C.(2005). Fertility history and health in later life: a record
linkage study in England and Wales. Social Science & Medicine 61: 217−228.
doi:10.1016/j.socscimed.2004.11.046.
Grundy, E. and Tomassini, C. (2006). Fatherhood history and later life health and mortality in England and Wales: a record linkage study. Social Biology 53(3−4): 189−205.doi: 10.1080/19485565.2006.9989126.
Guralnik, J.M., Butterworth, S., Patel, K., Mishra, G., and Kuh, D. (2009). Reduced midlife physical functioning among never married and childless men: Evidence from the 1946 British Birth Cohort Study. Aging Clinical and Experimental Research 21: 174−181. doi:10.1007/BF03325226.
Hank, K. (2010). Childbearing history, later-life health, and mortality in Germany.
Population Studies 64(3): 275−291. doi:10.1080/00324728.2010.506243. He, Y. (2010). Missing data analysis using multiple imputation: Getting to the heart of
the matter. Circulation: Cardiovascular Quality and Outcomes 3: 98−105.
doi:10.1161/CIRCOUTCOMES.109.875658.
Henretta, J.C. (2007). Early childbearing, marital status, and women's health and mortality after age 50. Journal of Health and Social Behavior 48: 254−266.
doi:10.1177/002214650704800304.
Henretta, J.C., Grundy, E.M.D., Okell, L.C., and Wadsworth, M.E.J. (2008). Early motherhood and mental health in midlife: A study of British and American cohorts. Aging & Mental Health 12: 605−614. doi:10.1080/1360786080 2343084.
Hobcraft, J. (2008). The timing and partnership context of becoming a parent: Cohort and gender commonalities and differences in childhood antecedents.
Demographic Research 19: 1281−1322. doi:10.4054/DemRes.2008.19.34. Hobcraft, J. and Kiernan, J.E. (2001). Childhood poverty, early motherhood and adult
social exclusion. British Journal of Sociology 52(3): 495−517. doi:10.1080/0007 1310120071151.
Hurt, L.S., Ronsmans, C., and Thomas, S.L. (2006). The effect of number of births on women’s mortality: Systematic review of evidence for women who have completed their childbearing. Population Studies 60(1): 55−71. doi:10.1080/ 00324720500436011.
Jaffe, D.H., Neumark, Y.D., Eisenbach, Z., and Manor, O. (2009). Parity-related mortality: Shape of association among middle-aged and elderly men and women.
European Journal of Epidemiology 24: 9−16. doi:10.1007/s10654-008-9310-y. Joshi, H. (2002). Production, reproduction and education: women, children and work.
Population and Development Review 28: 445−474. doi:10.1111/j.1728-4457. 2002.00445.x.
Juster, R.P., McEwen, B.S., and Lupien, S.J. (2010). Allostatic load biomarkers of chronic stress and impact on health and cognition. Neuroscience and Biobehavavioral Reviews 35: 2−16. doi:10.1016/j.neubiorev.2009.10.002.
Kalil, A., and Kunz J. (2002). Teenage childbearing, marital status, and depressive symptoms in later life. Child Development 73: 1748−1760. doi:10.1111/1467-8624.00503.
Karlamangla, A.S., Singer, B.H., McEwen, B.S., Rowe, J.W., and Seeman, T.E. (2002). Allostatic load as a predictor of functional decline Macarthur studies of successful aging. Journal of Clinical Epidemiology 55: 696−710. doi:10.1016/ S0895-4356(02)00399-2.
Kendig, H., Dykstra, P.A., van Gaalen, R.I., and Melkas, T. (2007). Health of aging parents and childless individuals. Journal of Family Issues 28: 1457−1486.
doi:10.1177/0192513X07303896.
Kiernan, K. (1989). Who remains childless? Journal of Biosocial Science 21: 387−398.
Kington, R., Lillard, L., and Rogowski, J.J. (1997). Reproductive history, socioeconomic status, and self-reported health status of women aged 50 years and older. American Journal of Public Health 87: 33−37. doi:10.2105/AJPH. 87.1.33.
Knoester, C. and Eggebeen, D.J. (2006). The effects of the transition to parenthood and subsequent children on men’s well-being and social participation. Journal of Family Issues 27: 1532−1560. doi:10.1177/0192513X06290802.
Koropeckyj-Cox, T., Pienta, A.M., and Brown, T.H. (2007). Women of the 1950s and the “normative” life course: the implications of childlessness, fertility timing, and marital status for psychological well-being in late midlife. International Journal of Aging & Human Development 64(4): 299–330.
Krause, N. (2007). Longitudinal study of social support and meaning in life.
Psychology and Aging 22: 456−469. doi:10.1037/0882-7974.22.3.456.
Kravdal, Ø., Grundy, E., Lyngstad, T.H., and Wiik, K.A. (2012). Family life history and late mid-life mortality in Norway. Population and Development Review 38: 237−257. doi:10.1111/j.1728-4457.2012.00491.x.
Kvale, G., Heuch, I., and Nilssen S .(1994). Parity in relation to mortality and cancer incidence: A prospective-study of Norwegian women. International Journal of Epidemiology 23: 691−699. doi:10.1093/ije/23.4.691.
Lawlor, D.A., Emberson, J.R., Ebrahim, S., Whincup, P.H., Wannamethee, S.G., Walker, M., and Smith, G.D. (2003). Is the association between parity and coronary heart disease due to biological effects of pregnancy or adverse lifestyle risk factors associated with childrearing? Circulation 107(9): 1260−1264.
doi:10.1161/01.CIR.0000053441.43495.1A.
Leahy, R. and Crews, D.E. (2012). Physiological dysregulation and somatic decline among elders: Modeling, applying and re-interpreting allostatic load. Collegium Antropologicum 36: 11−22.
Little, T.D., Jorgensen, T.D., Lang, K.M., and Moore, W.G. (2013). On the joys of missing data. Journal of Paediatric Psychology 23: 1−12. doi:10.1093/jpepsy/ jst048.
Madigan, M.P., Ziegler, R.G., Benichou, J., Byrne, C., and Hoover, R.N. (1995). Proportion of breast cancer cases in the United States explained by well-established risk factors. Journal of the National Cancer Institute 87(22): 1681−1685. doi:10.1093/jnci/87.22.1681.
Marmot, M., Banks, J., Blundell, R., Lessof , C., and Nazroo, J. (2003). Health, Wealth and Lifestyles of the Older Population in England: The 2002 English Longitudinal Study of Ageing. London: The Institute of Fiscal Studies.
McEwen, B.S. and Stellar, E. (1993). Stress and the individual ‒ mechanisms leading to disease. Archives of Internal Medicine 153: 2093−2101. doi:10.1001/archinte. 153.18.2093.
McEwen, B.S. and Wingfield, J.C. (2003). The concept of allostasis in biology and biomedicine. Hormones and Behavior 43: 2−15. doi:10.1016/S0018-506X(02) 00024-7.
Mirowsky, J. (2002). Parenthood and health: The pivotal and optimal age at first birth.
Social Forces 81: 315−349. doi:10.1353/sof.2002.0055.
Mirowsky, J. (2005). Age at first birth, health, and mortality. Journal of Health and Social Behavior 46: 32−50. doi:10.1177/002214650504600104.
Moen, P., Dempster-McClain, D., and Williams, R.W.Jr. (1992). Successful aging: a life-course perspective on women’s multiple roles and health. American Journal of Sociology 97: 1612−1638. doi:10.1086/229941.
Moffitt, T.E. and E-Risk Study Team (2002). Teen-aged mothers in contemporary Britain. Journal of Child Psychology and Psychiatry 43: 727−742. doi:10.1111/ 1469-7610.00082.
Mollborn, S. and Morningstar, E. (2009). Investigating the relationship between teenage childbearing and psychological distress using longitudinal evidence. Journal of Health and Social Behavior 50: 310−326. doi:10.1177/002214650905000305. Muthén, L.K. and Muthén, B.O. (2007). Mplus User’s Guide. Los Angeles, CA:
Muthén & Muthén.
Offer, S. and Schneider, B. (2007). Children’s role in generating social capital. Social Forces 85(3): 1125−1142. doi:10.1353/sof.2007.0049.
Patel, P. and Sen, B. (2012). Teen motherhood and long-term health consequences.
Pigott, T.D. (2001). A review of methods for missing data. Educational Research and Evaluation 7: 353−383. doi:10.1076/edre.7.4.353.8937.
Pirkle, C.M., de Albuquerque, S.A.C., Alvarado, B., and Zunzunegui, M.V. (2014). Early maternal age is associated with chronic diseases and poor physical performance in older age: cross-sectional analysis from the International Mobility in Aging Study. BMC Public Health 14: 293. doi:10.1186/1471-2458-14-293.
Prasad, K. (2006). C-Reactive Protein (Crp)-lowering agents. Cardiovascular Drug Reviews 24: 33−50. doi:10.1111/j.1527-3466.2006.00033.x.
Pudrovska, T. and Carr, D. (2009). Age at first birth and fathers’ subsequent health: Evidence from sibling and twin models. American Journal of Mens Health 3: 104−115. doi:10.1177/1557988307306424.
Read, S. and Grundy, E. (2011). Mental health among older married couples: the role of gender and family life. Social Psychiatry and Psychiatric Epidemiology
46(4): 331–341. doi:10.1007/s00127-010-0205-3.
Read, S., Grundy, E., and Wolf, D.A. (2011). Fertility history, health and health trajectories in later life: A study of older women and men in the British Household Panel Survey. Population Studies 65(2): 201−215. doi:10.1080/ 00324728.2011.572654.
Read, S. and Grundy, E. (2014). Allostatic load and health in the older population of England: a crossed-lagged analysis. Psychosomatic Medicine 76(7): 490−496. doi:10.1097/PSY.0000000000000083.
Sallmen, M., Sandler, D.P., Hoppin, J.A., Blair, A., and Baird, D.D. (2006). Reduced fertility among overweight and obese men. Epidemiology 17(5): 520−523.
doi:10.1097/01.ede.0000229953.76862.e5.
Scholes, S., Cox, K., and Lessof, C. (2008). Methodology. In: Banks, J., Breeze, E., Lessof, C., and Nazroo, J. (eds.). Living in the 21st Century: Older People in England: The 2006 English Longitudinal Study of Ageing. London: The Institute of Fiscal Studies: 281−303.
Seeman, T.E., McEwen, B.S., Rowe, J.W., and Singer, B.H. (2001). Allostatic load as a marker of cumulative biological risk: macarthur studies of successful aging.
Seeman, T.E., Singer, B.H., Rowe, J.W., Horwitz, R.I., and McEwen, B.S.(1997). Price of adaptation:allostatic load and its health consequences - Macarthur Studies of Successful Aging. Archives of Internal Medicine 157: 2259−2268. doi:10.1001/ archinte.157.19.2259.
Seeman, T.E, Singer, B.H., Ryff, C.D., Dienberg Love, G., and Levy-Storms, L. (2002). Social relationships, gender, and allostatic load across two age cohorts.
Psychosomatic Medicine 64: 395–406. doi:10.1097/00006842-200205000-00 004.
Seplaki, C.L., Goldman, N., Glei, D., and Weinstein, M. (2005). A comparative analysis of measurement approaches for physiological dysregulation in an older population. Experimental Gerontology 40: 438−449. doi:10.1016/j.exger.2005. 03.002.
Snowdon, D.A., Kane, R.L., Beeson, W.L., Burke, G.L., Sprafka, J.M., Potter, J., Iso, H., Jacobs, D.R.Jr., and Phillips, R.L. (1989). Is early natural menopause a biologic marker of health and aging? American Journal of Public Health 79: 709−714. doi:10.2105/AJPH.79.6.709.
Spence, N.J. (2008). The long-term consequences of childbearing physical and psychological well-being of mothers in later life. Research on Aging 30: 722−751. doi:10.1177/0164027508322575.
Spence, N.J and Eberstein, I.W. (2009). Age at first birth, parity, and post-reproductive mortality among white and black women in the US, 1982-2002. Social Science & Medicine 68: 1625−1632. doi:10.1016/j.socscimed.2009.02.018.
Todorova, I.L., Tucker, K.L., Jimenez, M.P., Lincoln, A.K., Arevalo, S. and Falcón, L.M. (2013). Determinants of self-rated health and the role of acculturation: implications for health inequalities. Ethnic Health 18(6): 563–585.
doi:10.1080/13557858.2013.771147.
Tomassini, C., Kalogirou, S., Grundy, E., Fokkema, T., Martikainen, P., Broese van Groenou, M. and Karisto, A. (2004). Contacts between elderly parents and their children in four European countries: current prospects and future patterns.
European Journal of Ageing 1: 54–63.
White, I.R and Carlin, J.B. (2010). Bias and efficency of multiple imputation compared with complete-case analysis for missing covariate values. Statistics in Medicine
Umberson, D., Crosnoe, R. and Reczek, C. (2010). Social relationships and health behaviors accross the life course. Annual Reviews Sociology 1(36): 139−157.
doi:10.1177/0022146510383501.
Umberson, D., Liu, H., Mirowsky, J., and Reczek, C. (2011). Parenthood and trajectories of change in body weight over the life-course. Social Science & Medicine 73: 1323−1331. doi:10.1016/j.socscimed.2011.08.014.
Van Buuren, S. (2012). Flexible imputation of missing data. Boca Raton, FL: CRC Press. doi:10.1201/b11826.
Wolf, D.A., Lee, R.D., Miller, T., Donehower, G., and Genet, A. (2011). Fiscal externalities of becoming a parent. Population and Development Review 37: 241−266. doi:10.1111/j.1728-4457.2011.00410.x.
Yi, Z. and Vaupel, J.W. (2004). Association of late childbearing with healthy longevity among the Oldest-Old in China. Population Studies ‒ a Journal of Demography
58: 37−53. doi:10.1080/0032472032000175437.
Appendix
Table 1: Allostatic load 25th percentile high-risk cut-off points for all men and women in ELSA in wave 2 (2002)
Men Women
Aged 51-65 Aged 65+ Aged 51-65 Aged 65+
Inflammation (N = 1008-1017) (N = 982-986) (N = 1219-1232) (N = 1190-1196)
C-reactive protein >2.9 >3.4 >3.4 >3.9
Fibrinogen >3.4 >3.7 >3.5 >3.8
Cardiovascular (N = 1074) (N = 1106) (N = 1319) (N = 1398)
Systolic blood pressure >143 >149 >140 >151
Diastolic blood pressure >85 >80 >83 >79
Lipid metabolism (N = 1001-1017) (N = 965-983) (N = 1219-1233) (N = 1187-1196)
HDL/Total cholesterol ratio >5.0 >4.6 >4.4 >4.5
Triglycerides >2.5 >2.2 >2.1 >2.1
Glycosylated haemoglobin >5.7 >5.9 >5.6 >5.8
Body fat (N = 1216) (N = 1231) (N = 1486) (N = 1527)
Waist/hip ratio >1.00 >1.00 >0.88 >0.89
Respiratory (N = 1197) (N = 1190) (N = 1415) (N = 1437)