Paper received: 20.2.2007 Paper accepted: 28.9.2007
Simulation Methods in Shipbuilding Process Design
Boris Ljubenkov1* - Goran Đukić1 - Marinko Kuzmanič2
'University o f Zagreb, Faculty o f Mechanical Engineering and Naval Architecture, Croatia 2ProMar Design, Kaštel Novi, Croatia
The paper aims at presenting the use o f simulation methods in shipbuilding production process design. The basic design procedure principle is described, the main elements o f the designing spiral, flow diagrams and interrelations between individual activities determined. The flow diagram indicates a point in which the simulation results affect the design flow.
A simulation program package was used to create a shipbuilding production process model. An example o f possibilities and methods o f presentation o f the program package outputs is given, and the advantages o f using simulation methods in the shipbuilding production process are described in a conclusion.
© 2008 Journal o f Mechanical Engineering. All rights reserved. Keywords: shipbuilding, process design, simulation methods
0 INTRODUCTION
The shipbuilding production is a complex and lengthy p ro cess, w hich dem ands careful p la n n in g and tim e ly d e c isio n -m a k in g . C h aracteristic o f an in term itten t process like shipbuilding is a large number o f working activities o f different duration. Thus, it is necessary to ensure work-in-process storage areas, which demand an adequate space and a ra th e r intensive use o f transport devices. Position o f machines, transport equipment and other devices within the process does not change. The major changes in the process are cau sed by d iv e rse p ro d u c tio n program s. Products o f different purpose and geometries pass through the same production process and incur different work-loads on workshops, equipment and work-in-process storage areas, which might cause interruptions in production [1].
Problems encountered in complex systems are efficiently resolved by sim ulation methods. Mathematical and statistical analyses do not play a major role in such systems, since they are not realistically described by mathematical equations. The literatu re does not offer an u nequivocal definition o f simulation. The term “sim ulation” w o u ld m ean im ita tio n , and the s im u la tio n procedure, according to one o f definitions, is a set o f activities ranging from real system modelling to experim enting w ith a m odel and analysis o f results [2], The simulation enables prediction o f step s ta k en in re a l p ro d u c tio n p ro c e ss and
recognition o f unfavourable situations, such as interruptions or bottlenecks in production. It is also possible to monitor the effects o f parameter changes on o v e ra ll p ro c e ss b efo re the p ro d u c tio n in workshop starts, when error corrections are much more difficult and expensive.
Papers about sim ulation m ethods in the shipbuilding are scarce. In those very few authors’ effort is to p resen t and encourage the use o f sim ulation m ethod as a tool for easier decision m ak in g in s h ip b u ild in g p ro d u c tio n p rocess. M edeiros et al. [3] and W illiam s et a l.[4] are presenting their work on systems for modeling and v is u a liz a tio n o f p ro d u c tio n p ro cess and the importance o f the internet as a communication tool. Kiran et al. [5] introduce hierarchical approach to m o d e lin g . O v e ra ll s im u la tio n m o d el o f the production process is divided in number o f smaller m o d els th a t are c re a te d sep arately . S m aller simulation models could be then controlled and analyzed easier. T heir approach also includes methods that integrate these sub-models into an overall model in order to run different scenaria and identify global performance measures.
Research o f McLean and Shao [6] presented overview o f the generic simulations o f shipbuilding operations. They are concerned to control and follow-up o f labour resources and costs in complex system like shipbuilding. Dain et al. [7] present stochastic sim ulation model for determ ination, follow-up and control o f costs, activity delay or labour resource shortage because they could cause
huge disturbance in production. Nedess et al. [8] emphasize, among other things, that due to the fact that required space is a resource for time-critical processes w ith restricted capacities on shipyards and o th er sh ip b u ild in g com panies. The space allocation has to be handled as one o f the most important tasks in production planning, and this aspect was implemented in the simulation module for space allocation within the Simulation Toolkit Shipbuilding (STS). They also highlight the need for special sim ulation m odules for shipbuilding industry. Steinhauer and M eyer-König [9] present importance o f simulation and STS in sub-assembly and assembly stage planning.
1 SHIPBUILDING PROCESS DESIGN
A shipbuilding process design consists o f e le m e n ts e ach o f w h ic h has its a p p ro p ria te req u irem en ts and lim itations. E lem ents o f the shipbuilding process design are production concept, p ro d u c t a n a ly s is , m a te ria l flo w s, b u ild in g dynamics, arrangement o f working areas, process flexibility, management, logistics, human resources and investment. Their interrelation is complex, and the ultimate solution is looked for in iteration o f several steps [10]. Each next iteration step brings new solutions for the design elements, which affect o th e r d e s ig n e le m e n ts. T he fin al re s u lt is a com prom ise design o f an overall shipbuilding process, which does not offer the best solution for each individual design element.
The shipbuilding process design procedure m ay be expanded by application o f sim ulation program packages for modelling, visualisation and e x p e rim e n tin g w ith a m o d el, w h ic h en ab les p red ictio n and avoiding o f adverse effects the param eter changes have in a complex production process such as shipbuilding.
W hen the data obtained by analyses o f product, production process and material flow are used, the simulation procedure enables creation o f p ro d u c tio n p ro c e ss and fin al p ro d u c t m odel. Perform ing a large num ber o f experim ents with m odels in a short p eriod o f tim e w ill create a considerable database for quality and inform ed decision-m aking on solutions for the production process.
F ig u re 1 sh o w s a b lo c k d iag ram w ith shipbuilding process design elem ents and their interdependence achieved by tw o-w ay relations.
Interdependence o f elements is complex, and their relations in the design stage are open in both ways until the final solution has been found.
S im u latio n in the ship b u ild in g process design consists o f a preparatory and executive process.
T he p re p a ra to ry p ro c e d u re in c lu d e s c a lc u la tio n o f n e c e ssa ry m o d el elem en t and creation o f the production process and final product models.
Executive part o f the simulation procedure starts with the experiment scenario, which defines a re se a rc h p u rp o se , in p u t d ata and a n aly ses parameters, such as the equipment efficiency or experiment duration. The procedure continues with experiment with a model and analysis o f output data, which results in conclusions. I f the conclusions have determined that the research were to continue with a new experiment, the procedure is repeated, i.e. the changes are made in product analysis, production process and material flow. These changes affect the production process and final product models, which initiate a new experiment. W hen all the options are researched and final conclusion brought, the results are presented to responsible management, which m akes decisions on all the shipbuilding design elements.
2 AN EXAMPLE OF SIMULATION METHOD USE IN SHIPBUILDING WORKSHOP PRODUCTION PROCESS M ANAGEMENT
The simulation method use in management o f production processes will be shown using an example o f situation analysis for a shipbuilding workshop [11]. The data obtained from the shipyard will be used to build a sim ulation model o f the ship b u ild in g w orkshop, define the p ro d u ctio n p ro g ra m and c a rry out c o m p u te r-su p p o rte d experiments. Analysis o f results o f an individual experiment and comparison o f results o f a larger number o f experiments creates a database facilitating quality decision-making on the production process changes. Taylor ED software is used for modelling, visualization and results analysis.
2.1 Simulation Program Package Taylor ED
S
im
u
la
ti
o
n
M
e
th
o
d
s
in
S
h
ip
b
u
ild
in
g
P
ro
c
e
ss
D
e
si
g
n
3 !
qq’
§3 "S' « g <*)
2
Ci& to &
ft
tof
ft
2 “ s Hi »o
£3-a
ft
s; g S' ^3
2
8
I-ut
UJ
S
tr
o
jn
iš
k
i
v
e
st
n
ik
-
Jo
u
rn
a
l
o
f M
e
c
h
a
n
ic
a
l
E
n
g
in
e
e
ri
n
g
5
4
(2
0
0
8
)2
,
process. In the program package whole production process and products o f the workshop are created. A basic element o f the simulation model is an atom. The atom represents single m achine, tool, and transport device, necessary areas like interim stores, semi-products and products o f the workshop. There are 80 defined and created atoms in the program package.
In the program package atoms are arranged on workshop layout. Their geometric characteristics and fu n ctio n s are defined, as w ell. R elations b etw een atom s are defined to d eterm in e task scheduling in the workshop. Connecting entry and exit channels o f atoms define the routing - the flow o f the products through production process in a simulation model. Function o f the atom is operation that has to be done. It could be set, for example, as duration o f machine operation or speed, load and unload time o f transport device.
2.2 Shipbuilding Workshop Simulation Model
The simulation program package models the production program with elements that represent equipm ent, devices and transport devices. Each
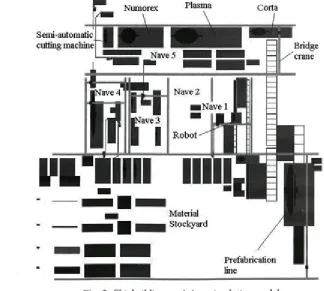
elem en t is d efin ed by its g eo m etry (sizes o f equipm ent and devices), position in space and operating characteristics (speed o f transport devices or fabrication duration on equipment). Figure 2 presents a model layout.
Cut lengths o f plates, profiles and bars are defined by their geom etrical characteristics and ship structure analysis. Through cutting machines possibilities, duration o f cutting is determined for each machine. Analysis o f the cutting duration real values is basis for value distribution definition. Log-normal distribution is very close to real values and it is set in cutting m achines atom s in the simulation model.
B asic areas are m aterial sto ck y ard and shipbuilding w orkshop. Plates and profiles are arran g ed on the m aterial sto ck y ard , w hich is equipped with a portal crane. Portal crane transports a m aterial on the prefabrication line. A fter that plates and profiles are going to the shipbuilding workshop.
The shipbuilding w orkshop consists o f 5 naves. The first nave is used for profile cutting on a robotised line, which consists o f a line for the profile edge cleaning and a robot station for plasma
Numorex Plasma Corta
Semi-automatic
cutting machine Bridge
crane
cutting. Profiles are transported in the nave with bridge crane, roller conveyors and transverse chain transport device.
The second nave is used for disposal o f tools and as an auxiliary area o ff the main material flow. Being less important, this area is not modelled in the program package.
The third nave is used for shaping o f earlier cut plates. The plates are shaped in press, and transported in the nave w ith bridge crane and trolley.
In the forth nave, the profiles are bent on bending m achines and transported w ith bridge crane and trolley.
The plates are cut in the fifth nave. Three cutting machines are used, one for plasma and two for gas cutting (Numorex and Corta). The plates are transported with bridge crane and trolley.
2.3 Production Program
To in itia te the e x p e rim e n t w ith the sim ulation m odel, it is necessary to define the workshop production program, necessary material quantities, and sequence o f fabrication. In this example, the production program includes plates, profiles and bars used for the hull building.
Q uantity o f m aterial is determ ined from characteristic sections. The central part double bottom sections and parts o f the double-bottom with b ilg e o f an oil p ro d u ct carrier w ere selected. Geometry and quantity o f plates, profiles and bars was determined from the specification o f material, same as the fabrication procedures. These data are used to define the scenario o f the material input into the shipbuilding workshop. Figure 3 shows mass percentages o f plates, profiles and bars in total quantity o f material. In total quantity o f material, plates account for 84%, and profiles and bars for
16%.
Fig. 3. Mass percentages o f plates, profiles and bars in total quantity o f material
2.4 Experiments with Model
The m o d ellin g p ro cess is follow ed by launching o f an experim ent. The visualisation module used to monitor the experiment progress is started at the same time. It enables monitoring o f what is happening with material, semi-products, equipment, devices and transport devices in any part o f the process.
The paper describes two experiments with models. Having in mind complexity of the analysis, monitoring o f process and results analysis will be limited to the profiles and plates cutting processes. The efficiency o f equipment, devices and transport devices, situation at the interim store and quantity o f fabricated material are monitored.
The first experiment monitors and evaluates situation in the basic sim ulation model for the shipbuilding w orkshop. Based on the analysis re s u lts , th e c h a n g e s and im p ro v em en ts are
Fig. 4. Distribution o f material according to the working site in the first experiment
R obot
Idle: 48%
Busy: 52%
Plazma Numorex
Y
Busy: 5 6 % |
Corta Semi-automatic cutting machine
I Busy: 63% j N i
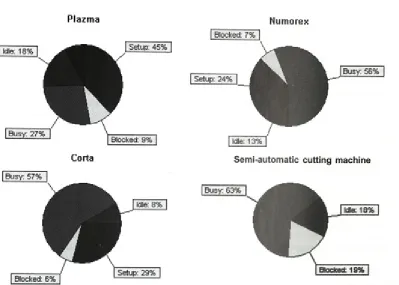
Idle: 18%
j Btodtect 1 Ì% 1
Fig. 6. Status o f cutting machines and plate edge preparation bench during the first experiment
proposed to be included in the new sim ulation model.
The second experiment monitors effects o f the proposed changes on situation in the nave in which the profiles and plates are cut. The proposed im provem ents are estim ated by com parison o f obtained results.
Since an experim ent w ith the sim ulation m o d e l in th e p ro g ra m p a c k a g e is ru n n in g c o n tin u a lly and p erm an en tly , the e x p erim en t du ratio n needs to be lim ited. The ex perim ent duration is set at 1920 hours, i.e. according to the num ber o f w orking days and effective working hours, at six months work in a shipyard.
2.4.1 The First Experiment with Model
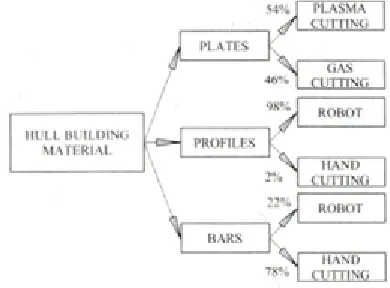
Figure 4 show s d istrib u tio n o f m aterial a c c o rd in g to its fa b ric a tio n site in th e first experiment. Plates are commonly cut by plasm a cutting machine because o f its cutting speed. Profiles are cut by robot, and bars are usually cut by hand.
During the experim ent, profiles and bars cutting robot operation w as m onitored, and the robot status is presented in Figure 5. The machine was busy 52% and idle 48% o f time, and it cuts
8641 profiles and bars. Hence, the machine is not sufficiently busy and it could fabricate an additional quantity o f profiles and bars.
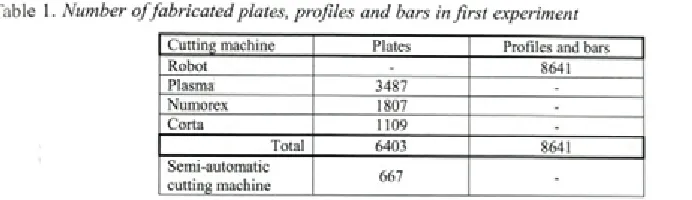
In plates cutting workshop (nave 5), all the cutting machines and the bench on which semi automatic cutting machines are used to prepare the plate edges for welding were monitored. For the ex p e rim e n t, 30% p la te s w ere p la n n e d to be forwarded after machine cutting to the benches for edge preparation for welding. Number o f fabricated plates, profiles and bars are in Table 1. During the experim ent, 6403 plates were fabricated at the c u ttin g m a c h in e s. F ig u re 6 sh o w s sta tu s o f machines and bench during the experiment. It is noticed that machines are blocked for quite a long time, which means that the plate is fabricated and waiting for transportation. The transportation in the workshop is done with a bridge crane, which is expected to perform num erous tasks. It is also noticed that in the interim store, near the edge preparation bench, a large quantity o f material piles up and that it needs to be released o f storage load.
Table 1. Number o f fabricated plates, profiles and bars in first experiment
Cutting machine Plates Profiles and bars
Robot - 8641
Plasma 3487
-Numorex 1807
-Corta 1109
-Total 6403 8641
Semi-automatic
cutting machine 667
-results and real num ber o f w orked elem ents. Simulation model expresses real situation in the shipyard workshop very well.
A cco rd in g to the an aly sis resu lts, the process improvements are proposed which are to be incorporated into the new simulation model and new experiment.
The proposals include:
Increase in profiles cutting machine efficiency by delivery o f a larger quantity o f bars for fabrication. In new experiment, the robot is fed with 60% bars compared to 22% from the first experiment.
- Moving the plate edge prepared for welding to one o f oxygen cutting machines so that number o f plates that go to the edge preparation bench is reduced from 30% to 25%.
- Fitting the plate-cutting workshop with a new bridge crane to share the transportation load with the existing crane.
2.4.2 The Second Experiment with Model
Introduction o f changes into the model results in a new scenario o f material input into the sh ip b u ild in g w o rkshop. N ew d istrib u tio n o f
58% P L A S M A
H U L L B U IL D IN G M A T E R IA L
P LA T E S /S.
A
42% C U T T IN GG A S
98%
y
R O B O T PR O FILE S 'vA
2%
60%
y
H A N D C U T T IN G
R O B O T
B A R S
A , H A N D 40% C U T T IN G
Fig. 7. Distribution o f material according to the working site in the second experiment
material according to the working place is shown in Figure 7.
D uring the experim ent, same as in the previous experim ent, operation o f equipm ent, devices and transport devices, and quantities o f material fabricated in the profiles and plates cutting workshops was monitored.
Figure 8 shows the profiles cutting robot status. The machine was busy 90% o f time and it cut 14756 profiles and bars, which is an increase o f 38% and 70% respectively compared to the first experiment.
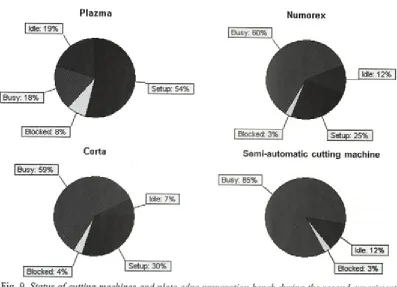
Number o f fabricated plates, profiles and bars is given in Table 2. The machines fabricated 7248 plates, which is 13% more compared to the previous experiment. Cutting machines status is shown in Figure 9. Blocked status was reduced by 25%, and efficiency increased because the crane load was reduced and transportation became more efficient.
A ccording to a sim u latio n , suggested improvements result with greater efficiency and performance o f the machines in the workshop. Comparison o f the data from table 1 and 2 shows that greater quantity o f material could be processed on the cutting machines. This is, very important
Robot
Plazma Numorex
Lor1a Semi-automatic cutting machine
Busy: 59% I
Fig. 9. Status o f cutting machines and plate edge preparation bench during the second experiment
Table 2. Number o f fabricated plates, profiles and bars in second experiment
Cutting m achine Plates Profiles and bars
Robot - 14756
Plasma 4183
-Numorex 1923
-Corta 1142
-Total 7248 8641
Semi-automatic
cutting machine 1638
-for plasma cutting machine. It could cut about 20% m ore plates w ith better transport organization. Improvements influence the quality o f the material flows. It is seen that there are not huge quantities o f material on work-in-process storage areas, which could cause problem s with sorting and control.
T he e ffe c ts o f p ro p o s e d c h a n g e s in w orkshops fo r p lates and p ro files cu ttin g are positive, so it is necessary to make a technical and economic analysis that would estimate necessary investment and payback period.
3 CONCLUSION
Paper presents the usage o f the simulation m ethods in the shipbuilding production process m anagem ent. The entire w orkshop (m achines,
to o ls, w o rk in g areas, tra n sp o rt d ev ices) and products (plates, bars and profiles) was modeled and analyzed by simulation.
Simulation model o f the shipyard workshop was verified and validated, ensuring the confidence in suggested improvements o f the technological processes.
database that makes it possible to evaluate status o f all the production process stages according to the criteria such as efficiency o f equipment and devices, process duration or capacity o f interim stores. The analysis conclusions are used for efficient management and decision-making process in a real system.
An advantage o f simulation procedure use in production process management is that it enables creation o f a realistic model o f the production process and final product, and an approximation o f situations encountered in a real production system to be used in production process control and management. Complex production processes, such ship b u ild in g , are too com plicated to be resolved by mathematical analysis, and simulation m eth o d s have proven b etter for analysis and understanding o f their behaviour. Their application is possible in already defined production processes as well as in those, which are in a design stage.
Application o f the state-of-the-art program packages enables a more extensive use of simulation p rocedures in production process control and management than before. This is certainly due to advancement in computer technology and capacities, prim arily in their operation speed and graphic so ftw are. A dvancem ent in program packages resulted in their being user-friendlier; the users need not involve in programming, coding and testing of programs. Instead, they may focus on modelling, experiments with model and analysis of results.
An advantage the state-of-the-art program packages have is an option o f 2D and 3D visualisation o f production process model, which facilitates an experiment monitoring, detection of errors in model creatio n and pin p o in tin g o f interruptions or bottlenecks in the production process.
4 REFERENCES
[1] Ljubenkov, B. Simulation in management of the jack -u p drilling rig building process, Master Thesis. University o f Zagreb, Faculty o f M e c h an ical E n g in e e rin g and N aval Architecture, 2002. (in Croatian).
[2] *iljak, V. Simulation by computers. Zagreb: Školska knjiga, 1982. (in Croatian).
[3] Medeiros, D.J., Traband, M., Tribble, A., Lepro, R., Fast, K., Williams, D. Simulation based design for shipyard m anufacturing process. Proceedings o f the 2000 Winter Simulation Conference, Orlando, USA. [4] Williams, D., Finke, D.A., Medeiros, D.J.,
T raband, M.T. D iscrete sim ulation development for a proposed shipyard steel processing facility. Proceedings o f the 2001
Winter Simulation Conference, Arlington, USA.
[5] K iran, A ., C etinkaya, T., C abrera, J. H ierarch ical m o d ellin g o f a shipyard in teg rated w ith an external scheduling application. Proceedings o f the 2001 Winter Simulation Conference, Arlington, USA. [6] M cL ean, C ., Shao, G. Sim ulation o f
shipbuilding operations. Proceedings o f the 2001 Winter Sim ulation Conference,
Arlington, USA.
[7] Dain, 0 ., Ginsberg, M., Keenan, E., Pyle, J., Smith, T., Stoneman, A., Pardoe, I. Stochastic sh ip y ard sim u latio n w ith Sim Yard.
Proceedings o f the 2006 Winter Simulation Conference, Monterey, USA.
[8] N edess, C., Friedew ald, A., Wagner, L., H ubler, M. Simulation o f material flo w processes in the planning o f production spaces in shipbuilding. On-line: www.tudelft.nl. [9] Steinhauer, D., Meyer-König, S. Simulation
aided production planning in block assembly.
On-line: www.tudelft.nl.
[10] Sladoljev, Ž., Zaplatić,T., Ljubenkov,B. Some p o ssib ilitie s o f sh ip b u ild in g p ro cess management by simulation method. The Tenth Congress o f the International Maritime Association o f the Mediterranean, Crete, Hellas, 13-17 May, 2002.