R E S E A R C H
Open Access
Associations of physical activity with
childhood asthma, a population study
based on the WHO - health behaviour in
school-aged children survey
Lene Lochte
1*, Poul Erik Petersen
1, Kim G. Nielsen
2, Anette Andersen
3and Thomas A. E. Platts-Mills
4Abstract
Background:Asthma in paediatric populations is one of the highest public health concerns. In this study of children and adolescents, we hypothesized that low levels of physical activity (PA) would show associations with
asthma that vary by asthma outcome. The objective was to assess whether PA was associated withever asthma
and/orcurrent asthma.
Methods:Analyses were based on 4824 Danish schoolchildren aged 11–15 years old (48.7% boys) participating in the HBSC survey. The study variables were (1) physician-diagnosed asthma (ever asthma)and (2) physician-diagnosed asthma plus wheezing and/or physician or hospital consultation for wheezing(current asthma). Associations with PA by gender were analysed with multivariate logistic regression using the“variance covariance (vce) cluster”method.
Results:The prevalence ofever asthmawas 14.3% (boys) and 12.8% (girls), and that ofcurrent asthmawas 6.8% (boys) and 7. 0% (girls). Boys withcurrent asthmashowed important differences in low and high PA. We found inverse associations between low PA andever asthma, odds ratio [95% confidence interval] male: .55 [.30; .99] and female: .47 [.24; .93], and
current asthma,male: .27 [.12; .60] (P linear trend= .007) and female: .32 [.11; .94].
Conclusions:The lowest activity levels showed significant inverse associations with asthma, regardless of the definition. For boys, the more stringent (current asthma) of the two paediatric asthma definitions revealed a significant trend with PA, and the direction of associations shifted to positive as weekly PA increased.
Keywords:Ever/or current asthmatic disease, PA, Paediatric, Children, Adolescents, HBSC, School survey
Background
Asthma in paediatric populations is a serious public
health concern worldwide [1]. The associations between
asthma and physical activity (PA) may be important for disease prevention and control [2,3], but reports on the
mechanisms behind this relationship are scarce [4].
Asthma is one of the most common lower respiratory
diseases in children [5], and its increasing chronic and
acute disease burden has caused considerable distress
among national health authorities [6]. Similarly, people
in most countries perform historically low levels of PA
[7], and 80% do not fulfil the current international
guidelines for PA [8]. Low PA in children has been
pro-posed as one explanation for the so-called “asthma
epi-demic”[9].
The severity of paediatric asthma depends on the aware-ness of the disease condition in the population. The diag-nosis of asthma is often made by a physician according to
medical history and clinical symptoms [9]. However, the
sharp increases in morbidity and mortality have not been explained by alterations in diagnostic practices [10]. De-pending on the measurement methods used, asthma se-verity can influence cardiorespiratory fitness (CRF) [11]. In other paediatric studies, a questionable asthma diagno-sis, i.e., with low sensitivity, has not revealed associations
between asthma severity and maximal oxygen uptake [12].
* Correspondence:rkb664@alumni.ku.dk
1Department of Odontology, University of Copenhagen, 1014 Copenhagen,
Denmark
Full list of author information is available at the end of the article
Given the worldwide variations in the occurrence of
child-hood asthma [6], it is often not clear which diagnosis of
asthma to apply when analysing population data on chil-dren. In observational studies, data are frequently gath-ered by self-reported methods and rarely include clinical examinations.
Some studies have described associations of asthma in
children with low PA [13, 14] or low CRF [15]. PA has
been suggested to modify CRF in asthmatic and healthy
children [16,17]; however, asthma in children comprises
a variety of symptom phenotypes [18], and effective
pre-ventions depend on determining the precise aetiology. We hypothesized that low levels of PA in 11- to 15-year-olds would show associations with childhood asthma that vary by asthma outcome. Therefore, the ob-jective was to assess whether PA was associated with
asthma when defined as ever asthma and/or current
asthmaduring childhood and adolescence.
Methods
Study population and participation rates
We used Danish data that were part of the international World Health Organization (WHO)-coordinated Health
Behaviour in School-aged Children (HBSC) survey [19];
the designwas cross-sectional [20]. The HBSC aimed to
increase the understanding of adolescents’ lifestyle and
its associations with healthy behaviours [21]. The study
used repeated multi-country surveys conducted every four years, primarily in Europe. In Denmark, a survey was conducted six times from 1984 to 2002. The HBSC protocol was standardized (sampling, data collection,
compilation) and used self-completed, anonymous
HBSC questionnaires administered at schools [22]. PA
and asthma were measured for the first time in 1985 and 2002, respectively [21,23].
The present data were collected from Feb-Apr 2002 and included all students in fifth, seventh, and ninth grade based on a random sample of Danish schools (the mean age in years: 11.6, 13.6, and 15.6, respectively). The 2002 survey comprised 68 schools with 5400 stu-dents in 297 classes. Of these, 4981 stustu-dents (92.2%) were present on the day of data collection, and 4824 stu-dents (96.8% of the stustu-dents present) returned a com-pleted questionnaire.
Non-response
There were two sources of non-response: i) schools, classes, and individuals who refused to participate and ii) absence on the data collection day. No follow-up was conducted for absent students. Of the 79 eligible schools, eleven (13.9%) school authorities declined par-ticipation. The Danish part of the survey excluded 31 (0. 64%) questionnaires due to missing information on gen-der or inappropriate responses.
Measurements
Outcome: Based on a validated asthma variable [23], we
established two binary asthma definitions: ever asthma,
defined by a positive response to the question “Has the
doctor ever told you that you have asthma?”, andcurrent
asthma, defined by a positive response to the question
“Has the doctor ever told you that you have asthma?”
plus a positive response to either“In the last 12 months,
have you had episodes of wheezing?” or “In the last 12
months, have you had a consultation for wheezing by a doctor or in a hospital?”
The exposure was PA, which was recorded as
re-sponses to the following:“Outside of school hours, how
many hours a week do you participate in sports or
exer-cise that make you out of breath or sweaty?”There were
six response options reported in hours (h) per week (wk) as follows: “0”, “.5”, “1”, “2–3”, “4–6”, “> = 7”. The PA
question on the HBSC survey [21] adhered to a validated
standard based on Australian schoolchildren [24]. The
following covariates were assessed: grade (fifth, seventh, ninth), self-rated health (poor, good, excellent), body mass index (BMI) (13–15, 16–18, 19–21, > 21, defined as reported body weight in kilograms (kg) divided by
re-ported height in metres (m) squared (kg•m−2)), and
menarche (yes/no).
Statistical methods
Frequencies (%) and means (±2SD) were calculated. For the statistical evaluation, we applied the Chi-square test
of homogeneity (Pearson’s χ2). Spearman’s correlation
coefficient (rho) was assessed to express the correlations between physician-diagnosed asthma and the asthma symptom variables used to define the asthma outcomes in the children investigated.
Univariate analyses produced crude odds ratios (ORs) and 95% confidence intervals (CIs) and assisted the identifi-cation of potential confounding variables (Additional file1). A priori, we selected possible confounding variables using known influential variables and evidence from our uniate analyses. We applied the following criterion for a vari-able to possibly confound a given association: The varivari-able (or groups of variables) demonstrated associations with the
exposure, the outcome or both [25]. Additionally,
Mantel-Haenszel stratification and likelihood ratio tests confirmed that BMI substantially influenced the associations under study. Formal tests of effect modification by self-rated
health did not provide any response in these data (P for
interaction, male = 0.2004, female = 0.3912). Hence, the co-variates adjusted for were as follows: grade and self-rated health (both genders), BMI (boys) (ever asthma only) and menarche (girls). We considered our analytical models along these lines and built them accordingly.
of childhood asthma. The results for ever asthma and
current asthmaare presented in this paper.
In the multivariate logistic regression models, we used
the “variance covariance (vce) cluster” method, which
calculated robust standard errors using schools as clus-ters. This approach allowed for correlated observations, e.g., potential effects of clusters induced by the HBSC sampling method. Hence, we estimated the associations, i.e., ORs (95% CIs), for childhood asthma and PA
expos-ure. High PA (7+ hours per week) served as the
reference, and we estimated the probability for linear trend. The selection of the reference group was based on tertiles of our exposure variable, and we adopted the criterion that more than 50% of the exposed should be
in this group [26]. We used STATA™ (v.12.1) (Stata
Corp, College Station, TX, USA). All tests of significance were two-tailed, andP< 0.05 was considered statistically significant, though strength against the null hypothesis was regarded as superior to the critical value set [27].
Results
Characteristics of the study participants are depicted in
Table1. A total of 4824 schoolchildren (48.7% boys)
par-ticipated. Table 1 shows the reported asthma symptoms
(wheezing and doctor/hospital consultation for
wheez-ing) for males and females. The prevalence of ever
asthma was 14.3% for boys and 12.8% for girls; the
current asthmaprevalence was 6.8% in boys and 7.0% in
girls. Table 2 shows the reported PA categories (low to
high) distributed by male and female gender and
according to ever asthma(Table 2) and current asthma
(Table3). Boys with current asthmaexhibited important
differences in low and high PA. Details of the univariate
associations forever asthmaandcurrent asthmaare
pre-sented in Additional file1. Additional file2 presents the
correlations (Spearman’s rho, r) for physician-diagnosed
asthma and the asthma symptom variables used to
de-fine the respective outcomes, i.e., ever asthma and
current asthma. Table 4 and Table 5 present the crude
and adjusted associations, OR and 95% CI, for PA (0–7+
hours per week) and ever asthma and current asthma,
respectively. After adjustments, we found inverse
associations (i.e., possible protective associations) between
PA and asthma using both definitions. With ever asthma,
inverse associations were present in boys reporting zero
hours of PA per week and for girls reporting 0–1 h of PA
per week, with risk reductions of 45% and 53% in males
and females, respectively (Table 4). For current asthma,
inverse associations were present for boys reporting zero hours of PA per week and for girls reporting .5 h of PA per week, with risk reductions of 73% and 68% in males and females, respectively (Table 5). For current asthma, there was a significant trend (P= .007) in boys (Table5), and the associations shifted in a positive direction as weekly PA increased. There was evidence of an attenuation of effects
for ever (Table 4) and current asthma (Table 5) in both
males and females after adjusting for possible confounders.
Discussion
In this population of schoolchildren, our key finding from the cross-sectional data was that low PA showed significant inverse associations, regardless of asthma
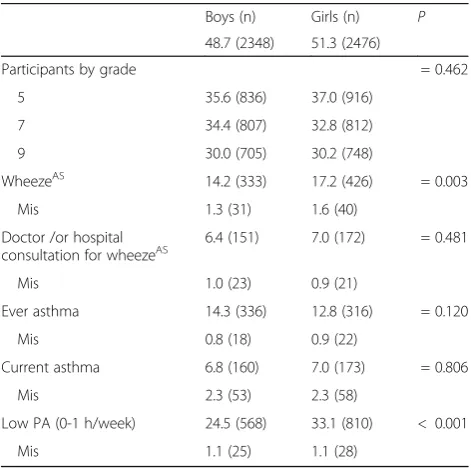
Table 1Characteristics of all study participants (%) by gender
Boys (n) Girls (n) P
48.7 (2348) 51.3 (2476)
Participants by grade = 0.462
5 35.6 (836) 37.0 (916)
7 34.4 (807) 32.8 (812)
9 30.0 (705) 30.2 (748)
WheezeAS 14.2 (333) 17.2 (426) = 0.003
Mis 1.3 (31) 1.6 (40)
Doctor /or hospital
consultation for wheezeAS 6.4 (151) 7.0 (172) = 0.481
Mis 1.0 (23) 0.9 (21)
Ever asthma 14.3 (336) 12.8 (316) = 0.120
Mis 0.8 (18) 0.9 (22)
Current asthma 6.8 (160) 7.0 (173) = 0.806
Mis 2.3 (53) 2.3 (58)
Low PA (0-1 h/week) 24.5 (568) 33.1 (810) < 0.001
Mis 1.1 (25) 1.1 (28)
ASAsthma symptom past 12 months,HHour,MisMissing,NNumber,Ns Non-significant,PProbability of difference between genders (Pearson chi2
),PA Physical activity
Table 2Distribution (%) of weekly PA according toever asthma
for participating boys and girls
PA (h per wk.) Boys (n) Girls (n) Pa
Low (0–1) 22.2 (74) 29.5 (93) = 0.408
Mod (2–3) 28.7 (96) 34.3 (108) = 0.490
High (4–7+) 49.1 (164) 36.2 (114) = 0.498
Pb = 0.524 = 0.323
HHour/s,ModModerate,NNumber,PProbability of difference (Pearson chi2
) between (a) genders, (b) PA categories,PAPhysical activity,WkWeek Overall Pearson chi2
:P= 0.003
Table 3Distribution (%) of weekly PA according tocurrent asthmafor participating boys and girls
PA (h per wk.) Boys (n) Girls (n) Pa
Low (0–1) 16.4 (26) 27.2 (47) = 0.296
Mod (2–3) 28.3 (45) 36.4 (63) = 0.509
High (4–7+) 55.4 (88) 36.4 (63) = 0.749
Pb = 0.025 = 0.229
HHour/s,ModModerate,NNumber,PProbability of difference (Pearson chi2
diagnosis. In addition, high PA among boys demon-strated positive effects, suggesting elevated asthma risks. We confirmed this finding by identifying a positive
dose-response for boys withcurrent asthma.
Our study sample was nationally representative, but our results can be compared with those of international
HBSC collaborators [23] as well. Our results are
consist-ent with those of other authors in addition to the HBSC. For example, although the findings were not reported separately for boys and girls, current asthma reports show null effects for lower activity levels and increased
risk with PA exceeding 7 h per week [28]. Although
asthmatic children and adolescents can be as physically active as healthy children [28,29], they may still
demon-strate lower CRF [30]. The current study determined
that PA is a behavioural factor that varies by context and time, whereas CRF is genetically determined and
there-fore tends to remain stable over time [31]. Additionally,
our results seem to support a previous study investigat-ing sports frequency and incident wheezinvestigat-ing in paediatric
populations [14]. That study found inverse associations
of higher activity in boys and girls [14], and based on
the validated PA measure (“active”: one hour or more
per week) [24] used in the HBSC survey, it is plausible
that the activity frequency reported by our colleagues
[14] is comparable to our results for 1–3 h of PA per
week. In addition, the “leisure-type PA outside school
hours”assessed in our HBSC data may be similar to the
swimming and running that our colleagues [14] studied.
The current study did not measure CRF, and thus we cannot rule out that certain weekly running programmes may have decreased exercise-induced
bronchoconstric-tion [32] and subsequently protected against wheezing.
The selection of participating schoolchildren by “
clus-ter sampling” may introduce selection bias. To account
for this design effect, we adjusted our final analyses to
account for non-independent variables. A computer–
assisted random selection of the eligible schools was per-formed, and we reviewed the initial non-responses in eleven schools. According to the study protocol, the rea-sons for refusing participation were within the frequently reported categories, for example, administrative overload or recent participation in another survey. The participat-ing schools were both private and public, and social class did not influence our findings; in contrast to the Inter-national Study of Asthma and Allergies in Childhood
Table 4Crude and adjusted associations forever asthmai.e. Asthma Definition [1] by physical activity categorised (0-7+hours per week), odds ratio and 95% confidence interval
Boys Girls
“Ever Asthma”(%, n, total) (14.4, 336, 2330) (12.9, 316, 2454)
PA (all categories) (n) 2323 2448
0 h/wk. (%, n) 9.3, 216 11.2, 275
Crude OR (95% CI)a 0.70 (0.40; 1.22)P= 0.207 0.79 (0.52; 1.19)P= 0.255
Adjusted OR (95% CI)b 0.55 (0.30; 0.99)P= 0.046 0.62 (0.40; 0.97)P= 0.034
0.5 h/wk. (%, n) 5.6, 129 6.3, 153
Crude OR (95% CI)a 0.94 (0.50; 1.77)P= 0.840 0.60 (0.32; 1.12)P= 0.109
Adjusted OR (95% CI)b 0.73 (0.35; 1.53)P= 0.409 0.47 (0.24; 0.93)P= 0.030
1 h/wk. (%, n) 9.6, 223 15.6, 382
Crude OR (95% CI)a 1.16 (0.70; 1.91)P= 0.576 0.69 (0.43; 1.12)P= 0.136
Adjusted OR (95% CI)b 0.96 (0.53; 1.74)P= 0.897 0.60 (0.37; 0.98)P= 0.039
2–3 h/wk. (%, n) 28.6, 664 33.5, 819
Crude OR (95% CI)a 1.05 (0.77; 1.43)P= 0.746 0.83 (0.57; 1.21)P= 0.332
Adjusted OR (95% CI)b 1.00 (0.70; 1.42)P= 0.982 0.73 (0.50; 1.07)P= 0.104
4–6 h/wk. (%, n) 27.2, 631 22.4, 549
Crude OR (95% CI)a 1.17 (0.88; 1.56)P= 0.270 0.82 (0.53; 1.28)P= 0.383
Adjusted OR (95% CI)b 1.17 (0.84; 1.62)P= 0.353 0.72 (0.45; 1.15)P= 0.171
7+ h/wk. (%, n) 19.8, 460 11.0, 270
Ref 1.00 1.00
Plinear trend = 0.235 = 0.189
HBSCHealth Behaviour in School-aged Children,HHour/s,ModModerate,RefReference category,WHOWorld Health Organization,WkWeek
a
Univariate analysis i.e. crude effect of PA (n boys: 2311; n girls: 2429)
b
(ISAAC)‘s urban records [33], our HBSC data in mixed rural and urban contexts likely exhibited substantial variability, which improved the accuracy of the measure-ments. Thus, the factors discussed seem to support a sound representativeness of our data.
The attenuation of effects that we observed from the
crude to the adjusted results is consistent with others’
observations [34]. Some previous studies also found
positive associations between low PA and childhood asthma but with certain restrictions. For example, the results of a study with New Zealand children, who are sometimes considered comparable to Scandinavian pop-ulations, indicated inverse effects in children but not in
adolescents [13]. Although our two studies both
investi-gated vigorous activities, the asthma diagnoses varied. In
contrast to the HBSC, ISAAC [13] included parental
as-sistance for the youngest children. We adjusted for grade to represent the age of the students, as this factor con-founded the associations. However, other colleagues noted that, compared to the children, the parents of
asthmatic children reported more PA [35]. Moreover,
the children we studied could have been providing infor-mation about, e.g., a viral infection [12,33]; based on the
questions about asthma that involved contact with phy-sicians or the hospital, the risk of non-random misclassi-fication seems low, but this possibility could have been
assessed quantitatively using sensitivity analyses [36].
Additionally, our results for the male participants seem to agree with recent findings that demonstrate positive
associations between high PA and asthma [37]. These
authors [37] studied club sports, and it is likely that our assessment of after-school PA represent organized activ-ities as well; therefore, our two studies may already be comparable with respect to basic data.
An advantage of the current study is that the PA vari-able had been validated previously demonstrating ac-ceptable validity and reliability and that a relevant reference was used, as the Australian population is often
comparable to European populations [24]. Our findings
for PA may align with previous results, which suggest
that season of the year and low PA are associated [38].
Our data were collected in the spring; in Denmark, this time of the year typically reflects an increase in
chil-dren’s participation in outdoor PA. The partially
compar-able pattern of PA for boys and girls in the reported after-school activities seem consistent with findings
Table 5Crude and adjusted associations forcurrent asthmai.e. Asthma Definition [2] by physical activity categorised (0-7+hours per week), odds ratio and 95% confidence interval
Boys Girls
“Current Asthma”(%, n, total) (7.0, 160, 2295) (7.2, 173, 2418)
PA (all groups) (n) 2323 2448
0 h/wk. (%, n) 9.3, 216 11.2, 275
Crude OR (95% CI)a 0.45 (0.20; 1.03)P= 0.060 0.81 (0.41; 1.57)P= 0.528
Adjusted OR (95% CI)b 0.27 (0.12; 0.60)P= 0.002 0.56 (0.28; 1.14)P= 0.108
0.5 h/wk. (%, n) 5.6, 129 6.3, 153
Crude OR (95% CI)a 0.76 (0.33; 1.78)P= 0.529 0.52 (0.21; 1.32)P= 0.171
Adjusted OR (95% CI)b 0.48 (0.20; 1.16)P= 0.102 0.32 (0.11; 0.94)P= 0.039
1 h/wk. (%, n) 9.6, 223 15.6, 382
Crude OR (95% CI)a 0.77 (0.40; 1.46)P= 0.417 0.63 (0.31; 1.27)P= 0.198
Adjusted OR (95% CI)b 0.55 (0.28; 1.06)P= 0.073 0.52 (0.26; 1.01)P= 0.055
2–3 h/wk. (%, n) 28.6, 664 33.5, 819
Crude OR (95% CI)a 0.99 (0.62; 1.58)P= 0.981 0.91 (0.51; 1.63)P= 0.747
Adjusted OR (95% CI)b 0.76 (0.46; 1.27)P= 0.299 0.82 (0.46; 1.46)P= 0.496
4–6 h/wk. (%, n) 27.2, 631 22.4, 549
Crude OR (95% CI)a 1.34 (0.83; 2.15)P= 0.231 0.85 (0.44; 1.64)P= 0.631
Adjusted OR (95% CI)b 1.21 (0.72; 2.03)P= 0.479 0.77 (0.39; 1.51)P= 0.444
7+ h/wk. (%, n) 19.8, 460 11.0, 270
Ref 1.00 1.00
Plinear trend = 0.007 = 0.229
HBSCHealth Behaviour in School-aged Children,HHour/s,ModModerate,RefReference category,WHOWorld Health Organization,WkWeek
a
Univariate analysis i.e. crude effect of PA (n boys: 2277; n girls: 2397)
b
measured using accelerometry [39]; it is clear that the overall variances in these two studies pertained to the high-intensity leisure-time PA performed by the partici-pating boys. Overall, the two asthma outcomes eluci-dated how asthma in young populations can be expressed using epidemiological data. One advantage of the current findings is the fairly consistent results of the broader and the more restrictive outcome. While the
definition of ever asthma is well-established, current
asthma has been studied using varying definitions [40,
41]. Earlier comparisons of ever asthma and wheezing
show higher prevalence of wheezing, although wheezing
still showed reasonable sensitivity and specificity [33].
Current asthmais likely to represent a more severe vari-ation of asthma symptoms, as the prevalence using this
definition was nearly half that ofever asthma.
The self-reported nature of our data may be a limita-tion. The type of report used is highly important to
asthma outcomes, which are based on children’s ability
to recall that a physician told them that they have asthma. Although we identified a relatively high
preva-lence of ever asthma, this rate was consistent with the
global [6] and HBSC prevalence [42]. In fact, the study
that validated the HBSC asthma questions [23] found
that significantly more parents than children reported
“diagnosed as having asthma”. In our study, we cannot
exclude that some slight overreporting of bothever and
current asthma may have overestimated the prevalence obtained. Additionally, in our analyses, we did not dis-tinguish between younger and older children, but the youngest children in our sample were 11 years of age; hence, as generally seen in the HBSC surveys, there could be less accurate reporting of factors 12 months prior to the survey, particularly by the youngest children. The ISAAC contributed in part to the HBSC asthma questions, but we propose that any discrepancy in reporting by age groups of those 11 (HBSC) and 13 (ISAAC) years would have limited impact on our results. The HBSC asthma questions are based on the Brief Pediatric Asthma Screening (BPAS) questionnaire, which has reasonable sensitivity and only minor
misclassifica-tion [23]. These findings support our argument that the
present HBSC data are valid.
The severity of paediatric asthma studied was indir-ectly included in the asthma symptom questions. In
addition to wheezing, we used a second symptom,“
doc-tor or hospital consultation for wheezing”. This
ap-proach is standard in epidemiological studies of asthma
in children [41]. In the original scale validation of the
HBSC asthma questions, these two symptoms both
ob-tained high scores [23]. While type of PA was not
speci-fied in the HBSC questionnaire, the PA question asked about activities that led to “sweating” or“getting out of breath”. In line with earlier findings [43], it is possible
that some of the children in our study had mild or mod-erate asthma, as high PA was well represented, particu-larly by the boys. We cannot directly distinguish the asthmogeneity of the activities reported by the children, but the HBSC protocol states that PA should be of the
“moderate-to-vigorous” intensity. The HBSC asthma
questions do not ask about participants’ medical
treat-ment for asthma, and thus the proxy we used was“
con-sultation for wheezing by a doctor or in a hospital” to
represent any exacerbation of respiratory symptoms that required medical attention. As this question asked about a hospital episode, the risk of recall bias was considered low. Asthmatic children may need medical treatment to participate in the high-intensity sports reported. As we used child-reported data as opposed to parental reports, the risk of systematic overreporting was not apparent.
The lack of a reference time [24], which is equally
im-portant to self-reported asthma and the PA of the chil-dren surveyed in HBSC, may be a limitation. Thus,
memory cues for PA, for example, “within a fortnight”
or“on weekdays”, likely could have improved the
accur-acy of the self-reports provided by the children. The
lim-itations associated with children’s self-reported PA are
widely recognised [44]; although our PA data do not
pro-vide information on all PA dimensions, the pattern of our results for PA and asthma from the current Danish HBSC study aligns with that of other European countries [7]. We observed some indications of boys with asthma being more physically active on a weekly basis than girls with asthma. This finding further suggests that boys and girls with asth-matic diseases and those in the background population fol-low similar patterns with regard to their PA. Meanwhile, our data for the asthmatic boys and girls clearly showed that two-thirds reported activity levels above the recom-mended European standard of 60 min per day.
Finally, the questionnaire data revealed no obvious gender differences for any of the asthma types. This
finding is in line with earlier findings—at least for low
PA levels [45]; however, supplementary activity
monitor-ing at the leisure settmonitor-ings may have improved our design and the ability of the methods to detect any gender discrepancy.
The current data were cross-sectional, and caution is thus warranted in interpreting our findings as cause-and-effect. We did not ascertain the directions of the as-sociations, and our results could be subject to reverse causation. However, in other cross-sectional designs, our colleagues [40,46] analysed the opposite order of events, i.e., childhood asthma was defined as the exposure. One
of these studies [40] demonstrated an association
be-tween severe asthma in children and low PA. This asso-ciation may support our findings for some participants.
The other study [46] demonstrated that children with
activity, which is consistent with our observations; none-theless, the temporal sequence of our results cannot be accounted for by the present point observations. Further-more, the HBSC design ensured the total anonymity of participants, which precluded us from tracking our partic-ipants over time. While we were unable to detect the fu-ture direction of the associations, overall, cross-sectional studies of asthma in children use heterogeneous
method-ologies [47], and thus future comparisons highly depend
on the application of a systematic approach.
Conclusions
The lowest PA levels showed significant inverse associa-tions with asthma, regardless of the definition. For boys,
the more stringent (current asthma) of the two
paediat-ric asthma definitions revealed a significant trend with PA, and the associations shifted in a positive direction as weekly PA increased.
Additional files
Additional file 1:Univariate analyses. Presents univariate analyses for PA, covariates, Ever Asthma (Tables 15, 16); PA, covariates, Current Asthma (Tables 151, 161); covariates, PA (Table 17). (PDF 133 kb)
Additional file 2:Correlation matrix. Presents correlations for asthma variables. (DOCX 23 kb)
Abbreviations
BMI:Body mass index; BPAS: Brief Pediatric Asthma Screening;
CRF: Cardiorespiratory fitness; HBSC: Health Behaviour in School-aged Chil-dren; ISAAC: International Study of Asthma and Allergies in Childhood; PA: Physical activity; WHO: World Health Organization
Acknowledgements
The current study was conducted as a postdoctoral research project of the first author LL upon completion of her PhD programme at the Faculty of Health and Medical Sciences, University of Copenhagen, Copenhagen, Denmark. LL wishes to express her gratitude to the PhD School and Department of Odontology, University of Copenhagen, and to Professor Bjoern E. Holstein, National Institute of Public Health, University of Southern Denmark, Copenhagen, Denmark.
The authors also wish to thank the Section of Biostatistics, Department of Public Health, University of Copenhagen. In particular, Professor Thomas Scheike (TS) is acknowledged for the review and guidance of the multivariate adjustments. American Journal Experts provided professional editing for the first draft of the manuscript and tables (except Af1 and Af2).
The study used data from the Danish part of the international research project Health Behaviour in School-aged Children (HBSC)–a WHO cross-national survey. The Principal Investigator in Denmark, Dr. Pernille Due from the National Institute of Public Health, Copenhagen, provided the data.
Funding
Neither the HBSC Steering Group to Denmark (AA) nor the author group (PEP, KGN, TAEPM, and LL) had separate funding available for the implementation of this study.
Availability of data and materials
Data are available from the corresponding author upon reasonable request.
Authors’contributions
PEP, KGN, TAEPM, and LL designed this study. AA conceived the questioning regarding asthma symptoms based on the WHO-coordinated HBSC survey. The questionnaires were distributed and data collected and collated by
national representatives of the HBSC. LL analysed the data and received statistical guidance from TS. AA, PEP, KGN, TAEPM, and LL, assisted by TS, interpreted the results. All authors read and provided their approval of the final manuscript.
Ethics approval and consent to participate
In Denmark, when questionnaire-based population studies do not involve human biological material, the ethical authority is the local institution. As is customary for the HBSC [48] survey, we obtained ethical approval from each school’s board of parents and students’council, and we informed the students
–orally and in writing–that their participation was voluntary and anonymous. The HBSC protocol complied with the Declaration of Helsinki II.
Consent for publication
Not applicable because individual data are not presented in the manuscript.
Competing interests
The authors declare that they have no competing interests.
Publisher’s Note
Springer Nature remains neutral with regard to jurisdictional claims in published maps and institutional affiliations.
Author details
1Department of Odontology, University of Copenhagen, 1014 Copenhagen,
Denmark.2Department of Paediatrics and Adolescent Medicine, Copenhagen
University Hospital, Rigshospitalet, 2100 Copenhagen, Denmark.3National Institute of Public Health, University of Southern Denmark, 1455 Copenhagen, Denmark.4Department of Medicine, Division of Allergy and
Clinical Immunology, University of Virginia, Charlottesville, VA 22908, USA.
Received: 1 August 2017 Accepted: 5 April 2018
References
1. World Health Organization. Asthma. Geneva: World Health Organization. 2013. Available:http://www.who.int/mediacentre/factsheets/fs307/en/. Accessed 26 Jan 2018.
2. Platts-Mills TAE. Asthma severity and prevalence: an ongoing interaction between exposure, hygiene, and lifestyle. PLoS Med. 2005;2(2):e34. 3. Clark CJ, Cochrane LM. Physical activity and asthma. Curr Opin Pulm Med.
1999;5(1):68–75.
4. Asher MI, Montefort S, Bjorksten B, Lai CKW, Strachan DP, Weiland SK, et al. Worldwide time trends in the prevalence of symptoms of asthma, allergic rhinoconjunctivitis, and eczema in childhood: ISAAC phases one and three repeat multicountry cross-sectional surveys.[erratum appears in lancet. 2007 Sep 29;370(9593):1128]. Lancet. 2006;368(9537):733–43.
5. Papadopoulos NG, Arakawa H, Carlsen KH, Custovic A, Gern J, Lemanske R, et al. International consensus on (ICON) pediatric asthma. Allergy. 2012; 67(8):976–97.
6. Lai CKW, Beasley R, Crane J, Foliaki S, Shah J, Weiland S, et al. Global variation in the prevalence and severity of asthma symptoms: phase three of the international study of asthma and allergies in childhood (ISAAC). Thorax. 2009;64(6):476–83.
7. World Health Organization. Physical activity 10 key facts on physical activity in the WHO European Region. Geneva: World Health Organization. 2016. Available:http://www.euro.who.int/en/health-topics/disease-prevention/ physical-activity/data-and-statistics/10-key-facts-on-physical-activity-in-the-who-european-region/. Accessed 18 Jan 2018.
8. Hallal PC, Andersen LB, Bull FC, Guthold R, Haskell W, Ekelund U. Global physical activity levels: surveillance progress, pitfalls, and prospects. Lancet. 2012;380(9838):247–57.
9. Eder W, Ege MJ, von Mutius E. The asthma epidemic. New Engl J Med. 2006;355(21):2226–35.
10. Burney PGJ, Chinn S, Rona RJ. Has the prevalence of asthma increased in children? Evidence from the National Study of Health and Growth 1973-86. BMJ. 1990;300(6735):1306–10.
12. Pianosi PT, Davis HS. Determinants of physical fitness in children with asthma. Pediatrics. 2004;113(3):e225–9.
13. Mitchell E, Beasley R, Björkstén B, Crane J, García-Marcos L, Keil U. The association between BMI, vigorous physical activity and television viewing and the risk of symptoms of asthma, rhinoconjunctivitis and eczema in children and adolescents: ISAAC phase three. Clin Exp Allergy. 2013;43(1): 73–84.
14. Vogelberg C, Hirsch T, Radon K, Dressel H, Windstetter D, Weinmayr G, et al. Leisure time activity and new onset of wheezing during adolescence. Eur Respir J. 2007;30(4):672–6.
15. Rasmussen F, Lambrechtsen J, Siersted H, Hansen H, Hansen N. Low physical fitness in childhood is associated with the development of asthma in young adulthood: the Odense schoolchild study. Eur Respir J. 2000;16(5):866–70. 16. Graff-Lonnevig V, Bevegard S, Eriksson BO, Kraepelien S, Saltin B. Two years'
follow-up of asthmatic boys participating in a physical activity programme. Acta Pediatr Scand. 1980;69(3):347–52.
17. World Health Organization. Children's environmental health, Children, mobility and environmental health. World Health Organization. Available:
http://www.who.int/ceh/risks/cehmobility/en/. Accessed 26 Jan 2018. 18. Granell R, Sterne JAC, Henderson J. Associations of different phenotypes of
wheezing illness in early childhood with environmental variables implicated in the Aetiology of asthma. PLoS One. 2012;7(10):e48359.
19. World Health Organization. Young People's Health in Context. Health Behaviour in School-aged Children (HBSC) study: international report from the 2001/2002 survey. Copenhagen: World Health Organization. 2004. Available:http://www.euro.who.int/en/publications/key-publications/. Accessed 26 Jan 2018.
20. Roberts C, Currie C, Samdal O, Currie D, Smith R, Maes L. Measuring the health and health behaviours of adolescents through cross-national survey research: recent developments in the health behaviour in school-aged children (HBSC) study. J Public Health. 2007;15(3):179–86.
21. Currie C, Gabhainn NS, Godeau E. The health behaviour in school-aged children: WHO collaborative cross-national (HBSC) study: origins, concept, history and development 1982–2008. Int J Public Health. 2009;54(2):131–9. 22. Roberts C, Freeman J, Samdal O, Schnohr CW, de Looze ME, Gabhainn NS,
et al. The health behaviour in school-aged children (HBSC) study: methodological developments and current tensions. Int J Public Health. 2009;54(2):140–50.
23. Hublet A, Bacquer DD, Vereecken C, Maes L. Value of a shortened questionnaire in the description of asthma in 10–12-year-old pupils. Pediatr Allergy Immunol. 2004;15(3):247–52.
24. Booth ML, Okely AD, Chey T, Bauman A. The reliability and validity of the physical activity questions in the WHO health behaviour in schoolchildren (HBSC) survey: a population study. Br J Sports Med. 2001;35(4):263–7. 25. Hernán MA, Hernández-Díaz S, Werler MM, Mitchell AA. Causal knowledge
as a prerequisite for confounding evaluation: an application to birth defects epidemiology. Am J Epidemiol. 2002;155(2):176–84.
26. Kirkwood BR, Sterne JAC. Regression modelling. In: Kirkwood BR, Sterne JAC, editors. Essential Medical Statistics. Oxford: Blackwell Science; 2003. p. 321. 27. Sterne JAC, Smith GD. Sifting the evidence—what's wrong with significance
tests? BMJ. 2001;322(7280):226–31.
28. Nystad W. The physical activity level in children with asthma based on a survey among 7–16-year-old school children. Scand J Med Sci Sports. 1997; 7(6):331–5.
29. van Gent R, van der Ent CK, van Essen-Zandvliet LEM, Rovers MM, Kimpen JLL, de Meer G, et al. No differences in physical activity in (un)diagnosed asthma and healthy controls. Pediatr Pulmonol. 2007;42(11):1018–23. 30. Lochte L, Angermann M, Larsson B. Cardiorespiratory fitness of asthmatic
children and validation of predicted aerobic capacity. Clin Respir J. 2009; 3(1):42–50.
31. Kemper HCG, Twisk JWR, Koppes LLJ, van Mechelen W, Post GB. A 15-year physical activity pattern is positively related to aerobic fitness in young males and females (13–27 years). Eur J Appl Physiol. 2001;84(5):395–402. 32. Weiler JM, Anderson SD, Randolph C, Bonini S, Craig TJ, Pearlman DS.
Pathogenesis, prevalence, diagnosis, and management of exercise-induced bronchoconstriction: a practice parameter. Ann Allerg Asthma Im. 2010; 105(6 Suppl):S1–S47.
33. Patel SP, Jarvelin M-R, Little MP. Systematic review of worldwide variations of the prevalence of wheezing symptoms in children. Environ Health. 2008; 7(1):57.
34. Sherriff A, Maitra A, Ness AR, Mattocks C, Riddoch C, Reilly JJ, et al. Association of duration of television viewing in early childhood with the subsequent development of asthma. Thorax. 2009;64(4):321–5. 35. Ownby D, Peterson E, Nelson D, Joseph C, Williams L, Johnson C. The
relationship of physical activity and percentage of body fat to the risk of asthma in 8- to 10-year-old children. J Asthma. 2007;44(10):885–9. 36. Jurek AM, Greenland S, Maldonado G. How far from non-differential does
exposure or disease misclassification have to be to bias measures of association away from the null? Int J Epidemiol. 2008;37(2):382–5. 37. Islam T, Berhane K, McConnell R, Gauderman WJ, Avol E, Peters JM, et al.
Glutathione-S-transferase (GST) P1, GSTM1, exercise, ozone and asthma incidence in school children. Thorax. 2009;64(3):197–202.
38. King AC, Parkinson KN, Adamson AJ, Murray L, Besson H, Reilly JJ, et al. Correlates of objectively measured physical activity and sedentary behaviour in English children. Eur J Pub Health. 2011;21(4):424–31. 39. Riddoch CJ, Mattocks C, Deere K, Saunders J, Kirkby J, Tilling K, et al.
Objective measurement of levels and patterns of physical activity. Arch Dis Child. 2007;92(11):963–9.
40. Lang DM, Butz AM, Duggan AK, Serwint JR. Physical activity in Urban School-aged children with asthma. Pediatrics. 2004;113(4):e341–6. 41. Nystad W, Nafstad P, Harris J. Physical activity affects the prevalence of
reported wheeze. Eur J Epidemiol. 2001;17(3):209–12.
42. Hublet A, De Bacquer D, Boyce W, Godeau E, Schmid H, Vereecken C, et al. Smoking in young people with asthma. J Public Health. 2007;29(4):343–9. 43. Counil F-P, Varray A, Matecki S, Beurey A, Marchal P, Voisin M, et al. Training
of aerobic and anaerobic fitness in children with asthma. J Pediatr. 2003; 142(2):179–84.
44. Sallis JF, Saelens BE. Assessment of physical activity by self-report: status, limitations, and future directions. Res Q Exerc Sport. 2000;71(2 Suppl):S1– S14.
45. Janz KF, Witt J, Mahoney LT. The stability of children's physical activity as measured by accelerometry and self-report. Med Sci Sports Exerc. 1995; 27(9):1326-32.
46. Jones S, Merkle S, Fulton J, Wheeler L, Mannino D. Relationship between asthma, overweight, and physical activity among U.S. high school students. J Commun Health. 2006;31(6):469–78.
47. Lochte L, Nielsen KG, Petersen PE, Platts-Mills TAE. Childhood asthma and physical activity: a systematic review with meta-analysis and Graphic appraisal tool for epidemiology assessment. BMC Pediatr. 2016;16(1):1–13. 48. Holstein B, Pedersen T, Bendtsen P, Madsen K, Meilstrup C, Nielsen L, et al.
![Table 4 Crude and adjusted associations for ever asthma i.e. Asthma Definition [1] by physical activity categorised (0-7+ hours perweek), odds ratio and 95% confidence interval](https://thumb-us.123doks.com/thumbv2/123dok_us/419197.2039399/4.595.57.541.110.403/adjusted-associations-definition-physical-activity-categorised-confidence-interval.webp)
![Table 5 Crude and adjusted associations for current asthma i.e. Asthma Definition [2] by physical activity categorised (0-7+ hours perweek), odds ratio and 95% confidence interval](https://thumb-us.123doks.com/thumbv2/123dok_us/419197.2039399/5.595.56.542.110.403/adjusted-associations-definition-physical-activity-categorised-confidence-interval.webp)
