ISSN: 2146-4138 www.econjournals.com
622
Moroccan Banks Analysis Using CAMEL Model
El Mehdi FERROUHI1
Mohammed V Agdal University (Rabat), Faculty of Law and Economics, Morocco.
Email: [email protected]
ABSTRACT: The present paper analyzes the performance of major Moroccan financial institutions for the period 2001-2011 using CAMEL approach. The research aims to evaluate Moroccan financial institutions’ capital adequacy, asset quality, management, earnings and liquidity and then determine financial performance, operating soundness and regulatory compliance of Moroccan financial institutions. The application of CAMEL model to major Moroccan financial institutions for the period 2001 to 2011 allows us to obtain a ranking of banks. We applied debt equity ratio for the analyze of capital adequacy parameter, loan loss provisions to total loans for the analyze of assets quality parameter, return on equity for analyzing management quality parameter, return on assets to analyze earnings ability and deposits on total assets ratio to analyze liquidity ability.
Keywords: CAMEL approach; financial institutions; Morocco
JEL Classifications: G20; G21
1. Introduction
CAMEL is a system of rating for on-site examinations of banks. Officially known as the Uniform Financial Institutions Rating System (UFIRS), CAMEL is a supervisory rating system adopted by the Federal Financial Institutions Examination Council (FFIEC) on 1979. CAMEL stipulates the evaluation of financial institutions on the basis of five critical dimensions which are: Capital adequacy, Asset quality, Management, Earnings and Liquidity. Sensitivity to market risk, a sixth dimension was added in 1997 and the acronym was changed to CAMELS (Opez, 1999). These components are used to reflect financial performance, operating soundness and regulatory compliance of financial institutions. They are defined as follows (FEDERAL REGISTER, 1997):
The Capital adequacy is rated upon different factors inter alia: The level and quality of capital and the overall financial condition of the institution, the ability of management to address emerging needs for additional capital, the nature, trend, and volume of problem assets, and the adequacy of allowances for loan and lease losses and other valuation reserves, balance sheet composition, including the nature and amount of intangible assets, market risk, concentration risk, and risks associated with nontraditional activities, risk exposure represented by off-balance sheet activities, the quality and strength of earnings, and the reasonableness of dividends…
The ratings of a financial institutions’ Asset quality is based upon, but not limited to, an assessment of the following evaluation factors: the adequacy of underwriting standards, soundness of credit administration practices and appropriateness of risk identification practices, the level, distribution, severity, and trend of problem, classified, nonaccrual, restructured, delinquent, and nonperforming assets for both on- and off-balance sheet transactions, the adequacy of the allowance for loan and lease losses and other asset valuation reserves, the credit risk arising from or reduced by off-balance sheet transactions, such as unfunded commitments, credit derivatives, commercial and standby letters of credit, and lines of credit, the diversification and quality of the loan and investment portfolios…
1
623 The Management is rated upon different factors inter alia: the level and quality of oversight and support of all institution activities by the board of directors and management, the ability of the board of directors and management, in their respective roles, to plan for, and respond to, risks that may arise from changing business conditions or the initiation of new activities or products, the adequacy of, and conformance with, appropriate internal policies and controls addressing the operations and risks of significant activities, the accuracy, timeliness, and effectiveness of management information and risk monitoring systems appropriate for the institution's size, complexity, and risk profile, the adequacy of audits and internal controls to: promote effective operations and reliable financial and regulatory reporting; safeguard assets; and ensure compliance with laws, regulations, and internal policies.
Financial institution's earnings is rated upon different factors inter alia: the level of earnings, including trends and stability, the ability to provide for adequate capital through retained earnings, the quality and sources of earnings, the level of expenses in relation to operations, the adequacy of the budgeting systems, forecasting processes, and management information systems in general…
Liquidity is rated based upon inter alia, these factors: the adequacy of liquidity sources compared to present and future needs and the ability of the institution to meet liquidity needs without adversely affecting its operations or condition, the availability of assets readily convertible to cash without undue loss, access to money markets and other sources of funding, the level of diversification of funding sources, both on- and off-balance sheet, the degree of reliance on short-term, volatile sources of funds, including borrowings and brokered deposits, to fund longer term assets, the trend and stability of deposits…
Sensitivity to market risk is rated based upon, but not limited to, an assessment of the following evaluation factors: the sensitivity of the financial institution's earnings or the economic value of its capital to adverse changes in interest rates, foreign exchange rates, commodity prices, or equity prices, the ability of management to identify, measure, monitor, and control exposure to market risk given the institution's size, complexity, and risk profile, the nature and complexity of interest rate risk exposure arising from nontrading positions. Each of these six components is rated on a scale of 1 (best) to 5 (worst). A composite rating is considered as the indicator of a bank’s current financial condition and is ranges between 1 (best) and 5 (worst). Rating 1 indicates that the financial institution is sound, exhibit strong performance and risk management practices. Rating 2 indicates that the financial institution is fundamentally sound and only moderate weaknesses are present. Rating 3 indicates that the financial institution exhibit a degree of supervisory concern in one or more component. Rating 4 indicates that the financial institution is unsafe and has unsound practices with serious financial problems while rating 5 means that the financial institution is extremely and critically unsound and inadequate risk management practices. Thus, Banks with ratings of 1 or 2 are considered to present few, if any, supervisory concerns, while banks with ratings of 3, 4, or 5 present moderate to extreme degrees of supervisory concern (Padmalatha , 2011).
The present paper analyzes the performance of major Moroccan financial institutions for the period 2001-2011 using CAMEL approach. The research aims to evaluate Moroccan financial institutions’ capital adequacy, asset quality, management, earnings and liquidity and then determine financial performance, operating soundness and regulatory compliance of Moroccan financial institutions.
The paper is organized as follows. In section 2, we review the existing literature on performance financial institutions’ analysis using CAMEL approach. The methodology adopted and data used in this paper are presented in section 3 while section 4 is devoted to the presentation of results. Finally, section 5 offers conclusions.
2. Literature Review
624
Japanese Banks. Prasuna (2004) analyzed the performance of 65 Indian banks using CAMEL model and concluded that better service quality, innovative products and better bargains were beneficial because of the prevailing tough competition. Sarker (2005) examined Bengali Islamic banks using CAMEL model which enabled the regulators to get a Shariah benchmark to supervise and inspect Islamic banks and financial institutions from an Islamic perspective. Nurazi and Evans (2005) show that Adequacy ratio, Assets quality, Management, Earnings, Liquidity and bank size are statistically significant in explaining bank failure. Gupta (2008) analyzed the performance of 30 Indian private banks using Camel Model for the period 2003-2007 and gave rating to top five and bottom five banks.
Siva and Natarjan (2011) tested the applicability of CAMEL norms and its consequential impact on the performance of SBI Groups. The authors found that CAMEL scanning helps banks to diagnose its financial health and alert the bank to take preventive steps for its sustainability. Olweny and Shipo (2011) analyze the determinants of bank failures in Kenya. They found that Asset quality and liquidity are the determinants of Kenyan bank failures. Reddy and Prasad (2011) analyzed the performance of rural Indian banks using CAMEL model. Chaudhry and Singh (2012) analyzed the impact of the financial reforms on the soundness of Indian Banking through its impact on the asset quality. The study identified the key players as risk management, NPA levels, effective cost management and financial inclusion. Mishra (2012) analyzed the performance of different Indian public and private sector banks over the decade 2000-2011 using CAMEL approach and found that private sector banks are at the top of the list, with their performances in terms of soundness being the best. Mishra and Aspal (2013) evaluated the performance and financial soundness of State Bank Group using CAMEL approach and rated different banks using through Capital adequacy, Asset quality Management efficiency, Earning Quality, and Liquidity. Ongore and Kusa (2013) concluded that the financial performance of commercial banks in Kenya is driven mainly by board and management decisions, while macroeconomic factors have insignificant contribution. Gupta (2014) analyzed public banks in India and found that there is a statistically significant difference between the CAMEL ratios and thus the performance of all the public financial institutions.
3.Methodology
The purpose of this paper is to analyze the performance of major Moroccan financial institutions for the period 2001-2011 using CAMEL approach, to evaluate Moroccan financial institutions’ capital adequacy, asset quality, management, earnings and liquidity and to determine financial performance, operating soundness and regulatory compliance of Moroccan financial institutions. To do this, we first define different ratios used to evaluate Moroccan financial institutions capital adequacy, asset quality, management, earnings and liquidity.
According to literature review above, we use in the present paper following ratios to evaluate capital adequacy, asset quality, management, earnings and liquidity:
= , this ratio represents the degree of leverage of a bank and indicates the relative proportion of shareholders' equity and debt used to finance a company's assets;
= , evaluate the proportion of bad loans over total loans;
= , measures a corporation's profitability by revealing how much profit a company generates with the money shareholders have invested;
= , measures bank’s profitability relative to its assets and thus the bank’s overall performance;
= , estimates the proportion of deposits over total assets and thus liquidity risk.
625
The data used in this paper are obtained from annual reports and annual financial statements of the commercial Moroccan banks for the period 2001-2011 of major Moroccan financial institutions: ATTIJARIWAFA BANK (AWB), BANQUE CENTRALE POPULAIRE (BCP), BANQUE MAROCAINE POUR LE COMMERCE ET L’INDUSTRIE (BMCI), BANQUE MAROCAINE DU COMMERCE EXTERIEUR (BMCE BANK), CREDIT AGRICOLE DU MAROC (CAM) and CREDIT DU MAROC (CDM).
4. Results
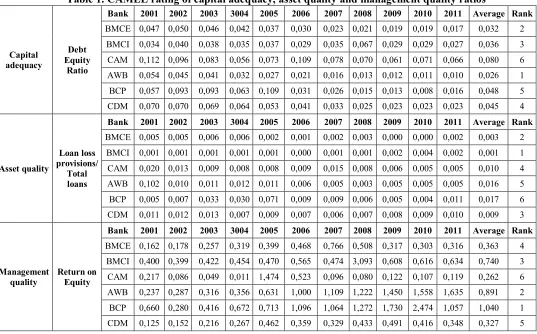
Table 1 presents CAMEL rating of capital adequacy, asset quality and management quality ratios. The analysis of capital adequacy parameter (debt equity ratio), which represents the degree of leverage of a bank and indicates the relative proportion of shareholders' equity and debt used to finance a company's assets, shows that AWB is in the top position with a debt equity ratio equal to 0,026, followed by BMCE (0,032), BMCI (0,036), CDM (0,045) and BCP (0,048). CAM is in the last position (0,080). High ratio indicates less protection for depositors and creditors.
Results of assets quality parameter, which evaluates the proportion of bad loans over total loans, shows that BMCI is in the top position with a loan loss provisions to total loans ratio equal to 0,001 followed by BMCE (0,003), CDM (0,009), CAM (0,01) and AWB (0,016). BCP is in the last position with a ratio equal to 0,017. Since a high ratio means a bad quality of assets, we can conclude that BMCI has the best assets while BCP has the worst ones.
Results of management quality parameter, defined as return on equity, which measures the profitability of a bank, shows that BCP is in the top position with return on equity ratio equal to 1,040 followed by AWB (0,891), BMCI (0,740), BMCE (0,363) and CDM (0,327). CAM is in the last position with a ratio equal to 0,262.
Table 1. CAMEL rating of capital adequacy, asset quality and management quality ratios
Capital adequacy
Debt Equity
Ratio
Bank 2001 2002 2003 3004 2005 2006 2007 2008 2009 2010 2011 Average Rank
BMCE 0,047 0,050 0,046 0,042 0,037 0,030 0,023 0,021 0,019 0,019 0,017 0,032 2 BMCI 0,034 0,040 0,038 0,035 0,037 0,029 0,035 0,067 0,029 0,029 0,027 0,036 3 CAM 0,112 0,096 0,083 0,056 0,073 0,109 0,078 0,070 0,061 0,071 0,066 0,080 6 AWB 0,054 0,045 0,041 0,032 0,027 0,021 0,016 0,013 0,012 0,011 0,010 0,026 1 BCP 0,057 0,093 0,093 0,063 0,109 0,031 0,026 0,015 0,013 0,008 0,016 0,048 5 CDM 0,070 0,070 0,069 0,064 0,053 0,041 0,033 0,025 0,023 0,023 0,023 0,045 4
Asset quality
Loan loss provisions/
Total loans
Bank 2001 2002 2003 3004 2005 2006 2007 2008 2009 2010 2011 Average Rank
BMCE 0,005 0,005 0,006 0,006 0,002 0,001 0,002 0,003 0,000 0,000 0,002 0,003 2 BMCI 0,001 0,001 0,001 0,001 0,001 0,000 0,001 0,001 0,002 0,004 0,002 0,001 1 CAM 0,020 0,013 0,009 0,008 0,008 0,009 0,015 0,008 0,006 0,005 0,005 0,010 4 AWB 0,102 0,010 0,011 0,012 0,011 0,006 0,005 0,003 0,005 0,005 0,005 0,016 5 BCP 0,005 0,007 0,033 0,030 0,071 0,009 0,009 0,006 0,005 0,004 0,011 0,017 6 CDM 0,011 0,012 0,013 0,007 0,009 0,007 0,006 0,007 0,008 0,009 0,010 0,009 3
Management quality
Return on Equity
Bank 2001 2002 2003 3004 2005 2006 2007 2008 2009 2010 2011 Average Rank
BMCE 0,162 0,178 0,257 0,319 0,399 0,468 0,766 0,508 0,317 0,303 0,316 0,363 4 BMCI 0,400 0,399 0,422 0,454 0,470 0,565 0,474 3,093 0,608 0,616 0,634 0,740 3 CAM 0,217 0,086 0,049 0,011 1,474 0,523 0,096 0,080 0,122 0,107 0,119 0,262 6 AWB 0,237 0,287 0,316 0,356 0,631 1,000 1,109 1,222 1,450 1,558 1,635 0,891 2 BCP 0,660 0,280 0,416 0,672 0,713 1,096 1,064 1,272 1,730 2,474 1,057 1,040 1 CDM 0,125 0,152 0,216 0,267 0,462 0,359 0,329 0,433 0,491 0,416 0,348 0,327 5
626
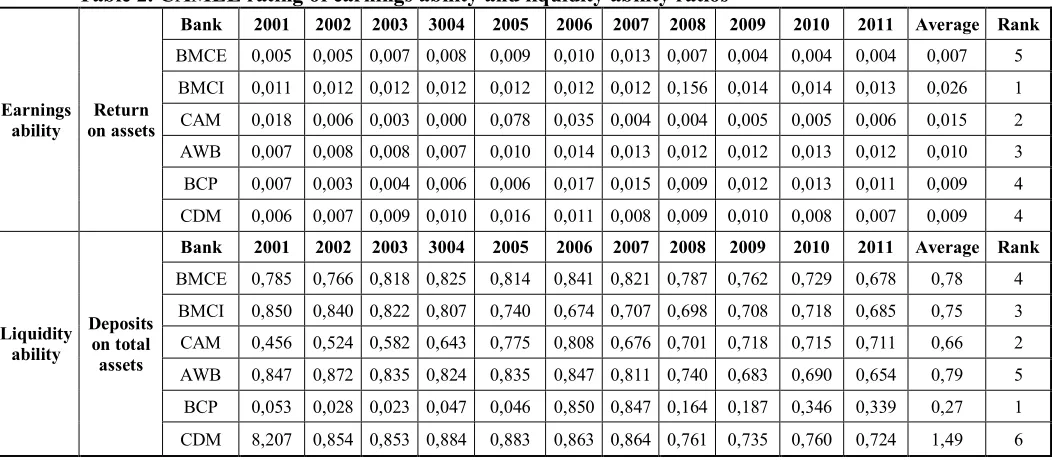
a ratio of 0,026 followed by CAM (0,015), AWB (0,010) and BCP and CDM (0,009) while BMCE has that lower return on assets (0,007).
The analysis of the last CAMEL component, which is liquidity ability represented by deposits on total assets ratio shows that BCP is the best hedged against liquidity risk with a ratio equal to 0,266 followed by CAM with a ratio equal to 0,664, BMCI with a ratio equal to 0,750, BMCE with a ratio equal to 0,784 and AWB (0,785). In the last position, we find CDM with a ratio equal to 1,490.
Table 2. CAMEL rating of earnings ability and liquidity ability ratios
Earnings ability
Return on assets
Bank 2001 2002 2003 3004 2005 2006 2007 2008 2009 2010 2011 Average Rank
BMCE 0,005 0,005 0,007 0,008 0,009 0,010 0,013 0,007 0,004 0,004 0,004 0,007 5 BMCI 0,011 0,012 0,012 0,012 0,012 0,012 0,012 0,156 0,014 0,014 0,013 0,026 1 CAM 0,018 0,006 0,003 0,000 0,078 0,035 0,004 0,004 0,005 0,005 0,006 0,015 2 AWB 0,007 0,008 0,008 0,007 0,010 0,014 0,013 0,012 0,012 0,013 0,012 0,010 3 BCP 0,007 0,003 0,004 0,006 0,006 0,017 0,015 0,009 0,012 0,013 0,011 0,009 4 CDM 0,006 0,007 0,009 0,010 0,016 0,011 0,008 0,009 0,010 0,008 0,007 0,009 4
Liquidity ability
Deposits on total assets
Bank 2001 2002 2003 3004 2005 2006 2007 2008 2009 2010 2011 Average Rank
BMCE 0,785 0,766 0,818 0,825 0,814 0,841 0,821 0,787 0,762 0,729 0,678 0,78 4 BMCI 0,850 0,840 0,822 0,807 0,740 0,674 0,707 0,698 0,708 0,718 0,685 0,75 3 CAM 0,456 0,524 0,582 0,643 0,775 0,808 0,676 0,701 0,718 0,715 0,711 0,66 2 AWB 0,847 0,872 0,835 0,824 0,835 0,847 0,811 0,740 0,683 0,690 0,654 0,79 5 BCP 0,053 0,028 0,023 0,047 0,046 0,850 0,847 0,164 0,187 0,346 0,339 0,27 1
CDM 8,207 0,854 0,853 0,884 0,883 0,863 0,864 0,761 0,735 0,760 0,724 1,49 6
The overall ranking considering all the parameters of CAMEL for the period 2001 to 2011 is represented in table 3. Results of the composite ranking of Moroccan banks using CAMEL model show that CDM is ranked in the first position with a composite ratio equal to 4,4, followed by CAM with a composite ratio equal to 4, BMCE and BCP with a composite ratio equal to 3,4, AWB with a composite ratio equal to 3,2 and, in the last position, BMCI with a composite ratio equal to 2,2.
Table 3. Composite ranking of Moroccan banks using CAMEL model
Bank C A M E L Average Rank
BMCE 2 2 4 5 4 3,4 3
BMCI 3 1 3 1 3 2,2 5
CAM 6 4 6 2 2 4 2
AWB 1 5 2 3 5 3,2 4
BCP 5 6 1 4 1 3,4 3
CDM 4 3 5 4 6 4,4 1
5. Conclusion
627 References
Barr, R.S. Killgo, K.A., Siems, T.F., Zimmel, S. (2002), Evaluating the Productive Efficiency and Performance of U.S. Commercial Banks. Engineering Management, 28(8), 3-25.
Chaudhry, S., Singh, S. (2012), Impact of Reforms on the Asset Quality in Indian Banking. International Journal of Multidisciplinary, 5(2), 17-24.
FEDERAL REGISTER, Uniform Financial Institutions Rating System, Vol. 62, N°6, January 1997. Gupta, P.K. (2008), A CAMEL Model Analysis of Private Sector Banks in India. Journal of Gyan
Management, 2(1), 3-8.
Gupta, PK. (2014), An analysis of Indian public sector banks using CAMEL approach. IOSR Journal of Business and Management, 16, 94-102.
Mishra, S.K., P.K. Aspal (2013), A Camel Model Analysis of State Bank Group. World Journal of Social Sciences, 3(4), 36 – 55.
Mishra, S.K. (2012), Analyzing Soundness in Indian Banking: A CAMEL Approach. Research Journal of Management Sciences, 1(3), 9-14.
Nurazi, R., Evans, M. (2005), An Indonesian Study of the Use of CAMEL(S) Ratios as Predictors of Bank Failure. Journal of Economic and Social Policy, 10(1), 1-23.
Ooweny, T., Shipho, T.M. (2011), Effects of Banking Sectoral Factors on the Profitability of Commercial Banks in Kenya. Economics and Finance Review, 1(5), 1-30.
Ongore, V.O., Kusa, G.B. (2013), Determinants of Financial Performance of Commercial Banks in Kenya. International Journal of Economics and Financial Issues, 3(1), 237-252.
Opez, J.A. (1999) Using CAMELS Ratings to Monitor Bank Conditions. FRBSF Economic Letter. Padmalatha, S. (2011), Management of Banking And Financial Services. Pearson Education India. Prasuna, D.G. (2004), Performance Snapshot 2003-04. Chartered Financial Analyst, 10(1)1, 6-13. Reddy, D.M., Prasad, K.V.N. (2011), Evaluating Performance of Regional Rural Banks: An
Application of CAMEL Model. Journal of Arts, Science & Commerce, 2(4), 61-67.
Said, M-J.B., Saucier, P. (2003), Liquidity, Solvency, and Efficiency? An Empirical Analysis of the Japanese BanksDistress. Journal of Oxford, 5(3), 354-358.
Sarker, A. (2005), CAMEL Rating System in the Context of Islamic Banking: A Proposed ‘S’ for Shariah Framework. Journal of Islamic Economics and Finance, 1(1), 78-84.