60
Copyright © 2016. Vandana Publications. All Rights Reserved.
Volume-6, Issue-6, November-December 2016
International Journal of Engineering and Management Research
Page Number: 60-70
Seismic Analysis of Multi-Storey Building Structure with Shear Walls at
the Center Core and Center of Each Side of the External Perimeter
Mahdi Hosseini1, Prof. N.V.Ramana Rao2 1
Ph.D. Scholar Student in Structural Engineering, Department of Civil Engineering, Jawaharlal Nehru Technological University Hyderabad (JNTUH), Hyderabad, Telengana , INDIA
2Professor, Department of Civil Engineering, Jawaharlal Nehru Technological University Hyderabad (JNTUH), Hyderabad,
INDIA
ABSTRACT
In the present study, a typical multi storey building is analyzed using software ETABS by dynamic (Response Spectrum) analysis. All the analyses has been carried out as per the Indian Standard code books. Based on the literature of previous studies most effective positioning of shear walls has been chosen. Analysis is done on forty storey high and provided with Shear Walls at the center core and at the center of each side of the external perimeter. Seismic performance of building model is evaluated. This study is done on RC framed multistory building with RC shear walls with fixed support conditionsThe usefulness of shear walls in the structural planning of multistory buildings has long been recognized. When walls are situated in advantageous positions in a building, they can be very efficient in resisting lateral loads originating from wind or earthquakes. Incorporation of shear wall has become inevitable in multi-storey building to resist lateral forces. In present work, Fortystorey buildings (120m) for earthquake zone V in India. This paper aims to study the behaviour of reinforced concrete building by conducting dynamic analysis for most suited positions and location of shear wall. Estimation of structural response such as; storey displacements, base shear, storey drift and Stress Distribution is carried out. Dynamic responses under zone V earthquake as per IS 1893 (part 1) : 2002 have been carried out. In dynamic analysis; Response Spectrum method is used.
Keywords_Response Spectrum method ,multi-storey building ,lateral loads, shear wall, storey displacements, base shear, storey drift , Stress Distribution
I.
INTRODUCTION
Shear wall structure
The usefulness of shear walls in framing of buildings has long been recognized. Walls situated in advantageous positions in a building can form an efficient
lateral-force-resisting system, simultaneously fulfilling other functional requirements. When a permanent and similar subdivision of floor areas in all stories is required as in the case of hotels or apartment buildings, numerous shear walls can be utilized not only for lateral force resistance but also to carry gravity loads. In such case, the floor by floor repetitive planning allows the walls to be vertically continuous which may serve simultaneously as excellent acoustic and fire insulators between the apartments. Shear walls may be planar but are often of L-, T-, I-, or U- shaped section to better suit the planning and to increase their flexural stiffness.
The positions of shear walls within a building are usually dictated by functional requirements. These may or may not suit structural planning. The purpose of a building and consequent allocation of floor space may dictate required arrangements of walls that can often be readily utilized for lateral force resistance. Building sites, architectural interests or client’s desire may lead the positions of walls that are undesirable from a structural point of view. However, structural designers are often in the position to advice as to the most desirable locations for shear walls in order to optimize seismic resistance. The major structural considerations for individual shear walls will be aspects of symmetry in stiffness, torsional stability and available overturning capacity of the foundations (Paulay and Priestley, 1992).
Literature Review
Prajapati R.J. et al., (2013) carried out study on deflection in high rise buildings for different position of shear walls. It was observed that deflection for building with shear walls provided at the corners in both the directions was drastically less when compared with other models.
61
Copyright © 2016. Vandana Publications. All Rights Reserved.
shear walls. They have selected a ten storied buildinglocated in zone II, zone III, zone IV and zone V. Parameters like Lateral displacement, story drift and total cost required for ground floor were calculated in both the cases.
Bhat S.M. et al., (2013) carried out study on Eathquakebehaviour of buildings with and without shear walls. Parameters like Lateral displacement, story drift etc were found and compared with the bare frame model.
Rahangdale M. et al., (2013) conducted study on G+ 5 storey symmetric building in Zone IV was presented with some preliminary investigation which was analyzed by changing various positions of shear wall with different shapes and found that a box type shear wall at centre is more safer than to other type of walls placed at different locations.
Sardar S.J. et al., (2013) studied lateral displacement and inter-story drift on a square symmetric structure with walls at the centre and at the edges, and found that the presence of shear wall can affect the seismic behaviour of frame structure to large extent, and the shear wall increases the strength and stiffness of the structure.
Sagar K.et al., (2012) carried out linear dynamic analysis on two sixteen storey high buildings.It was concluded that shear walls are one of the most effective building elements in resisting lateral forces during earthquake. Providing shear walls in proper position minimizes effect and damages due to earthquake and winds.
Kumbhare P.S. et al., (2012) carried out a study on shear wall frame interaction systems and member forces. It was found that shear wall frame interaction systems are very effective in resisting lateral forces induced by earthquake. Placing shear wall away from center of gravity resulted in increase in the most of the members forces. It follows that shear walls should be coinciding with the centroid of the building
Rahman A. et al., (2012) studied on drift analysis due to earthquake load on tall structures. In this study regular shaped structures have been considered. Estimation of drift was carried out for rigid frame structure, coupled shear wall structure and wall frame structure.
Stiffness and drift limitations
The provision of adequate lateral stiffness is a major consideration in the design of a tall building in seismic zone. Firstly, deflection must be maintained at a sufficiently low level for the proper functioning of non-structural components such as elevators and doors. Secondly, it must be limited to prevent excessive cracking and consequent loss of stiffness, and to avoid any redistribution of load to non structural elements such as partitions, infill, cladding or glazing. Thirdly, the structure must be sufficiently stiff to prevent dynamic motions becoming large enough to cause discomfort to occupants, prevent delicate work being undertaken or affect thesensitive equipments.One simple parameter that can be
used to estimate the lateral stiffness of a building is the drift index. It can be defined as the ratio of the maximum deflection at the top of the building to the total height. In addition to that, the inter-story drift index gives a measure of possible localized excessive deformation. The control of lateral deflections is of particular importance for modern tall buildings in which the traditional reserves of stiffness due to heavy internal partitions and outer cladding have largely disappeared.Smith and Coull (1991) state that the design drift index limits that have been used on different countries range from 0.001 to 0.005. Generally, lower values would be used for hotels or apartment buildings than for office buildings. Sufficient stiffness must be provided to ensure that the top deflection does not exceed this value under extreme load events. As the building height increases, drift index coefficient should be decreased to the lower end of the range to keep the story deflection to a suitably low level. If excessive, the drift of a structure can be reduced by changing geometric configuration to alter the mode of lateral load resistance. Increasing thebending stiffness of the horizontal members, adding additional stiffness by inclusion of stiffer wall or core members, achieving stiffer connections and even by sloping the exterior columns are some of the solutions.As per Indian standard, Criteria for earthquake resistant design of structures, IS 1893 (Part 1) : 2002, the story drift in any story due to service load shall not exceed 0.004 times the story height.
II.
METHODOLOGY
Earthquake motion causes vibration of the structure leading to inertia forces. Thus a structure must be able to safely transmit the horizontal and the vertical inertia forces generated in the super structure through the foundation to the ground. Hence, for most of the ordinary structures, earthquake-resistant design requires ensuring that the structure has adequate lateral load carrying capacity. Seismic codes will guide a designer to safely design the structure for its intended purpose.
1. Dynamic analysis.
I. Response spectrum method.
II. Time history method. Dynamic Analysis
Dynamic analysis shall be performed to obtain the design seismic force, and its distribution in different levels along the height of the building, and in the various lateral load resisting element, for the following buildings:
Regular buildings
Those greater than 40m in height in zones IV and V, those greater than 90m in height in zone II and III. Irregular buildings
62
Copyright © 2016. Vandana Publications. All Rights Reserved.
The analysis of model for dynamic analysis ofbuildings with unusual configuration should be such that it adequately models the types of irregularities present in the building configuration. Buildings with plan irregularities, as defined in Table 4 of IS code: 1893-2002 cannot be modeled for dynamic analysis.Dynamic analysis may be performed either by the TIME HISTORY METHOD or by the RESPONSE SPECTRUM METHOD .However in either method, the design base shear VB shall be compared with a base shear VB calculated using a fundamental period
Ta. When VB is less than VB all the response quantities shall be multiplied by VB /VbThe values of damping for a building may be taken as 2 and 5 percent of the critical, for the purpose of dynamic analysis of steel and reinforced concrete buildings, respectively.
Time History Method
The usage of this method shall be on an appropriate ground motion and shall be performed using accepted principles of dynamics. In this method, the mathematical model of the building is subjected to accelerations from earthquake records that represent the expected earthquake at the base of the structure.
Response Spectrum Method
The word spectrum in engineering conveys the idea that the response of buildings having a broad range of periods is summarized in a single graph. This method shall be performed using the design spectrum specified in code or by a site-specific design spectrum for a structure prepared at a project site. The values of damping for building may be taken as 2 and 5 percent of the critical, for the purposes of dynamic of steel and reinforce concrete buildings, respectively. For most buildings, inelastic response can be expected to occur during a major earthquake, implying that an inelastic analysis is more proper for design. However, in spite of the availability of nonlinear inelastic programs, they are not used in typical design practice because:
1. Their proper use requires knowledge of their inner workings and theories. design criteria, and
2. Result produced are difficult to interpret and apply to traditional design criteria , and
3. The necessary computations are expensive. Therefore, analysis in practice typically use linear elastic procedures based on the response spectrum method. The response spectrum analysis is the preferred method because it is easier to use.
Modes to be Considered
The number of modes to be considered in the analysis should be such that the sum of the total modal masses of all modes considered is at least 90% of the total seismic mass and the missing mass correction beyond 33%.If modes with natural frequency beyond 33 Hz are to be considered, modal combination shall be carried out only for modes up to 33 Hz.
Computation of Dynamic Quantities
Buildings with regular ,or nominally irregular plan configuration may be modeled as a system of masses lumped at the floor levels with each mass having one degree of freedom, that of lateral displacement in the direction of consideration
Details Of The Building
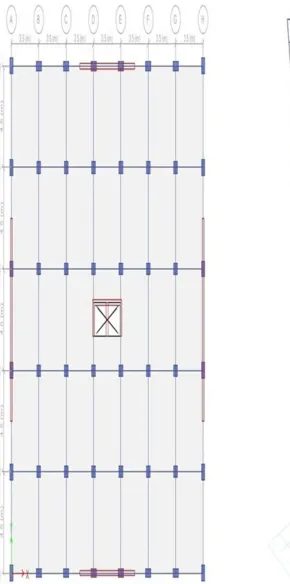
A symmetrical building of plan 24.5m X 22.5m located with location in zone V, India is considered. Seven bays of length 3.5m along X - direction and five bays of length 4.5m along Y - direction are provided. Shear Wall is provided at the center core and Center of Each Side of the External Perimeter building models.
63
Copyright © 2016. Vandana Publications. All Rights Reserved.
Figure 1:Plan of the building with Shear Walls provided atthe centre core and at the center of each side of the
64
Copyright © 2016. Vandana Publications. All Rights Reserved.
Load combinationsAs per IS 1893 (Part 1): 2002 Clause no. 6.3.1.2, the following load cases have to be considered for analysis: 1.5 (DL + IL)
1.2 (DL + IL ± EL) 1.5 (DL ± EL) 0.9 DL ± 1.5 EL
Earthquake load must be considered for +X, -X, +Y and – Y directions.
Check for reinforcement As per IS 13920; Clause 6.2.1 (b)
The tension steel ratio on any face, at any section, shall not be less than 0.24 /fy
Therefore, = 0.361 % As per IS 13920; Clause 6.2.2
The maximum steel ratio on any face at any section, shall not exceed 0.025 or 2.5 %.
Design was carried out by the software and values for critical members were noted down as follows;
Table II: values of most critical member of building model.
Building Model
values
BuildingModel 1.58
Therefore, all the models pass the reinforcement check. Design of columns
Check for axial stress As per IS 13920; Clause 6.1.1
The factored axial stress on the member under earthquake loading shall not exceed 0.1 (=3 Mpa)
The factored axial stress values for the most critical member of each model were noted down as follows;
Table III: Axial stress values of most critical member of building model.
Building Model
BuildingModel 4.16
All the models do not satisty the above clause. However, IS 13920 specifies another clause for this case. Design requirements which have axial stress in excess of 0.1
In the present study, the minimum dimension of the member provided is 500 mm. Also the shortest dimension provided is 500 mm. As per IS 13920; Clause
7.1.2, the minimum dimension of the member shall not be less than 200 mm.
Two types of columns were provided in the present study. Column 1 has a cross section of 400 X 700 mm while Column 2 has 500 X 500 mm
Column 1; 400/700 =0.57 0.4. Column 2; 500/500 = 1 0.4
As per IS 13920; Clause 7.1.3, the ratio of the shortest cross sectional dimension to the perpendicular dimension shall preferably not be less than 0.4.
Hence, both the columns satisfy the clause.
The column section shall be designed just above and just below the beam column joint, and larger of the two reinforcements shall be adopted. This is similar to what is done for design of continuous beam reinforcements at the support. The end moments and end shears are available from computer analysis. The design moment should include:
(a) The additional moment if any, due to long column effect as per clause 39.7 of IS 456:2000.
(b) The moments due to minimum eccentricity as per clause 25.4 of IS 456:2000.
The longitudinal reinforcements are designed as per IS 456 : 2000
Reinforcement check
Design was carried out by the software and values for critical members were noted down as follows;
Table IV: values of most critical member of building model.
Building Model values
BuildingModel 2.14
As per IS 456 : 2000; Clause 26.5.3.1(a) the cross sectional area of longitudinal reinforcement, shall not be less than 0.8 % nor more than 6 % of the gross cross sectional area of the column. It should be noted that percentage of steel should not exceed 4 % since it may involve practical difficulties. Therefore, the model pass the reinforcement check.
III.
RESULTS AND DISCUSSION
Building With Shear Walls Provided At The Centre Core And At The Center Of Each Side Of The External Perimeter.
65
Copyright © 2016. Vandana Publications. All Rights Reserved.
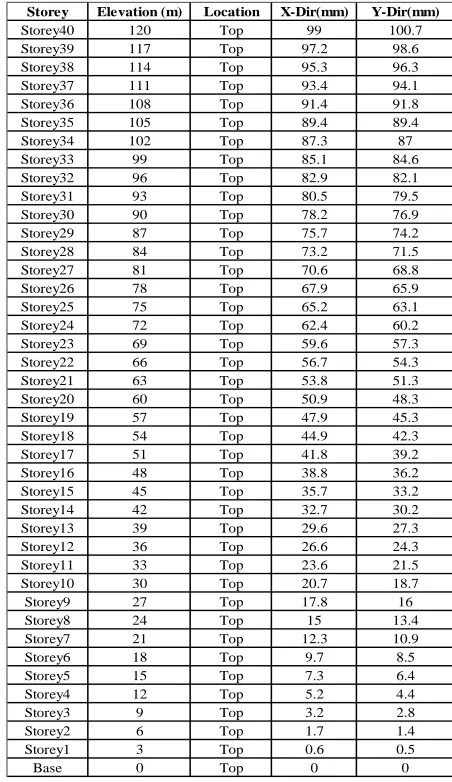
Table V:Storey Maximum Displacement in X and Ydirections
Table VI:Storey Stiffness, Shears and Drifts in X and Y directions
Table VII: Modes and Periods
Here the minimum modal mass for accelerations Ux and Uy is 94.38 % and 92.59 % respectively.
Mode Shapes
Figure 3: Mode shape for model
Storey Elevation (m) Location X-Dir(mm) Y-Dir(mm)
Storey40 120 Top 99 100.7
Storey39 117 Top 97.2 98.6
Storey38 114 Top 95.3 96.3
Storey37 111 Top 93.4 94.1
Storey36 108 Top 91.4 91.8
Storey35 105 Top 89.4 89.4
Storey34 102 Top 87.3 87
Storey33 99 Top 85.1 84.6
Storey32 96 Top 82.9 82.1
Storey31 93 Top 80.5 79.5
Storey30 90 Top 78.2 76.9
Storey29 87 Top 75.7 74.2
Storey28 84 Top 73.2 71.5
Storey27 81 Top 70.6 68.8
Storey26 78 Top 67.9 65.9
Storey25 75 Top 65.2 63.1
Storey24 72 Top 62.4 60.2
Storey23 69 Top 59.6 57.3
Storey22 66 Top 56.7 54.3
Storey21 63 Top 53.8 51.3
Storey20 60 Top 50.9 48.3
Storey19 57 Top 47.9 45.3
Storey18 54 Top 44.9 42.3
Storey17 51 Top 41.8 39.2
Storey16 48 Top 38.8 36.2
Storey15 45 Top 35.7 33.2
Storey14 42 Top 32.7 30.2
Storey13 39 Top 29.6 27.3
Storey12 36 Top 26.6 24.3
Storey11 33 Top 23.6 21.5
Storey10 30 Top 20.7 18.7
Storey9 27 Top 17.8 16
Storey8 24 Top 15 13.4
Storey7 21 Top 12.3 10.9
Storey6 18 Top 9.7 8.5
Storey5 15 Top 7.3 6.4
Storey4 12 Top 5.2 4.4
Storey3 9 Top 3.2 2.8
Storey2 6 Top 1.7 1.4
Storey1 3 Top 0.6 0.5
Base 0 Top 0 0
Shear X Drift X Stiffness X Shear Y Drift Y Stiffness Y
Storey kN mm kN/m kN mm kN/m
66
Copyright © 2016. Vandana Publications. All Rights Reserved.
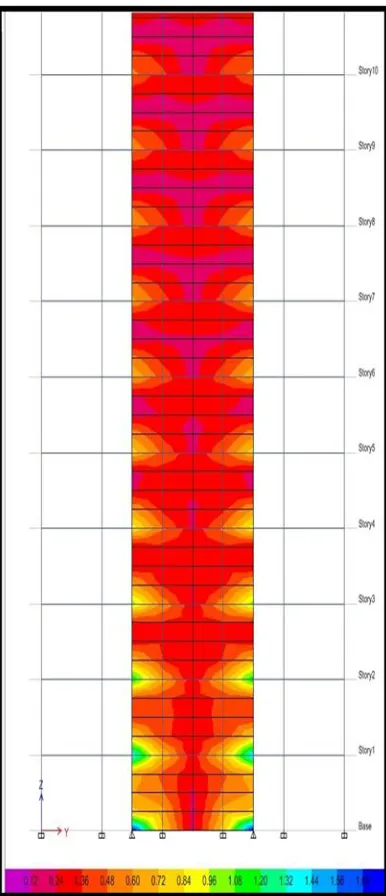
Stress DistributionThe stress distribution in shear walls is represented diagrammatically for the model. The stress distribution for shear walls located in the external periphery of the plan of building is studied.
Figure 4:(a) Stress distribution in Building Model Figure 4:(b) Stress distribution in Building Model
67
Copyright © 2016. Vandana Publications. All Rights Reserved.
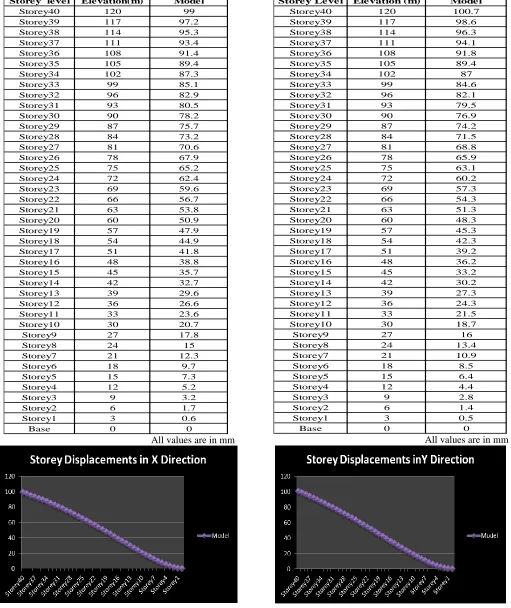
Storey Maximum DisplacementsTable VIII:Maximum Storey Displacements in X Direction
All values are in mm
Table IX:Maximum Storey Displacements in Y Direction
All values are in mm
Storey level Elevation(m) Model
Storey40 120 99
Storey39 117 97.2
Storey38 114 95.3
Storey37 111 93.4
Storey36 108 91.4
Storey35 105 89.4
Storey34 102 87.3
Storey33 99 85.1
Storey32 96 82.9
Storey31 93 80.5
Storey30 90 78.2
Storey29 87 75.7
Storey28 84 73.2
Storey27 81 70.6
Storey26 78 67.9
Storey25 75 65.2
Storey24 72 62.4
Storey23 69 59.6
Storey22 66 56.7
Storey21 63 53.8
Storey20 60 50.9
Storey19 57 47.9
Storey18 54 44.9
Storey17 51 41.8
Storey16 48 38.8
Storey15 45 35.7
Storey14 42 32.7
Storey13 39 29.6
Storey12 36 26.6
Storey11 33 23.6
Storey10 30 20.7
Storey9 27 17.8
Storey8 24 15
Storey7 21 12.3
Storey6 18 9.7
Storey5 15 7.3
Storey4 12 5.2
Storey3 9 3.2
Storey2 6 1.7
Storey1 3 0.6
Base 0 0
Storey Leve l Elevation (m) Model
Storey40 120 100.7
Storey39 117 98.6
Storey38 114 96.3
Storey37 111 94.1
Storey36 108 91.8
Storey35 105 89.4
Storey34 102 87
Storey33 99 84.6
Storey32 96 82.1
Storey31 93 79.5
Storey30 90 76.9
Storey29 87 74.2
Storey28 84 71.5
Storey27 81 68.8
Storey26 78 65.9
Storey25 75 63.1
Storey24 72 60.2
Storey23 69 57.3
Storey22 66 54.3
Storey21 63 51.3
Storey20 60 48.3
Storey19 57 45.3
Storey18 54 42.3
Storey17 51 39.2
Storey16 48 36.2
Storey15 45 33.2
Storey14 42 30.2
Storey13 39 27.3
Storey12 36 24.3
Storey11 33 21.5
Storey10 30 18.7
Storey9 27 16
Storey8 24 13.4
Storey7 21 10.9
Storey6 18 8.5
Storey5 15 6.4
Storey4 12 4.4
Storey3 9 2.8
Storey2 6 1.4
Storey1 3 0.5
68
Copyright © 2016. Vandana Publications. All Rights Reserved.
For both X and Y directions, the behaviour of thegraph is similar for the modelas shown. Model had the least Maximum storey displacement of 99 mm and 100.7 mm in X and Y direction respectively. The order of
maximum storey displacement in both the directions for model is same. Maximum storey displacements is less than 5 % i.e, well within the engineering limits.
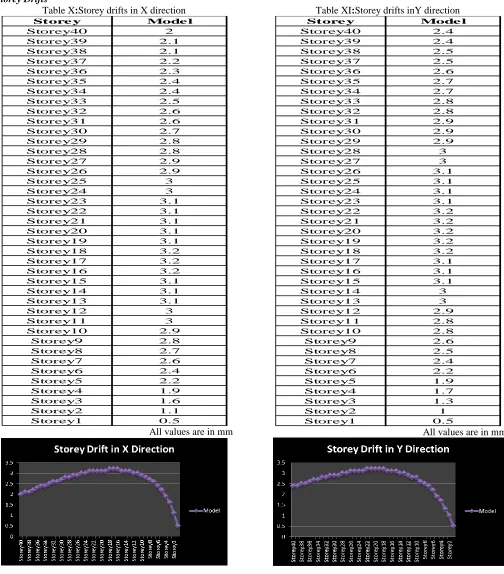
Storey Drifts
Table X:Storey drifts in X direction
All values are in mm
Table XI:Storey drifts inY direction
All values are in mm
Store y Mode l
Storey40 2
Storey39 2.1
Storey38 2.1
Storey37 2.2
Storey36 2.3
Storey35 2.4
Storey34 2.4
Storey33 2.5
Storey32 2.6
Storey31 2.6
Storey30 2.7
Storey29 2.8
Storey28 2.8
Storey27 2.9
Storey26 2.9
Storey25 3
Storey24 3
Storey23 3.1
Storey22 3.1
Storey21 3.1
Storey20 3.1
Storey19 3.1
Storey18 3.2
Storey17 3.2
Storey16 3.2
Storey15 3.1
Storey14 3.1
Storey13 3.1
Storey12 3
Storey11 3
Storey10 2.9
Storey9 2.8
Storey8 2.7
Storey7 2.6
Storey6 2.4
Storey5 2.2
Storey4 1.9
Storey3 1.6
Storey2 1.1
Storey1 0.5
Store y Mode l
Storey40 2.4
Storey39 2.4
Storey38 2.5
Storey37 2.5
Storey36 2.6
Storey35 2.7
Storey34 2.7
Storey33 2.8
Storey32 2.8
Storey31 2.9
Storey30 2.9
Storey29 2.9
Storey28 3
Storey27 3
Storey26 3.1
Storey25 3.1
Storey24 3.1
Storey23 3.1
Storey22 3.2
Storey21 3.2
Storey20 3.2
Storey19 3.2
Storey18 3.2
Storey17 3.1
Storey16 3.1
Storey15 3.1
Storey14 3
Storey13 3
Storey12 2.9
Storey11 2.8
Storey10 2.8
Storey9 2.6
Storey8 2.5
Storey7 2.4
Storey6 2.2
Storey5 1.9
Storey4 1.7
Storey3 1.3
Storey2 1
69
Copyright © 2016. Vandana Publications. All Rights Reserved.
As per Indian standard, Criteria for earthquakeresistant design of structures, IS 1893 (Part 1) : 2002, the story drift in any story due to service load shall not exceed 0.004 times the story height.
The height of the each storey is 3 m. So, the drift limitation as per IS 1893 (part 1) : 2002 is 0.004 X 3 m = 12 mm.
The maximum drift in the model is 6 mm which is well within the limits.
The model show a similar behaviour for storey drifts as shown in graph. Building Modelshow lower drift values.
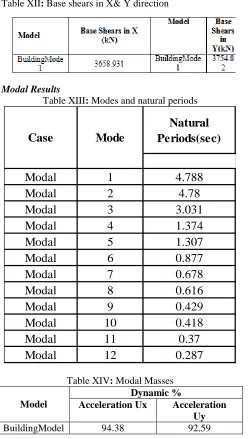
Base Shears
Table XII: Base shears in X& Y direction
Modal Results
Table XIII: Modes and natural periods
Table XIV: Modal Masses
Model
Dynamic %
Acceleration Ux Acceleration Uy
BuildingModel 94.38 92.59
According to IS-1893:2002 the number of modes to be used in the analysis should be such thatthe total sum of modal masses of all modes considered is at least 90
percent of the total seismicmass. Here the minimum modal mass is 92.25 percent.
IV. CONCLUSION AND
RECOMMENDATIONS
Conclusions
In this paper, reinforced concrete shear wall buildings were analyzed with the procedures laid out in IS codes. Seismic performance of building model is evaluated.
From the above results and discussions, following conclusions can be drawn:
1. Shear Walls must be coinciding with the centroid of the building for better performance. It follows that a centre core Shear wall should be provided. 2. The location of shear walls in the the outermost
perimeter considerably reduce the effects of displacements and drifts.
3. Shear walls are more effective when located along exterior perimeter of the building. Such a layout increases resistance of the building to torsion. 4. Building with Shear Walls provided at the center
core and at the center of each side of the external perimeter showed better performance in terms of maximum storey displacements and storey drifts. Also, the base shear was found to be highest for this case. It was also found that this model exhibited high stiffness when compared to other models.
5. Based on the analysis and discussion ,shear wall are very much suitable for resisting earthquake induced lateral forces in multistoried structural systems when compared to multistoried structural systems whit out shear walls. They can be made to behave in a ductile manner by adopting proper detailing techniques.
6. The vertical reinforcement that is uniformly distributed in the shear wall shall not be less than the horizontal reinforcement .This provision is particularly for squat walls (i.e. Height-to-width ratio is about 1.0).However ,for walls whit height-to-width ratio less than 1.0, a major part of the shear force is resisted by the vertical reinforcement. Hence, adequate vertical reinforcement should be provided for such walls. 7. Shear walls must provide the necessary lateral
strength to resist horizontal earthquake forces. 8. When shear walls are strong enough, they will
transfer these horizontal forces to the next element in the load path below them, such as other shear walls, floors, foundation walls, slabs or footings. 9. Shear walls also provide lateral stiffness to prevent
the roof or floor above from excessive side-sway. Recommendations
Natural
Periods(sec)
Modal
1
4.788
Modal
2
4.78
Modal
3
3.031
Modal
4
1.374
Modal
5
1.307
Modal
6
0.877
Modal
7
0.678
Modal
8
0.616
Modal
9
0.429
Modal
10
0.418
Modal
11
0.37
Modal
12
0.287
70
Copyright © 2016. Vandana Publications. All Rights Reserved.
Different assumptions and limitations have beenadopted for simplicity in modeling the proposed structures. In reality, it might affect on results. Thus, all factors which may influence on the behaviour of the structures should be considered in the modeling. For the further study, to obtain the real responses of the structures, the following recommendations are made:
1. Since the study was performed for only one type of shear wall, the further investigations should be made for different types of shear walls.
2. Further investigations should be done for shear walls with different aspect ratio (h/L), in frame-shear wall structures.
3. A flexible foundation will affect the overall stability of the structure by reducing the effective lateral stiffness. So the soil structure interaction should be considered in further study.
4. Shear wall structure have been shown to perform well in earthquakes, for which ductility becomes an important consideration. Thus, further study should be made considering geometric and material non-linear behavior of the members concerned.
5. The study was performed for a damping ratio of 5% for all models. Further studies should be carried out for damping ratious of 10%, 15% and so on.
REFERENCES
[1] Bureau of Indian Standars, IS 456 : 2000, ―Plain and Reinforced Concrete-Code of practice‖, New Delhi, India. [2] Bureau of Indian Standards: IS 13920 : 1993, ―Ductile detailing of reinforced concrete structures subjected to seismic forces— Code of Practice‖, New Delhi, India. [3] Bureau of Indian Standards: IS 875( part 1) : 1987, ―Dead loads on buildings and Structures‖, New Delhi, India.
[4] Bureau of Indian Standards: IS 875( part 2 ) : 1987, ―Live loads on buildings and Structures‖,New Delhi, India. [5] Bureau of Indian Standards: IS 1893 (part 1) : 2002, ―Criteria for earthquake resistant design of structures: Part 1 General provisions and buildings‖, New Delhi, India. [6] Duggal, S.K., ―Earthquake Resistant Design of Structures‖ Oxford University Press, New Delhi 2010 [7] Chopra, A.K., ―Dynamics of Structures: Theory and Application to Earthquake Engineering‖,Pearson Education, 4th edition, 2012.
[8] Ashraf, M., Siddiqi, Z.A., Javed, M.A., ―Configuration of a multi-story building subjected to lateral forces‖, Asian journal of civil engineering, Vol. 9, No. 5, pp. 525-537, 2008.
[9] Chandiwala, A., ―Earthquake Analysis of Building Configuration withDifferent Position of Shear Wall‖, International Journal of Emerging Technology and
Advanced Engineering ISSN 2250-2459, Volume 2, Issue 12, December 2012,
[10] Chandurkar, P.P., Dr. Pajgade, P.S., ―Seismic analysis of RCC building with and without shear wall‖, International Journal of Modern Engineering Research. Vol. 3, Issue 3, pp. 1805-1810, 2013.
[11] Kedavkar, K.D., Kodag, P.B., ―Lateral load analysis of RCC building‖, Vol.3, Issue.3, pp-1428-1434, ISSN: 2249-6645, International Journal of Modern Engineering Research (IJMER), May-June 2013.