176
Copyright © 2016. Vandana Publications. All Rights Reserved.
Volume-7, Issue-1, January-February 2017
International Journal of Engineering and Management Research
Page Number: 176-183
A Comparative Analysis of Nonperforming Assets Management in
Nationalised Banks of India
(For the period 2011-12 to 2015-16)
Vijay Kumar Sharma
MBA (Finance), AICMA-ICAI, Cost Management Accountants, INDIA
ABSTRACT
Banking Industry play a very important role in economic development of a country through extending credit to various deficit sectors and earn income in the form of interest on advance and other incomes like commission , consultancy fee etc. But the credit creation activity creates credit risk to the bank which results in nonperforming assets. NPA is one of the important parameter in analysing the performance of banks as it reduces the profit margin and increases the carrying cost of such nonperforming assets in the form of necessary provisions to counter credit risk. A high level of nonperforming assets also makes negative impact on net worth of the bank. So NPAs are big problem to the bank as banks are under pressure to maintain a desire level of capital adequacy ratio.
The current research paper is based on the study of nonperforming assets of nineteen nationalised banks of India. The objectives of the current study are to access the level of NPAs and their comparison among nineteen nationalised banks for previous five years. The data for five financial years has been collected and analysed by arithmetic mean, standard deviation, average annual growth rate and ranking method. One way ANOVA has been used to test whether there is significant difference in the level of NPAs of nationalised banks. On the basis of the study it was found that Syndicate Bank, Vijaya Bank, Indian Bank and Bank of Baroda performed well compare to other nationalised banks in terms of strict control over their NPAs year to year basis, however Union Bank of India, United bank of India and Indian Bank were poor performer in NPAs management during the study period from 2011-12 to 2015-16.
Keyword-- NPA, Net Non Performing Assets, Gross Non Performing Assets, Nationalised Banks, GNPA Ratio and NPA Ratio.
I.
INTRODUCTION
In any economy banking industry has its own importance in fund mobilization and growth and development. Banks is an institution which accepts deposits from surplus generating groups and mobilizes
these deposits to deficit group in the economy, who can use these funds for production and capital formation. So through credit creation banks contributes in economic development.
The main source of earning to a bank is interest receipts from advance given to borrowers in different forms of loan. Banks advanced different loans in expectation of interest income and repayment of principals within a specified period or due date as per contractual obligations between client and banks. When payment of interest and repayment of loan is made by the borrower when it becomes due, is called performing assets or standard assets but the advance amount which fails to meet obligations of payment of interest and repayment of principal on due date is called nonperforming assets. Nonperforming assets (NPA) is one of the serious concern and problem for Indian banks specially PSU banks in India.
NPA is the indicator of level of risk and asset quality of a bank. A high level of NPA reflects high credit defaults that affect the profitability and net worth of bank. A growing NPA year by year involves reduction of incomes from the assets of bank.
In India NPA level of banks has reached to alarming level and this is seen high in public sector banks due to priority sector lending. A high NPA also show the mismanagement of assets by the management and fail to recover the loan from defaulters. Today main problem faced by public sector bank is huge NPA in their portfolio.
State Bank of India, well known for the biggest lender in India, has very high level of nonperforming assets in its portfolio. Though largest PSU bank of India and with efficient management, SBI facing serious problem of nonperforming assets and its amount of default is much higher than any other banks in India. This study mainly aims to compare the total advance, net profit and non performing assets and to test whether any significant correlation exist between this increasing net profit with nonperforming assets.
177
Copyright © 2016. Vandana Publications. All Rights Reserved.
A nonperforming asset (NPA) is a loan or anadvance where;
I. Installment of loan or advance and /or periodical interest remains overdue for more than 90 days in respect of term and condition of loan.
II. The overdraft/cash credit bank account of client is out of order for a period more than 90days. III. In case of bill purchase or discounted, it
remains overdue for a period more than 90 days.
IV. In case of loan for short duration crops, the installments of principal and /or interest on principal remain due for two crop seasons. V. In case of long duration crops, the principal or /
and interest thereon is remain due for one crop season.
VI. The amount of liquidity remains outstanding for more than 90 days in case of securitisation transaction undertaken in terms of guidelines on securitisation.
Banks should, classify an account as NPA only if the interest due and charged during any quarter is not serviced fully within 90 days from the end of the quarter. Any amount due to the bank under any credit facility is „overdue‟ if it is not paid on the due date fixed by the bank.
Classification of assets;
Banks are generally classified their NPA into the three categories depends on the time for which these assets are nonperforming and their realised ability; i. Substandard Assets
ii. Doubtful Assets iii. Loss Assets
Substandard Assets: With effect from 31 March 2005, a substandard asset would be one, which has remained NPA for a period less than or equal to 12 months. In such cases, the current net worth of the borrower/ guarantor or the current market value of the security charged is not enough to ensure recovery of the dues to the banks in full. In other words, such an asset will have well defined credit weaknesses that jeopardise the liquidation of the debt and are characterised by the distinct possibility that the banks will sustain some loss, if deficiencies are not corrected.
Doubtful Assets: With effect from March 31, 2005, an asset would be classified as doubtful if it has remained in the substandard category for a period of 12 months. A loan classified as doubtful has all the weaknesses inherent in assets that were classified as sub-standard, with the added characteristic that the weaknesses make collection or liquidation in full, – on the basis of currently known facts, conditions and values – highly questionable and improbable.
Loss Assets: A loss asset is one where loss has been identified by the bank or internal or external auditors or the RBI inspection but the amount has not been written off wholly. In other words, such an asset is considered uncollectible and of such little value that its continuance
as a bankable asset is not warranted although there may be some salvage or recovery value.
Types of NPA
Gross NPA: Gross NPAs are the sum total of all loan assets that are classified as NPAs as per RBI guidelines as on Balance Sheet date. Gross NPA is advance which is considered irrecoverable, for bank has made provisions, and which is still held in banks' books of account Gross NPA reflects the quality of the loans made by Banks. It consists of all the nonstandard assets like as sub-standard, doubtful, and loss assets. It can be calculated with the help of following ratio:
*Gross NPAs Ratio = Gross NPAs / Gross Advances Net NPA: Net NPAs are those type of NPAs in which the bank has deducted the provision regardingNPAs. Net NPA shows the actual burden of banks. Since in India, bank balance sheets contain a huge amount of NPAs and the process of recovery and write off of loans is very time consuming, the provisions the banks have to make against the NPAs according to the RBI guidelines, are quite significant. That is why the difference between gross and net NPA is quite high. It can be calculated by, Net NPAs = Gross NPAs – Provisions.
Cost of Nonperforming assets;
Non Performing Assets affect the profitability, liquidity and competitive functioning of banks and developmental financial institutions and finally the psychology of the bankers in respect of their disposition towards credit delivery and credit expansion. Non Performing assets cause high cost for the bank, as these assets do not improve Profits, Capital adequacy, Reduction of other costs and Capital market perception.
II.
REVIEW OF LITERATURE
In the context of Indian banking sector, the issue of NPA has been studied and observed by a number of scholars and researchers. Few latest synoptic review of the relevant literature on the topic of NPA has been as under;
“A Zahoor and DM Jagdishwaram (2013)were undertaken a research to study the NPA of nationalised banks, their comparative analysis among all nationalised banks, managerial inefficiency to control such NPA and the cost of NPA. In this study it was found that there is a upward trend of NPA in major nationalised bank”. – A comparative study of NPA management of Nationalised Banks (2013)” International Journal of Marketing, Financial Services and Management Research, vol-2, August 2013.
178
Copyright © 2016. Vandana Publications. All Rights Reserved.
in Indian banks is due to financial crisis and prioritysector loans by commercial banks. It was observed that bad debts in priority sector are higher than non priority sector loans.
D Banshal and Vivek Srivastav did a research study on trends of NPAs in major private sector banks of India (2012) in “A Study of trends of Non-Performing Assets in Private Banks in India” SHIV SHAKTI International Journal in Multidisciplinary and Academic Research (SSIJMAR) Vol. 2, No. 2, March-April 2012. In this study five years data were analysed in order to test whether there is positive trends and control of nonperforming assets. In this research paper it was found that the degree of NPAs continues with public sector banks in India compare to private commercial banks which were showed slight improvements in assets quality”
III.
OBJECTIVES OF THE STUDY
1. To highlight the nonperforming assets position and the trends of 19 Nationalised Banks in India for previous five years.
2. To study the comparative position of nonperforming assets against advances of Nationalised Banks.
Hypothesis of the study;
= There is no significant difference between Gross
NPA Ratio of Nationalised Bank.
= There is no significant difference between Net
NPA Ratio of Nationalised Bank
= There issignificant difference between Gross
NPA Ratio of Nationalised Bank.
= There issignificant difference between Net NPA Ratio of Nationalised Bank
IV.
METHODOLOGY OF STUDY
The study is based on secondary data retrieved from annual report of all 19 Nationalised Banks, RBI bulletin and information from Centre for Monitoring Indian Economy. The study is analytical in nature and its scope is limited to analysis of nonperforming assets of all nationalised banks covers the period of five years from 2011-12 to 2015-16. It examines the trends of gross nonperforming assets (GNPA) and net nonperforming assets (NNPA) and access the quality of NPA management. The data has been analysed using percentage method selected statistical tools such as arithmetic mean, Average Annual Growth Rate, standard deviation and tested using one way ANOVA.
V.
ANALYSISOF NPAs
Table: 01
Descriptive Statistics and Rank of Individual Bank (Gross Nonperforming Assets)
Bank 2011-12 2012-13 2013-14 2014-15 2015-16 Mean SD AAGR RANK Allahabad Bank 1.83 3.92 5.73 5.46 9.76 5.34 2.92 0.59 12 Andhra Bank 2.12 3.71 5.29 5.31 8.39 4.96 2.33 0.44 10 Bank of Baroda 1.53 2.40 2.94 3.72 9.99 4.12 3.38 0.69 06 Bank of India 2.34 2.99 3.15 5.39 13.07 5.39 4.45 0.62 13 Bank of Maharashtra 2.28 1.49 3.16 6.33 9.34 4.52 3.26 0.56 08 Canara Bank 1.73 2.57 2.49 3.89 9.40 4.01 3.11 0.61 03 Central Bank of India 4.83 4.80 6.27 6.09 11.95 6.79 2.65 0.31 15 Corporation Bank 1.26 1.72 3.42 4.81 9.98 4.24 3.14 0.71 07 Dena Bank 1.67 2.19 3.33 5.46 9.98 4.53 3.38 0.57 09 Indian Bank 2.03 3.33 3.67 4.40 6.66 4.02 1.71 0.36 04 Indian Overseas Bank 2.74 4.02 4.98 8.33 17.40 7.49 5.91 0.62 17 Oriental Bank of Commerce 3.17 3.21 3.99 5.18 9.57 5.02 2.67 0.35 11 Punjab National Bank 2.93 4.27 5.25 6.55 12.90 6.38 3.88 0.48 14 Punjab & Sind Bank 1.65 2.96 4.41 4.76 6.48 4.05 1.84 0.43 05 Syndicate Bank 2.53 1.99 2.62 3.13 6.70 3.39 1.89 0.36 02 UCO Bank 3.48 5.42 4.32 6.76 15.43 7.08 4.82 0.55 16
Union Bank of India 6.12 7.05 8.70 10.16 10.73 8.55 1.97 0.15 19 United Bank of India 3.41 4.25 10.47 9.49 13.26 8.17 3.77 0.50 18 Vijaya Bank 2.93 2.17 2.41 2.78 6.64 3.38 1.84 0.35 01
Interpretation:
Table 01 is the tabular arrangement of Gross NPAs ( Gross Nonperforming Assets) ratio of 19 nationalised banks for previous five years from 2011-12 to 2015-16 with necessary statistics arithmetic mean,
standard deviation (S.D.), average annual growth rate (AAGR) of gross nonperforming assets and rank of the individual banks based on five years average.
179
Copyright © 2016. Vandana Publications. All Rights Reserved.
during previous five years with average annual growthrate of 0.15 to 0.71. In the above table, all nationalised banks are ranked according to ascending order of their five years mean value. A low mean indicates low rank and a low rank indicates better in performance of NPA management compares to other sample banks. In simple we can say, lower the ratio better is the performance in nonperforming assets management and control.A low GNPAsratio is highly desirable in order to improve the profits of the banks.
Here the standard deviation measures the absolute dispersion or variability from the mean value. A small
S.D. value implies a high degree of uniformity or homogeneity in the data distribution and a high S.D. value implies low uniformity or heterogeneity in data distribution. In table 01, it is seen that the GNPAs distribution for the study period is more consistent in case of Indian Bank, Punjab & Sind Bank, Syndicate Bank, Union Bank of India and Vijaya bank compare to other nationalised banks. Bank of India, UCO Bank, and Indian Overseas Banks are few banks whose standard deviation was high in the study period.
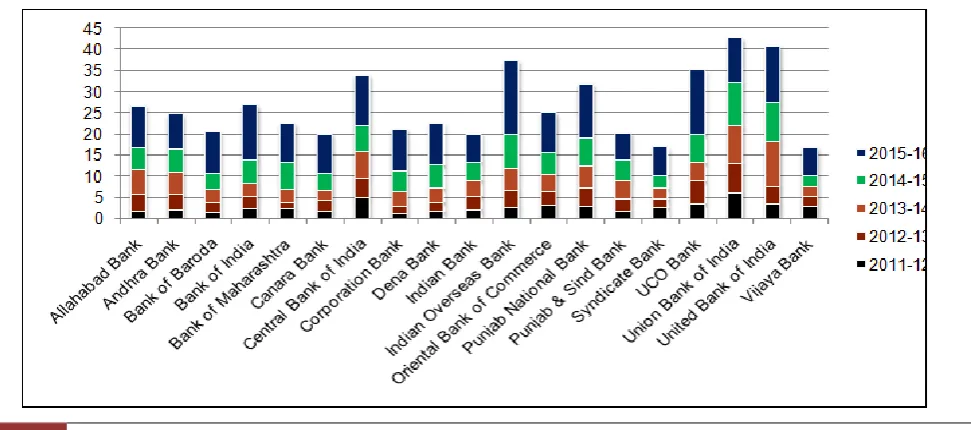
Chart:01
Table 01, supported by chart 01, shows thatVijaya Bank ranked first with lowest (3.38) GNPAs ratio followed by Syndicate Bank (3.39) and Canara Bank (4.01) at second and third position respectively. These three banks are holding top position among all nationalised banks for the study period. These three banks are shows better performance in NPAs management compares to other nationalised banks. On
the other hand, Union Bank of India holds bottom position followed by United Bank of India and Indian Overseas Bank. This is of course due to highest average GNPA ratio during the study period which indicates poor NPA management by these banks compares to other nationalised banks.UCO Bank, Punjab National Bank, Central Bank of India also showing a high mean during the study period.
Chart: 02
0 1 2 3 4 5 6 7 8 9
180
Copyright © 2016. Vandana Publications. All Rights Reserved.
Chart 02 is the year to year analysis of GNPAsratio of each individual bank. If we look at chart 02, it is seen that few bank has high GNPAs year to year while few banks kept GNPAs under control. Vijay Bank, Syndicate Bank, Punjab and Sind Bank, Indian Bank and Bank of Baroda have kept their nonperforming assets under strict control year to year and as a result their mean GNPAs are lower compares to other banks. Union
Bank of India, Indian Overseas Bank, UCO Bank, United Bank of India and Central Bank of India has high GNPA year to year, which also shows their inefficiency in NPA management.It is also seen from the table 01, supportedby chart 02, in the financial year 2015-16 almost all the nationalised banks bear high nonperforming assets compares to their previous year during study period.
Table: 02
Net Nonperforming Assets – Descriptive Statistics and Rank of Individual Bank
Bank 2011-12 2012-13 2013-14 2014-15 2015-16 Mean SD AAGR RANK Allahabad Bank 0.98 3.19 4.15 3.99 6.76 3.81 2.08 0.80 13 Andhra Bank 0.91 2.45 3.11 2.93 4.61 2.80 1.33 0.62 07 Bank of Baroda 0.54 1.28 1.52 1.89 5.06 2.06 1.75 0.86 02 Bank of India 1.47 2.06 2.00 3.36 7.79 3.34 2.58 0.59 11 Bank of Maharashtra 0.84 0.52 2.03 4.19 6.35 2.78 2.45 1.02 05 Canara Bank 1.46 2.18 1.98 2.65 6.42 2.94 1.99 0.54 08 Central Bank of India 3.09 2.90 3.75 3.61 7.36 4.14 1.83 0.31 15 Corporation Bank 0.87 1.19 2.32 3.08 6.53 2.79 2.27 0.69 06 Dena Bank 1.01 1.39 2.35 3.82 6.35 3.16 2.14 0.64 10 Indian Bank 1.33 2.26 2.26 2.50 4.20 2.51 1.05 0.37 04 Indian Overseas Bank 1.35 2.50 3.20 5.68 11.89 4.92 4.20 1.09 17 Oriental Bank of Commerce 2.21 2.27 2.82 3.34 6.70 3.47 1.86 0.36 12 Punjab National Bank 1.52 2.35 2.85 4.06 8.61 3.88 2.80 0.58 14 Punjab & Sind Bank 1.19 2.16 3.36 3.55 4.62 2.97 1.32 0.43 09 Syndicate Bank 0.96 0.76 1.56 1.90 4.48 1.93 1.49 0.60 01 UCO Bank 1.96 3.17 2.38 4.30 9.09 4.18 2.89 0.57 16 Union Bank of India 3.39 4.07 5.25 6.16 6.39 5.05 1.30 0.18 18 United Bank of India 1.72 2.87 7.18 6.22 9.04 5.41 3.04 0.62 19 Vijaya Bank 1.72 1.30 1.55 1.92 4.81 2.26 1.44 0.42 03
Interpretation:
Here, Table 02 is the tabular arrangement of Net NPAs ( Net Nonperforming Assets) ratio of 19 nationalised banks for previous five years from 2011-12 to 2015-16 with statistics arithmetic mean, standard deviation (S.D.), average annual growth rate (AAGR) of gross nonperforming assets and rank of the individual banks based on five years average.
From the above table it is seen that net nonperforming assets of few nationalised banks are in upward trend whereas few are in fluctuating trends
during previous five years with average annual growth rate of 0.18 to 1.09. In table 02, all nationalised banks are ranked according to ascending order of their five years mean value. A low mean indicates low rank and a low rank indicates better in performance of net NPAs management compares to other sample banks. In table 02, it is seen that the NNPAs distribution for the study period is more consistent in case of Indian Bank, Andhra Bank, Union Bank of India and Vijaya bank compare to other nationalised banks as their standard deviation is low.
181
Copyright © 2016. Vandana Publications. All Rights Reserved.
If we look at chart 03, supported by table 02, itindicates United Bank of India, Union Bank, UCO Bank, Indian Overseas Bank, and Central Bank of India have bear very high level of net NPAs during the study period. This shows that these banks have low control over their asset management and their necessary provisions are not enough to counter the effect of nonperforming assets. Due to low control over NPAs on
year to year basis which can be viewed from the above table, in one side banks net profit and free cash flows to equity were declined and on the other hand banks are under pressure to maintain sufficient amount of necessary provisions out of current profit to counter the effects of NPAs. Thus it is a double attack on bank earnings by nonperforming assets.
Chart: 04
Chart 04 is the year to year analysis of NNPAs ratio of each individual bank. If we look at chart 04, it is seen that Vijay Bank, Syndicate Bank, Indian Bank and Bank of Baroda have kept theirnet nonperforming assets under strict control year to year and as a result their mean NNPAs are lower compares to other banks. Union Bank of India, Indian Overseas Bank, UCO Bank, United Bank of India and Central Bank of India has high
NNPA year to year, which also shows their inefficient provisions to counter the effect of NPAs. It is also seen from the table 02, supported by chart 04, in the financial year 2015-16 almost all the nationalised banks bear high net nonperforming assets compares to their previous year during study period and this is due to high Gross NPAs in the same year of each individual bank.
Table: 03
Banks Rank
( GNPA) Rank (NNPA)
Average Overall Rank
Allahabad Bank 12 13 12.5 11
Andhra Bank 10 07 8.5 07
Bank of Baroda 06 02 4 03
Bank of India 13 11 12 10
Bank of Maharashtra 08 05 6.5 05
Canara Bank 03 08 5.5 04
Central Bank of India 15 15 15 13 Corporation Bank 07 06 6.5 05
Dena Bank 09 10 9.5 08
Indian Bank 04 04 4 03
Indian Overseas Bank 17 17 17 15 Oriental Bank of Commerce 11 12 11.5 09 Punjab National Bank 14 14 14 12 Punjab & Sind Bank 05 09 7 06
0 5 10 15 20 25 30
2015-16
2014-15
2013-14
2012-13
182
Copyright © 2016. Vandana Publications. All Rights Reserved.
Syndicate Bank 02 01 1.5 01
UCO Bank 16 16 16 14
Union Bank of India 19 18 18.5 16 United Bank of India 18 19 18.5 16
Vijaya Bank 01 03 2 02
Table 03 is represents composite ranks based on the average of GNPAs and NNPAs mean ratio rank. The rank assigned on the basis of average of earlier two ratios and this final rank indicates the real performance of banks. A low composite rank is better performance in lending policy and asset quality management.
In the above table, Syndicate Bank is at the top position followed by Vijaya Bank second position. Some banks got same ranks which shows same performance
level in NPAs management. United Bank of India and Union Bank of India, which got same 16th rank, are at the bottom level in NPAs management followed by Indian Overseas bank, UCO Bank and Central Bank of India, which indicates low performance of these banks. Some other nationalised banks with good performance are Bank of Baroda, Indian Bank, Canara Bank, Corporation bank and bank of Maharashtra which indicates their good performance in NPAs management.
Table: 04
ANOVA( Using SPSS)
GNPA Sum of Squares Df Mean Square F Table Value
Between Groups 242.884 18 13.494 1.205 1.74
Within Groups 839.569 76 11.194
Total 1082.453 94
Table 04 shows that calculated value of F is 1.205 which is lower than table value of 1.74 at 5% level of significance and degree of freedom (d.f.) 18, 76. Thus null hypothesis is accepted. Here it may be concluded that there isno significant difference between Gross
NPAs ratio of nationalised banks. This shows that nationalised banks are having same level of Gross NPA‟s and shows same efficiency in management of Gross NPAs, and quality of their assets.
Table: 05
ANOVA (Using SPSS)
NNPA Sum of Squares df Mean Square F Table Value
Between Groups 91.738 18 5.097 1.024 1.74
Within Groups 378.017 76 4.974
Total 469.755 94
Table 05 shows that calculated value of F is 1.125 which is lower than table value of 1.74 at 5% level of significance and degree of freedom (d.f.) 18, 76. Thus null hypothesis is accepted. Here it may be concluded that there is no significant difference between Net NPAs ratio of nationalised banks. This shows that nationalised banks are having same level of Net NPA‟s and shows efficiency in management of Net NPAs, and quality of their assets.
VI.
CONCLUSION
The study throws light on the levels of nonperforming assets of all nineteen nationalised banks
183
Copyright © 2016. Vandana Publications. All Rights Reserved.
NPA is the major problem for banking industrytoday. The reason behind nonperforming assets are loan defaults by borrowers, improper credit appraisal system of bank, poor monitoring of recovery , priority sector loan and some government policies. NPAs affect a bank’s performance from double side ie it reduces the interest incomes of the banks and banks has to maintain necessary provisions against NPAs and so on. Hence steps should be taken by banks to reduce NPAs in efficient manner.
REFERENCES
[1] Parul and Sandeep (2012)- “Nonperforming Assets – A comparative position of public and private banks in India”, International Journal of Business Management, vol 2, 2012.
[2] Deepk Banshal and Vivek Srivastav (2012)- “ A study of trends of NPAs in private sector banks in India”, Shiv Shakti International journal of
multidisciplinary research, vol 2, 2012 ( ISSN 2278-5973).
[3] A Zahoor and DM Jagdishwaram (2013)– “A comparative study of NPA management of Nationalised Banks (2013)” International Journal of Marketing, Financial Services and Management Research, vol-2, August 2013.
[4] H.P.Mahesh and Rajeev in “A Study on Commercial Banks: Banking reforms and NPA” in working paper no. 252 (2010), Institute of Economic and Social Change, Bangalore.
[5] Ramesh.K.V, Sudhakar.A, “NPA Management in Public Sector Banks: A Study of Canara Bank and State Bank of India”, International Journal of Research in Commerce & Management, Vol. 3(11), 2012, ISSN 0976-2183
Reference Books;
[1] D M Mittal,”Money, Banking, International Trade and Public Finance (Eleventh Edition)”, Himalaya Publishing House.

![Extracting lexico semantic relations from specialized corpora using a word space model (Analyse distributionnelle de corpus spécialisés pour l’identification de relations lexico sémantiques) [in French]](data:image/gif;base64,R0lGODlhAQABAIAAAP///wAAACH5BAEAAAAALAAAAAABAAEAAAICRAEAOw==)