Abstract — Several mobile acceptance models exist today that focus on user interface handling and usage frequency evaluation. Since mobile applications reach much deeper into everyday life, it is however important to better consider user behaviour for the service evaluation. In this paper we introduce the Behaviour Assessment Model (BAM), which is designed to gaining insights about how well services enable, enhance and replace human activities. More specifically, the basic columns of the evaluation framework concentrate on (1) service actuation in relation to the current user context, (2) the balance between service usage effort and benefit, and (3) the degree to which community knowledge can be exploited. The evaluation is guided by a process model that specifies individual steps of data capturing, aggregation, and final assessment. The BAM helps to gain stronger insights regarding characteristic usage hotspots, frequent usage patterns, and leveraging of networking effects showing more realistically the strengths and weaknesses of mobile services.
Keywords — Mobile services, technical acceptance model, log-data analysis, human-computer interaction
I. INTRODUCTION
SER acceptance in field trials is still mostly evaluated through questionnaires and focus interviews. Mobile applications are, however, much stronger related to real mobile behaviour as people carry their devices with them. Because of the dependency of mobile applications’ functionalities on the user situation answers to general questions about the application can often not easily be given.
A relative new approach for mobile services is the observation of application usage through data loggers. A data logger records application events or errors jointly with other usage or system related metadata. To support daily activities successfully, mobile applications should not interrupt the activities, provide a reasonable interaction/benefit ratio to the user, and provide community leveraging beyond exploitation of personal experience. Analysing usage hotspots, usage frequency and usage type allow researchers to speculate about potential strengths, weaknesses or even problems for the surveyed service.
In this work, we present a behaviour assessment framework
that describes the systematic collection of behaviour data and guides researchers in their log data analysis. With such an analysis approach researchers can gain more insights about first and long term service impressions, acceptances issues correlated with the user experience and the success of subsequent product evolvement steps.
The article is structured as follows. The next section discusses related works. Section 3 describes the method how to capture, aggregate, and represent data. In Section 4 the behaviour assessment model is defined. A preliminary case study is given in Section 5. Section 6 concludes the article.
II.RELATED WORK
In order to perform a study focused on mobile services the first step is to compare, analyse and find the differences and connections between existing data loggers, concepts and conclusions related to the mobile services evaluation field.
Lab-based evaluation frameworks log information in a controlled environment using specific devices and specific users. The main advantages of the lab-based frameworks are the highly controllable environment and the collection of data, which is cheap and easy. However, the context, which is the most influential factor in the mobile services field, is not considered and it can hardly be simulated. Many simulation tools produce highly inaccurate results because of the context. Furthermore, several agents also alter the results of user experiments. The experts who lead the experiment and the tasks performed by the users can not only alter the execution of experiments but also evoke situations that would never happen in real environments. The users may also add biased results during the execution of the experiments [1] because they suffer several problems such as test-anxiety [1]: during the task performance the highly test-anxious person divides his attention between self-relevant and task-relevant variables; due to the self-focussed attention the user of the mobile service may not show real behaviour. Further, in many tasks such as phone calls, it would be subjectively annoying for many users to be in a room with observing researchers.
On the other hand the field-based evaluation frameworks (see Table 1) capture information in real environments. They commonly use added cameras and human observers to capture
Analysis of Log File Data to Understand
Mobile Service Context and Usage Patterns
Bernhard Klein, Ivan Pretel, Sacha Vanhecke, Ana B. Lago and Diego Lopez-de-Ipiña,
DeustoTech –Deusto Institute of Technology, University of Deusto, Bilbao, Spain
Department of Electronics and Information Systems, Ghent University,
Belgium
information from the interactions. Furthermore, this kind of framework tries to bring the lab to the field. For example, the Usertesting platform [2] not only brings methods like the think-aloud verbal protocol but also records the user’s feedback with a webcam; finally it reproduces the interaction again enabling the annotations during it. Using this kind of techniques means that although the task is performed in real environment, it is changed and consequently, the interaction altered. Another tool related to Usertesting is the Morae Observer [3] tool. It captures all the interaction data and indexes it to one master timeline for instant retrieval and analysis; it generates graphs of usability metrics. Both tools are focused on the interaction because they are centred on capture of screen interaction and the user’s feedback through filming the face or recording comments. Another group of tools such as ContextPhone [4] and RECON [5] are focused on the context capture. They capture the surrounding environment through mobile sensors. This capturing technique retrieves a lot of real data without influencing the interaction but the user’s feedback is lost. In order to fill the lack of the user’s feedback other tools like MyExperience [6] and SocioXensor [7] use techniques like self-reports, surveys and interviews mixed with the context capture. These tools are quite powerful and flexible because the user has at any time the complete control about when participate in an application acceptance survey. In case, he has been interrupted in the survey he can resume it to a later point of time.
To sum up, to acquire valid interaction data about mobile services, it is essential to capture objective information to solve questions like when, where, how long, etc. users are really interacting with a service. These questions can hardly be determined with a lab-based framework. The field-based
evaluation frameworks can provide deeper and more objective information, but the added agents such as cameras and invasive evaluation methods (e.g. think-aloud verbal protocols) have to be removed. In order to do so, the best way to capture interaction data is by registering information through a mobile device using a tiny capture tool. This tool should log the context via the built-in mobile sensors and logging the key interaction events.
III. MOBILE SERVICE ASSESSMENT THROUGH BEHAVIOR
ANALYSIS
A framework for automatically logging and processing data for evaluation has been developed. In the following we briefly explain the different behaviour capturing and aggregation phases and the architectural requirements.
A.Data Logging and Aggregation Overview
As can be seen in Fig. 1 the framework distinguishes four main phases:
1. Data Capture: A data logger component installed separately on the mobile device records event and error data triggered by the mobile service. Examples for logging data are: service start and stop times, UI events e.g. buttons pressed, screen transitions, any changes in settings and erroneous data entries, exceptions and any unexpected system behaviour. These data are complemented with additional user contexts (e.g. provider and subscriber data), service information (e.g. queries/results, content data, screen stay duration) and device contexts (e.g. location data) for further evaluation.
TABLEI
PROPERTIES FOR THE LOGGING TOOLS
Tool Capture Techniques Data Report
Usertesting Screen, webcam and microphone Interaction, user information and user’s feedback
Reproduce the screen interaction
Morae Observer Screen, webcam and microphone, observer Interaction, user information and user’s feedback
Reproduce the interactions and calculate graphs
ContextPhone Mobile sensing and interaction event logging Interaction, device status and environment
Mobility patterns detection
RECON Interaction event logging and mobile sensing Interaction, device status, user information, user’s feedback, and environment
Trace Data analysis Engine
MyExperience Wearable hardware sensing, mobile sensing, audio recording and user surveys
Interaction, device status and environment
Performance analysis, SMS usage and mobility analysis SocioXensor Interaction event logging, survey, interview Interaction, user, device status
and environment
SQL database
2. Transfer Protocol: Logging data is periodically (e.g. daily) transferred to an analysis component hosted on the Internet. To minimize the influence on mobile service performance the transfer process is only started if the mobile device remains in an idle execution state.
3. Data Aggregation: The analysis component parses the incoming logging data and interprets the raw data log format
with a parser. A filter process removes out-of-bound values, spatio-temporal inconsistencies, and entries that do not conform to preset criteria. Following this filtering step the log data are aggregated through clustering analysis.
written out for human readability and annotated to get basic derived information such as duration and transitions.
Fig. 1. Graphical description of the data logging, visualization and aggregation process.
B.System Architecture
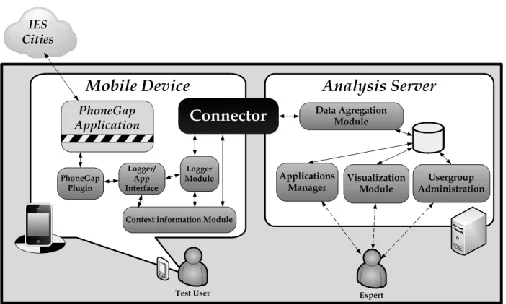
The Neurona evaluation framework [8] was extended to meet the BAM requirements. This platform shown in Fig. 2 is based on three main components: the mobile device component, the connector component, and the analysis server component.
The Mobile Device component is software installed in the user’s mobile and logs user interactions; it is formed by the Logger/App interface, Logger Module and Context Information Module. The Logger/App interface is a tiny software library used to send interaction events to the logger module. The logger module stores the interaction data and shows brief questionnaires about the interaction experience to capture the user’s feedback; these questionnaires are shown at the end of the interaction to not disturb the experience. Another element is the context information module, which provides context information acquired from the built-in mobile sensors and the mobile Operative System.
The Analysis Server component is hosted in a web server; this component is formed by the Data Aggregation Module, the Visualization Module, the Applications Manager and the Usergroup Administration. The Data Aggregation Module receives logged data and calculates normalized information to store it in the system database. The expert who wants to check the normalized information can do it using the Visualization Module; which shows advanced graphs. The Applications Manager enables the expert to register into the system, update and remotely configure prototype applications. The Usergroup Administration module registers users and devices, assigns applications and exposes several administration options related to the relations between users, applications and experts.
Finally, the connector between the explained elements transfers the logged information generated by the Mobile Device component to the Analysis Server component. It is divided in two main elements: the mobile interface and the server web service. Basically the mobile interface checks the state of the device and if the user is not interacting with the device it sends logged data to the web service hosted in the
Analysis server. To minimize the required transfer bandwidth logging data is encoded in memory saving format and decoded later to a human readable format when the logging data has been received by the Analysis Server.
Fig. 2. System architecture of Neurona Tool.
C.Integration with IES Cities through PhoneGAP
For the IES Cities project the Neurona framework has been extended with an additional integration plugin using the PhoneGap tool. The IES Cities mobile applications are developed using the PhoneGap technology. PhoneGap is a framework for building cross-platform mobile apps with standards-based Web technologies. Developers who use PhoneGap may only use HTML, CSS, and JavaScript to implement several applications to remotely access existing backend and cloud processes while the device is connected to the Internet. In particular, thought this framework the developed applications which can access to the IES Cities services.
Among the variables which are relevant to the model presented by this work several sources for completing the model information should be studied as well as the different kind of information sources which can be found inside a mobile device (in particular, in Android OS operating system devices). It is important to mention that this model captures and handles sensitive information (e.g. location of the user). Consequently, applications which use BAM model should ask for several Android permissions: The INTERNET permission to open network sockets, check the weather and upload the
logged information to the main server. The
ACCESS_FINE_LOCATION permission to access precise location from location sources such as GPS, cell towers, and Wi-Fi. The RECORD_AUDIO permission is used to measure the noise level. With ACCESS_NETWORK_STATE our capturer accesses detailed information about networks. Finally, the ACCESS_WIFI_STATE permission is used to retrieve information about Wi-Fi networks.
contains functions to call from the IES Cities mobile application and log interaction events, including the current context. There are two main steps to including the developed plugin in IES Cities mobile application: referencing the explained JavaScript file and importing the native code (the extended Neurona evaluation framework library) that will be called through the JavaScript file.
This plugin has only 6 main functions: log_start_task, log_pause_task, log_resume_task, log_end_task, log_interaction and log_error. These functions capture the timestamp of the interaction, the current context and the object with witch user is interacting. They only require three parameters: the event type, which will be explained bellow, the identification of the visual structure for a user interface and last but not least, the object (i.e. buttons, textboxes…) the user is interacting with.
A task can pass through four main states: When a task is not started yet (NOT STARTED), when a task is started and its user is interacting to achieve the goal of the task (STARTED), when a task is started but its user is not interacting to achieve it (PAUSED) and when the task is finally terminated (END). After seeing the main states we will see several events which can be triggered to change the state of a task, these events should be generated by the mobile applications using the plugin functions. During a task performance a user can trigger two main events: START_TASK (at the beginning of the task: log_start_task) and END_TASK (at the end of the task: log_end_task). Additionally but not compulsory there exist two others: if user leaves the task (e.g. because of an incoming phone call) PAUSE_TASK event (log_pause_task) is produced. Where user decides to continue the task RESUME_TASK event (log_resume_task) is triggered. When a task is started two events related to the interaction of the user can be triggered. The INTERACTION event (log_interaction) means that a user is interacting in the right way. This event should be triggered when a user is achieving little microchallenges inside the goal of the task. The ERROR event (log_error) means that a user has made a mistake during the interaction process.
IV. THE BEHAVIOUR ASSESSMENT MODEL
A proven performance assessment method considering concurrent aspects has been the Balanced Scoreboard (BSC) approach. Aligning each of the dimensions systematically helps get a better impression about different influencing factors.
A.Dimensions of the Behaviour Assessment Model
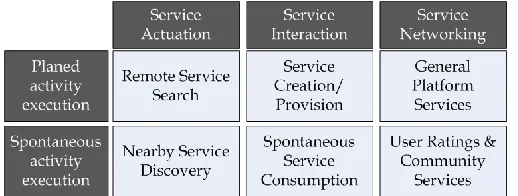
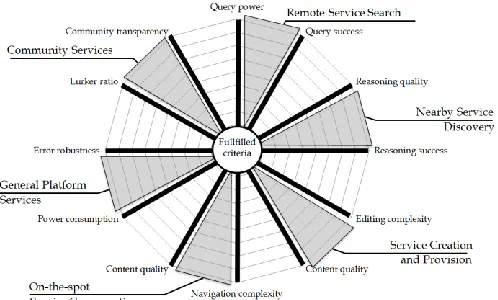
This leads to following six different dimensions illustrated in Fig. 3:
1. Remote service search: This dimension is based on the categories Planned Execution Scenario and Service Actuation. In order to fulfill end-users need to plan activities ahead of a trip; users require the capability to explore the service offer according to given properties. The retrieval quality depends on
the query power e.g. different search concepts and the query success rate. An example is a map based discovery tool, which retrieves services according to locations selected on a map.
2. Nearby service discovery: The dimension founds on the categories Spontaneous Execution and Service Actuation. As mobile services are much stronger correlated with the daily life of end-users an important requirement is to raise their attention to an adequate service offer in a seamingless manner. A successful implementation depends on the reasoning power (that compare the current users’ context and the intended service context) and the number of directly consumed services (reasoning success).
3. Service creation/provision: The categories Planned Execution and Service Interaction define this dimension. Complex mobile services require often too much knowledge from the user to execute them easily on the spot. Therefore, services should offer any type of service creation, personalization or reservation functionality so that they can be consumed better in time constrained situations. The editing complexity and the service content quality are important indicator examples to determine this dimension.
4. On-the-spot service consumption: The dimension is constructed through the categories Spontaneous Execution and Service Interaction. Since users on the move often follow other real-world activities it is important that the attention needed to execute the service is kept to an absolute minimum. The navigation complexity (effort) and the quality of the content provided by the service are important indicator examples.
5. General platform activity services: This dimension stems from the categories Planned Execution and Central Provision. All general service aspects influencing the provision quality e.g. power consumption and error handling account for this dimension.
6. Community services: This dimension is founded on the category Spontaneous Execution and Community Networking. Tools that consider community behaviour can help in structuring the knowledge space further and lead to more transparency in the community. Examples are best-of ranking lists, member reputation lists and content recommender systems. For instance car sharing opportunities can be more easily evaluated by users and improve their selection. Suitable example indicators are the lurker ratio (active community participation) and the degree of community transparency achieved with previously mentioned community services.
B.The Balanced Scoreboard Assessment Approach
These six dimensions focus on realistic service usage. This emphasises the valuation of a service by the way how end-users apply services to solve given problems. Such behaviour patterns have the potential to tell us about underlying reasons why specific service fail or become well accepted. Recording such behaviourally relevant data also allow the emulation of service usage in respect to given user´s context. Both aspects are important for developers to continuously improve the service. According to the BSC approach, the intention is to find a few aggregated indicators that quantify a given dimension. The indicator must meet the requirements of reasonability and measurability. A general problem of social surveys is to translate the indicators into precise measures. The abstract classes of measurement types, correspond hereby with different event and error logging data types. To achieve comparability between different numerical scales of measurements e.g. an event/error frequency scale, a function has to be defined which maps selected scale areas on specific quality rating values. Since humans perceive the influence of various indicators for a given dimension differently, weight coefficients are used to balance the influence of individual indicators. Both mapping function properties and weight coefficients can be obtained through a profiling questionnaire prior to the field trials.
Finally, the results of an analysis and evaluation are typically held in a spreadsheet for detailed analysis and visualised by a radar chart for a summarised representation (see Fig. 4). For visualization by a radar chart, the six dimensions are equally arranged. The scaling is adapted appropriately according to the distribution of the measurement results with its positive orientation towards the origin. For a better visualisation of the consequences of the results, each scale can be subdivided in fulfilled (positive centre areas), and not fulfilled (negative edge areas).
Fig. 4. Visualization of the behavior model with six dimensions (grey color) and example indicators (black color).
V.THE IESCITIES PROJECT
The IES Cities project aims at providing an open platform so that users are able to use, produce and provide information for internet-based services improving their knowledge about
the cities they live. The project represents an extension of other European projects (see m:ciudad, MUGGES, and uService) focusing on service creation, mobile peer-to-peer services, and the integration of open linked data sources. Open linked data refers here to a concept of publishing structured data e.g. pollution data provided by the local government so that it can be interlinked and become more useful. City services, created and provided through the platform enable citizens to wrap this type of data. They adapt to the current context of a citizen through smartphone embedded sensors. End-users may not only to receive information from the city but also generate real-time content which complements, enriches and updates the data available through the open data model associated to the municipality. These services are intelligent as they come with business logic to automate the management of parking spaces, public transport, pollution, health states and many other aspects of urban life, user interactions are eased and automated. In order to facilitate its usage the platform will be provided as mobile and web-based platform. It is assumed that sensor networks are already deployed in the cities and become integrated as part of the project.
In the following the screen interaction model for the IES-Improve Your Neighbourhood service is exemplarily explained (see Fig. 6). This screen model includes screen sequences for querying the appropriate IES services (dashed box), creating and consumption of IES services and the service/report rating. In order to create or view IES-Improve Your Neighbourhood reports users first have to query for adequate IES service. After selecting the IES-Improve Your Neighbourhood service, users can decide a) to create a new report, b) look for and c) rate existing reports. The IES service obtains user data through the screen, retrieve sensor data to personalize IES service and open linked data to provide up to date content.
VI. CASE STUDY OF THE IESCITIES PROTOTYPE
A.The Assessment Process
Applying the BAM analysis technique requires specific preparation steps. These include the definition of indicators for each dimension, correlating them with available logging data, appropriate balancing of these measurements with weight factors, the execution of field trials and representing the results. Fig. 5 gives a complete overview about the evaluation process.
Fig. 6. Screen flow graph of IES – Improve Your Neighbourhood Service
In the following specific modifications to the BAM model in respect to the IES Cities project are presented:
Adaptation of indicator structure. First, adequate indicators have to be identified which align with the specific dimension of the BAM model. The IES service interaction model considers six different behavior dimensions in accordance with the BAM model. These include activites to trigger city services through seach and discovery functions, activites for the service creation, provision and consumption and finally rating functions to exploit further networking effects on the service and report level.
Assignment of logging data types. In this phase, logging data types are correlated with the indicators. During the prospective field trial, the Neurona Framework will obtain application and sensor data by plugging into the IES player through the PhoneGAP tools.
For the dimension service remote search and nearby service discovery, the query success rate and the average result quality are relevant indicators. Therefore the number of queries issued before a service is consumed (query success rate) is counted. The result quality can be measured by the average distance between the current user location and the location to which the report has been assigned. Hereby it is assumed that reports related to a given issue closer to the user a more relevant. The dimension service creation/provision and consumption is determined by the indicators editing/viewing complexity and service quality. The editing/viewing complexity is closely correlated with the time a user spends to create/provide and consume services. Therefore, the logger obtains timestamps when ever an editing and consumption screen flow is started and ended. The average duration of the editing/viewing process can later
be correlated the process complexity and even reveal if a given process has been interrupted. The dimension General Platform Services is defined by the indicators power consumption (measured as consumed energy units per day) and error recovery quality (reciprocal number of occurred errors per day). And finally, the dimension community services are defined by the lurker ratio (measured as provider-consumer ratio of a consumed service) and the consumed service quality (measured through average rating of consumed services).
Analysis and evaluation. Generally an iterative evaluation approach is recommended starting from early prototypes up to the final mobile service. In order to compare the development progress it is important not to vary the measurement criteria. It is assumed that the explanatory power of the BAM model increases with a stronger concretization of the mobile service during the development cycle. All these logging data types have different value ranges. For future evaluation it is important to translate these into an given grading scheme. This is usually achieved through mapping functions which assign chosen value ranges to specific grade value. A series of experiments will therefore be conducted in the laboratory as soon as the IES platform has been completed. Parameterized aggregation services at the Neurona framework will then automatically convert the cleaned logging data to the adequate grading format. Since the previously specified indicators contribute to the successful execution of service with varying degree it is important to specify adequate weighting factors. It is therefore mandatory to learn more about the characteristic service behaviour.
order to compare these to the empirical results. Then, initial and long-term service usage should be compared in order to identify entry barriers. Correlated with this analysis, is the grouping of logging data according to the technical technical experience (see technical adoption model described by Rogers [12]). By comparing innovators, early adopters, early majority, late majority and laggards a reasonable priority list of future service modifications can be determined. Finally it is also important to analyse logging data from different trials in order to see to what extend applied service modifications have led to an acceptance improvement.
B.Visual Evaluation of IES Cities
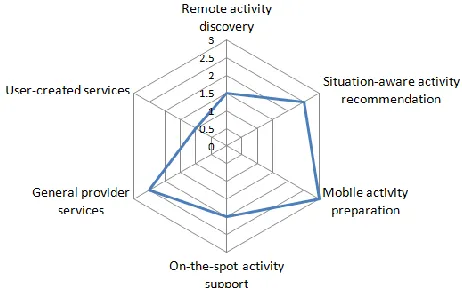
We emulate the advantages of the IES Cities project based on logging data obtained during the field trial executed for the MUGGES project. In this field trial logging data from 30 potential end-users have been collected during a two week period. Each study participant was given a mobile phone with the previously developed MUGGES software installed. The users were given specific tasks e.g. to describe preferred pathways by providing reports for favorite point of interests. The connector component transfers periodically event data to the analysis server for further evaluation.
Applying the BAM approach (with a rating range from 0 – very good till 3 very bad) a service provider can come, for example, to the following simplified conclusions concerning the explained dimensions in Section 4:
Remote activity discovery: With increasingly more created services users applied more sophisticated search approaches (keyword-based and map-based search) to compensate the small screen size. The discovery function seems to work well for the majority of the trial users (rating 1.5).
Situation-aware activity recommendation: The overall distance between the location assigned for a selected service and the trial user has been quite far (up to 1 km). Besides the sparse distribution of the provided services another reason has been the bad performance of the location technology. Provider could conclude that the recommendation service is not sufficient (rating 2.5) for the current spontaneous usage scenario.
Mobile activity preparation: The service creation process took a lot of time, not short enough to create mugglets on-the-go. People compensated this by distributing the creation process in several phases. The mobile activity preparation is not sufficient (rating 3.0) in the current development stage.
On-the-spot activity support: The services in general have high information quality for the user, as they come with a environment map, text descriptions, comments and photos. Above that, the real-time notification feature helped people to stay up-to-date. Provided services thus have been very useful (rating 1).
General provider services: The peer-to-peer service sharing approach has lead to an high power consumption and the error rate has been quite high. Service provider may conclude that the execution of shared services in the Internet cloud may be a better option.
User-created services: Platform usage has been high since users could create their own personal service based on the offered service templates. Especially in later stages during the project service ratings have been found very useful (rating 1) to identify popular services or confirm reports.
The radar graph shows some important weaknesses. Recommender systems, the mugglet creation process and the provider infrastructure still make an everyday usage difficult (see Fig. 7). Comparing these logging data results with the questionnaires conducted after the trial backs these findings. But more importantly, user perceptions were not always clear enough to pinpoint the exact problems with the platform infrastructure. The evaluation with the BAM is more differentiated and considers some critical aspects that influence the acceptance of this mobile service significantly.
Fig. 7. Evolution of the IES Cities based on MUGGES logging data.
VII.CONCLUSIONS AND FUTURE WORK
We introduced the BAM as an instrument for the analysis and evaluation of the user acceptance for mobile services. The BAM is characterised by a structure that helps to identify systematically a balanced set of important, individually measurable and independent acceptance criteria. The application of the BAM is guided by a process model that supports all phases from the development of acceptance criteria over the measurement of relevant indicators to the evaluation and visualisation of the derived results. Using the BAM reveals several insights:
First and permanent usage patterns. Analyzing the radar
graph at the beginning of the trial and later phases of the trial shows can show entry barriers of the mobile service. Results obtained in later stages show how people exploit mobile service strengths but also compensate potential weaknesses of the service.
Usage patterns for different technical adoption groups.
majority, late majority and laggards. Clustering logging data according to these groups may reveal interesting insights how the technical experience influences service usage. These observations are especially valuable to define a priority of feature improvements for the mobile service.
Behaviour changes in different product development stages.
As the development of the mobile service evolves comparing results with earlier trials can help to confirm if the applied feature modifications fulfil the intended improvements.
REFERENCES
[1] U.-D. Reips, S. Stieger: Scientific LogAnalyzer: A Web-based tool for analyses of server log files in psychological research. Behavior Research Methods, Instruments, & Computers, 36, pp. 304-311 (2004)
[2] J.C. Cassady, R.E. Johnson: Cognitive Test Anxiety and Academic Performance. In: Contemporary Educational Psychology 27, pp. 270--295 (2002)
[3] UserTesting.com - Low Cost Usability Testing, http://www.usertesting.com
[4] Morae usability testing tools from TechSmith, http://www.techsmith.com
[5] M. Raento, A. Oulasvirta, R. Petit, H. Toivonen: ContextPhone: A Prototyping Platform for Context-Aware Mobile Applications. In: IEEE Pervasive Computing 4, 2, pp. 51-59 (2005)
[6] K.L. Jensen: RECON: Capturing Mobile and Ubiquitous Interaction in Real Contexts. In: Proceedings of MobileHCI 2009, Bonn, Germany. (2009).
[7] J. Froehlich, M.Y. Chen, S. Consolvo, B. Harrison, J.A. Landay: MyExperience: A System for In situ Tracing and Capturing of User Feedback on Mobile Phones. In: MobiSys’07, June 11–14, 2007, pp. 57--70. ACM, San Juan, Puerto Rico, USA (2007)
[8] H. ter Hofte, R. Otte, A. Peddemors, I. Mulder, What's Your Lab Doing in My Pocket? Supporting Mobile Field Studies with SocioXensor. In: CSCW2006 Conference Supplement, Nov. 4-8, Banff, Alberta, Canada (2006)
[9] I. Pretel, A.B. Lago, Capturing Mobile Devices Interactions Minimizing the External Influence. In Proc. of UBICOMM, pp. 200-205 (2011).
[10] Ajzen, Icek (1 December 1991). "The theory of planned behavior". Organizational Behavior and Human Decision Processes 50 (2): 179–211.
[11] M. Colbert, A diary study on rendezvousing: Implications for position-aware computing and communications for the general public, In Proc. of Group Conference (2001)
[12] B. Klein, J. Perez, C. Guggenmos, O. Pihlajamaa, I. Heino, & J. Ser (2012). Social acceptance and usage experiences from a mobile location-aware service environment. In J. Ser et al. (Eds.), Mobile lightweight wireless systems (Vol. 81, p. 186-197). Springer Berlin [13] E. M. Rogers, Diffusion of Innovations, Glencoe: Free Press (1962).
Bernhard Klein received his diploma degree in Computer
Science from the Technical University of Munich and the Ph.D. degree from the University of Vienna. During his doctoral studies he has worked as research assistant and lecturer at the Institute of Distributed and Multimedia Systems at the University of Vienna. Prior to the University of Vienna he has worked with Siemens Corporate Research, where he participated in several research projects for multimedia and video collaboration, annotation and archiving. In June 2009, he joined the Mobility Research Lab (MoreLab) at the University of Deusto, where he participated in several European projects and projects supported by the Spanish government. He has published several articles in various conferences and workshops in the field of mobile peer-to-peer systems and groupware systems.
Ivan Pretel was born in Arrigorriaga, Spain.He received the Bachelors degree in computer engineering, the Masters degree in development and integration software solutions from the University of Deusto, Bilbao, Spain, where he is currently pursuing the Ph.D., focusing his research on fields related to human-computer interaction, quality in use, advanced mobile services and 2.0 services. His engineering studies he complemented his knowledge by working in the Architecture Department of a software company, responsible for managing the internal software platform of a well-known savings bank. After completing his engineering studies, he received the Best End-Term Project Award. He began his research career in the Deusto Foundation where he started as a research intern in the mobile services area, participating in various projects related to system architecture and Human Computer Interaction. He is currently a Researcher with the DeustoTech - Deusto Institute of Technology.
Sacha Vanheckeis master student in Computer Science
with a specialization on Software Engineering at the Ghent University. Since 2011 he holds Bachelor degree in Informatics. Based on his experience in semantic web technologies, mobile web applications and computer vision, he is finishing his diploma thesis at the University of Deusto, where he participates in an Erasmus Exchange Program. Based on the prototype platform developed in the MUGGES project he ported and enhanced the first version of the IES Cities platform.
Ana B. Lago was born in Bilbao, Spain. He received the Ph.D. degree in computer science and engineering from the University of Deusto. She is currently a Professor with the Department of Telecommunications, as a member of the Faculty of Engineering of the University of Deusto. She is a Researcher with the MoreLab Research Group, Deusto Institute of Technology – DeustoTech Deusto University. She is the Director of the Ikertia classroom, consequence of an agreement between the University of Deusto and the Ikertia Foundation. She manages and coordinates several multidisciplinary research and development projects in software engineering and mobile services areas. Her current research interests where she has managed and coordinated at different levels numerous national and European projects, are e-learning technologies, Mobile Web, Social Mobile Services and Social Networks. She has participated in national and international conferences.
Diego López-de-Ipiña is an Associate Professor/Reader at