590
Copyright © 2011-15. Vandana Publications. All Rights Reserved.
Volume-5, Issue-2, April-2015
International Journal of Engineering and Management Research
Page Number: 590-594
Heart Rate Monitoring System Using Lab View
S. Tony Manasa1, Y. Sneha2, Sajeeda Sultana3, V. Srija4, S. Munavvar Hussain5, M.C. Chinnaiah61, 2, 3,4,5,6
Department of ECE, BVRIT-Narsapur, INDIA
ABSTRACT
In this paper, we presented the design and development of a new integrated device for measuring heart rate using fingertip to improve estimating the heart rate. As heart related diseases are increasing day by day, the need for an accurate and affordable heart rate measuring device or heart monitor is essential to ensure quality of health. However, most heart rate measuring tools and environments are expensive and do not follow ergonomics. Our proposed Heart Rate Measuring (HRM) device is economical and user friendly and uses optical technology to detect the flow of blood through index finger. Three phases are used to detect pulses on the fingertip that include pulse detection, signal extraction, and pulse amplification. Qualitative and quantitative performance evaluation of the device on real signals shows accuracy in heart rate estimation, even under intense of physical activity.
Keywords— Beats per minute (bpm), Heart Rate
Measuring (HRM), pulse detection, pulse amplification, signal extraction.
I.
INTRODUCTION
Heart rate measurement is one of the very important parameters of the human cardiovascular system. The heart rate of a healthy adult at rest is around 72 beats per minute (bpm). Athletes normally have lower heart rates than less active people. Babies have a much higher heart rate at around 120 bpm, while older children have heart rates at around 90 bpm. The heart rate rises gradually during exercises and returns slowly to the rest value after exercise. The rate when the pulse returns to normal is an indication of the fitness of the person. Lower than normal heart rates are usually an indication of a condition known as Bradycardia, while higher than normal heart rates are known as tachycardia. Heart rate is simply and traditionally measured by placing the thumb over the subject’s arterial pulsation, and feeling, timing and counting the pulses usually in a 30 second period. Heart rate (bpm) of the subject is then found by multiplying the
obtained number by 2. This method although simple, is not accurate and can give errors when the rate is high. More sophisticated methods to measure the heart rate utilize electronic techniques. Electro-cardiogram (ECG) is one of frequently used and accurate methods for measuring the heart rate. ECG is an expensive device and its use for the measurement of the heart rate only is not economical. Low-cost devices in the form of wrist watches are also available for the instantaneous
measurement of the heart rate. Such devices can give accurate measurements but their cost is usually in excess of several hundred dollars, making them uneconomical. Most hospitals and clinics in the UK use integrated devices designed to measure the heart rate, blood pressure, and temperature of the subject. Although such devices are useful, their cost is usually high and beyond the reach of individuals. This project describes the design of a very low-cost device which measures the heart rate of the subject by clipping sensors on one of the fingers and then displaying the result on a laptop. The device has the advantage that it is lab view based and thus can be programmed to display various quantities, such as the average; maximum and minimum rates over a period of time and so on.
II.
COMPONENTS USED
Software used: NI LabVIEW 2014
Hardware components used:
1. Power supply 2. Heart rate sensor 3. Arduino
4. LCD display 5. Slider Switch 6. Zigbee transceiver 7. USB/UART chip 8. Laptop
591
Copyright © 2011-15. Vandana Publications. All Rights Reserved.
III. HEART RATE SENSOR
The Heart Beat Sensor provides a simple way to study the heart's function. This sensor monitors the flow of blood through fingertip. As the heart forces blood through the blood vessels in the fingertip, the amount of blood in the fingertip changes with time. The sensor shines a light lobe (small incandescent lamp) through the finger and measures the light that is transmitted. The clip can also be used on a fingertip or on the web of skin between the thumb and index finger. The signal is amplified, inverted and filtered, in the box. The Heart Beat Sensor provides a simple way to study the heart's function. This sensor monitors the flow of blood through fingertip. As the heart forces blood through the blood vessels in the fingertip, the amount of blood in the finger changes with time. The sensor shines a light lobe (small incandescent lamp) through the finger and measures the light that is transmitted.
Figure 1: Heart beat sensor
Features of Heartbeat Sensor
• Indicates heartbeat by a LED
• Provides a direct output digital signal for
• Possesses compact Size
• Works with a working Voltage of +5V DC
Working of a Heartbeat Sensor
Th light detector and a bright red LED. The LED needs to be of super bright intensity because maximum light passes and spreads if a finger placed on the LED is detected by the detector.
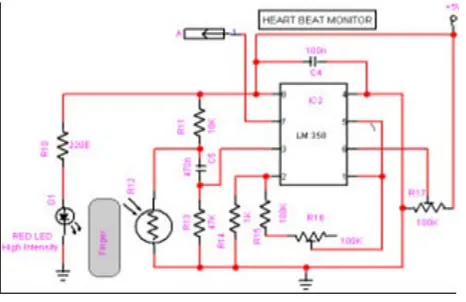
Figure 2: Heart beat sensor circuit diagram
Now, when the heart pumps blood through the blood vessels, the finger becomes slightly more opaque; due to this, less amount of light reaches from the LED to the detector. With every heart pulse generated, the detector signal gets varied. The varied detector signal is converted into an electrical pulse. This electrical signal gets amplified and triggered through an amplifier which gives an output of +5V logic level signal. The output signal is also directed by a LED display which blinks on each heartbeat rate. Doctors measure our heart rate manually. By holding our hands they feel the pulse in the nerve and look at their watch to count our heart beats per minute. Even we also can feel the pulse on our finger when our heart pumps blood into our blood vessels. This pulse is felt due to the expansion and contraction of blood vessel when blood enters and leaves it. Our heart does this around 72 to 84 times a minute for an healthy person.
What we do to measure the heart rate is, first we will detect the heart beat/pulse and count the pulses for one minute to get the beats per minute. So in order to detect the pulse we will pass light (using an LED) from one side of the finger and measure the intensity of light received on the other side (using an LDR). Whenever the heart pumps blood more light is absorbed by increased blood cells and we will observe a decrease in the intensity of light received on the LDR. As a result the resistance value of the LDR increases. This variation in resistance is converted into voltage variation using a signal conditioning circuit usually an OP-AMP. The signal is amplified enough to be detectable by the microcontroller inputs. The signal given to the microcontroller input will look somewhat like shown in the image above in a oscilloscope. The microcontroller can be programmed to receive an interrupt for every pulse detected and count the number of interrupts or pulses in a minute. The count value of pulses per minute will give you the Heart rate in bpm (Beats Per Minute).
592
Copyright © 2011-15. Vandana Publications. All Rights Reserved.
TheoryHeart rate is the number of heartbeats per unit of time and is usually expressed in beats per minute (bpm). In adults, a normal heart beats about 60 to 100 times a minute during resting condition. The resting heart rate is directly related to the health and fitness of a person and hence is important to know. You can measure heart rate at any spot on the body where you can feel a pulse with your fingers. The most common places are wrist and neck. You can count the number of pulses within a certain interval (say 15 sec), and easily determine the heart rate in bpm.
This paper describes a microcontroller based heart rate measurement system that uses optical sensors to measure the alteration in blood volume at fingertip with each heart beat. The sensor unit consists of an infrared light-emitting-diode (IR LED) and a photolight-emitting-diode, placed side by side as shown below. The IR diode transmits an infrared light into the fingertip (placed over the sensor unit), and the photodiode senses the portion of the light that is reflected back.
The intensity of reflected light depends upon the blood volume inside the fingertip. So, each heart beat slightly alters the amount of reflected infrared light that can be detected by the photodiode. With a proper signal conditioning, this little change in the amplitude of the reflected light can be converted into a pulse. The pulses can be later counted by the microcontroller to determine the heart rate.
IV.
BLOCK DIAGRAM
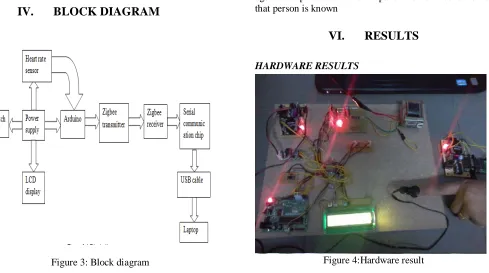
Figure 3: Block diagram
V. WORKING OF A HEART RATE
MONITORING SYSTEM USING Lab VIEW
When 230 volts a.c is given to the transformer it is converted to 5 volts d.c using bridge rectifier and voltage regulator. This 5v d.c is given to each and every component. The heart rate sensor consists of a photo transistor and an LED. It has an inbuilt amplifier and a filter. When we insert the finger into the clip the light rays from LED pass through the finger into the phototransistor. Here the number of times the LED glows for one minute is nothing but the heart rate. This heart rate is given to arduino and LCD display.
The arduino used in our project is ATMEGA 328.The RXT pin of arduino is connected to TXT of Zigbee transmitter and viceversa.Pin3 of arduino is connected to heart rate sensor and pin 9 is connected to SPDT switch. It contains a 16 MHz oscillator. The code which we have written in the arduino is stored in microcontroller using USB/UART chip.LCD display contains 16 columns and 2 rows used to store the heart rate.
It contains VCC, output, ground, d4, d5, d6, d7 pins in order starting from potentiometer side. Zigbee transmitter receives the heart rate value from arduino. This is given to the Zigbee receiver connected to USB/UART chip for series connection. With help of a USB cable the heart rate through USB/UART chip reaches the Labview. When we run the code inside Labview after entering the age of the person in the back panel the heart condition of that person is known
VI.
RESULTS
HARDWARE RESULTS
593
Copyright © 2011-15. Vandana Publications. All Rights Reserved.
When the switch is ON then power supply isgiven to each and every component.If the SPDT switch is at VCC it is seen on LCD as INSERT FINGER PRESS BUTTON.If the switch is at ground LCD shows INSERT FINGER.Switch it to ground and then insert your finger.The LCD shows calibrating and the heart rate is shown after one minute.
LCD COMMANDS AND OUTPUT
Figure 5: LCD commands and outputs
When LCD display shows INSERT FINGER the person needs to insert the finger into heart rate sensor.
The commands given by the LCD displayare Calibrating,Heart rate,transmitting and transmitted
Once we find the transmitted command on LCD it implies the heart rate is transmitted to the Laptop connected to zigbee receiver. We can see the same heart rate on Labview front panel where the doctor can see the heart rate of the patient.
SOFTWARE RESULTS Back Panel result
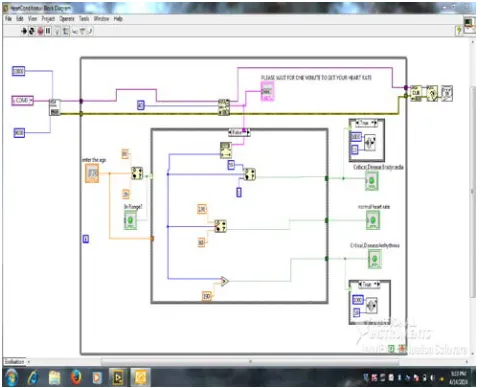
Figure 6: Back panel code diagram
In the back panel we draw the NI code for particular logic. In the code diagram we have used comparators like less than, in range and greater than operators.
We have taken two cases. They are:
Case 1 : True case for finding the heart rate of adults using the formula for maximum heart rate as:
220-age=maximum heart rate
Case 2:False case to find out the heart rate of children aged 1 to 19
Front Panel result
Figure 7: Front panel result
594
Copyright © 2011-15. Vandana Publications. All Rights Reserved.
If the age is in range of 20 to 80 years then the LED glowselse it doesn’t glow.
The user waits for one minute looking at the statement”PLEASE WAIT FOR ONE MINUTE TO GET YOUR HEART RATE”.
According to the heart rate the LED on either one of the condition glows.
For a healthy person the LED on normal range glows. For a person with heart rate below 60 the LED on Critical Disease: Bradycardia glows.
For a person with heart rate above maximum heart rate the LED on Critical Disease: Arrhythmia glows.
VII. INTERFACING HARDWARE
WITH SOFTWARE
Figure 8: Interfacing hardware with software
In this way NI software in laptop is interfaced with the hardware to get the heart condition of a person. Here the hardware outputs are given to the software to get the heart condition.
Once the heart rate is shown in the Labview the related heart condition of a person is shown through an LED which glows above a particular condition.
VIII. CONCLUSION
Thus by using our project the old age people and the heart attack patients can easily find out their heart rate and its conditions sitting at one place. As it is a low cost project and highly effective one could easily afford it. Due to absence of complex features, the designed device can
also be handled by any non-medical professionals also. Thus it can also be used in home.
Cardiovascular disease is one of the major causes of untimely deaths in world, heart beat readings are by far the only viable diagnostic tool that could promote early detection of cardiac events.
FUTURE SCOPE
• We can extend and implement our project to find out the heart rate and store it in a memory to find out the variations in it.
•
• Using GSM technology we can display the ECG signal on doctors mobile phone
In addition to ECG rate, we can also send EEG (electroencephalogram) and EMG
REFERENCES
[1] www.ni.com [2] www.arduino.com
[3] Edwards S., ―Heart rate Monitor Book, Leisure systems international, 1993
[4] M. Malik and A. J. Camm., “Heart Rate Variability”., Futura Publishing Co. Inc., Sept. 1995.
[5] www.heartratemonitor.co.uk
[6] S.C. Nijhawan, V.K. Sharma and R.S. Khandpur, ―A Beat-to-Beat Heart Rate Meter‖, IEEE Transactions on Biomedical Engineering, Vol. BME-28, No. 1, pp. 42-44, 1981