R E S E A R C H A R T I C L E
Open Access
Assessment of macular function in patients
with idiopathic Epiretinal membrane by
multifocal Electroretinography: correlation
with visual acuity and optical coherence
tomography
Meng Gao
1†, Yi Wang
1†, Wu Liu
1*, LiMei Liu
2, WeiYu Yan
1, Ju Liu
3, KeGao Liu
1, XinXin Liu
4and YanHua Hu
1Abstract
Background:This study evaluates the macular function changes in patients with idiopathic macular epiretinal membrane (ERM) by multifocal electroretinography (mfERG) and their correlations with visual acuity and central macular thickness (CMT) by optical coherence tomography (OCT).
Methods:Twenty eyes of 20 patients with ERM underwent OCT and mfERG examinations. The response amplitude densities and implicit times of mfERG were compared to the control fellow eyes. Correlation analyses among visual acuity, central macular thickness and mfERG values in the central two concentric rings were performed.
Results:The mfERG P1 response amplitude densities in ring 1–2 and P1 implicit time in ring1 were significantly changed in epiretinal membrane eyes compared with controls (P < 0.05). Multivariate stepwise linear regression analyses showed LogMAR visual acuity was significantly correlated with CMT (P = 0.004), and also with the P1 amplitude density in ring 1 (P = 0.002). CMT showed significant correlation with P1 implicit time in ring 2 (P = 0.013). Conclusions:The mfERG abnormalities show macular function changes and correlate with visual acuity and central macular thickness in eyes with ERM. In first-order mfERG responses, P1 wave changes may be a sensitive functional measurement for ERM patients.
Keywords:Electroretinography, Epiretinalmembrane, Optical coherence tomography
Background
Idiopathic macular epiretinal membrane (ERM) is a rela-tively common disorder of the vitreoretinal interface that may occur without clinical signs or cause marked loss of vision and metamorphopsia as a result of covering or distorting the central retina. The functional and anatom-ical measurements for ERM are usually based on visual acuity and optical coherence tomography (OCT) [1]. Multifocal electroretinography (mfERG),as a noninvasive, objective method to detect regional functional changes in
the central retina by measuring electrophysiologic re-sponses, has demonstrated macular function changes in eyes with ERM by several reports [2–6]. To date, however, the value changes in mfERG recordings were inconsistent [3, 4]. The functional measurement characteristic of mfERG for ERM needs further study.
The purpose of the study is to assess first-order mfERG changes in ERM patients and to evaluate the correlations among the visual acuity, OCT parameters and mfERG values.
Methods
This was an observational study performed between October 2013 and June 2014 at the Beijing Tongren
Hospital. Patients with the clinical diagnosis of
* Correspondence:[email protected]
†Equal contributors
1Beijing Tongren Eye Center, Beijing Tongren Hospital, Capital Medical
University; Beijing Ophthalmology and Visual Sciences Key Laboratory, Beijing, China
Full list of author information is available at the end of the article
were offered enrollment in the study. The patients with secondary ERM, previous history of vitrectomy, other ac-companying macular diseases, retinal detachment, retinal vascular diseases, endophthalmitis, or diabetic retinopathy were excluded from this study. The normal fellow eyes without ocular diseases served as controls. Finally, 20 eyes of 20 patients who met the criteria were included for data analysis.
Ophthalmic examinations
A detailed history, best-corrected visual acuity (BCVA), IOP measurement using noncontact tonometry, slit lamp microscopy and funduscopy were obtained in all partici-pants. BCVA was measured using the Early Treatment Diabetic Retinopathy Study charts at a 4-m distance. Vision results were quantified in logMAR.
Optical coherence tomography
The scan acquisition protocol for high-definition optical coherence tomography (Cirrus HD-OCT, Carl-Zeiss Meditec, Dublin, CA, USA) was a macular cube 512 × 128 combo across an area of 6 × 6 mm. When the foveal depression was disturbed by the thickened retina, the fo-veal center was identified as intersection of the point of fixation or the point of maximum outer nuclear layer thickness and minimum inner retinal layer thickness [7]. The central macular thickness (CMT) was defined as the distance between vitreoretinal interface and inner sur-face of the retinal pigment epithelium.
Multifocal electroretinography
Multifocal ERG values were recorded with VERIS4.9 soft-ware (Electro-Diagnostic Imaging, San Mateo, CA, USA) according to the standard document of the International Society for Clinical Electrophysiology of Vision (ISCEV) [8]. Pupils were fully dilated with 1% tropicamide and 2.5% phenylephrine hydrochloride. The stimulus, consisted of an
sented on a cathode ray tube monitor with a frame fre-quency of 75 Hz. The luminance of the stimulus for
white was 200 cd/m2and the contrast 99.3%. The
band-pass of the filters were 3-100 Hz and amplified with
gain of 105. The mfERG responses were recorded with
a Burian–Allen bipolar contact lens electrode. Fixation stability was continuously monitored during the testing duration. The first order responses were grouped into 6 eccentric rings. The fovea (ring 1) and parafovea (ring 2) responses of the P1 and N1 waves mainly reflect the macular function and were used for analysis.
Statistical analysis
Statistical analysis was performed using SPSS software (version 18.0) for Windows (IBM, Armonk, New York, USA). Comparison of data was performed using paired-samplest-test. Pearson correlation analyses were performed for correlation analysis. Multivariate stepwise linear regres-sion analyses by forward selection approaches were per-formed to investigate the relationship between the visual acuity and other values. A two-sidedP-value of<0.05 was considered statistically significant.
Results
The mean age of 20 patients with idiopathic ERMs
in-cluded was 62 years (range: 50–76 years). Two patients
were male and 18 female. The mean best-corrected visual acuity (BCVA) of affected eyes was 0.39 ± 0.24 logMAR (range:−0.10 to 0.74 logMAR), which was statistically sig-nificant compared with the control fellow eyes (t = 4.935, P < 0.05). OCT images showed characteristic pre-retinal highly reflective line beyond fovea in affected eyes. The mean central macular thickness in affected eyes was
470.05 ± 101.91μm (range: 240-607μm), while the mean
central macular thickness in fellow eyes was 241.15 ± 24.89μm (range 190-299μm), the difference was statisti-cally significant (t = 10.56, P < 0.05).
Table 2P1 and N1 implicit times in ring 1–2 of ERM patients (mean ± SD, ms)
ring P1implicit time N1implicit time
affected control t p-value affected control t P-value
1 29.04 ± 1.61 28.13 ± 1.33 −2.244 0.037* 15.77 ± 1.85 14.81 ± 1.63 −1.837 0.082
2 28.35 ± 2.43 27.80 ± 0.99 −0.907 0.376 15.31 ± 1.82 14.59 ± 1.48 1.972 0.063
Serial changes in mfERG
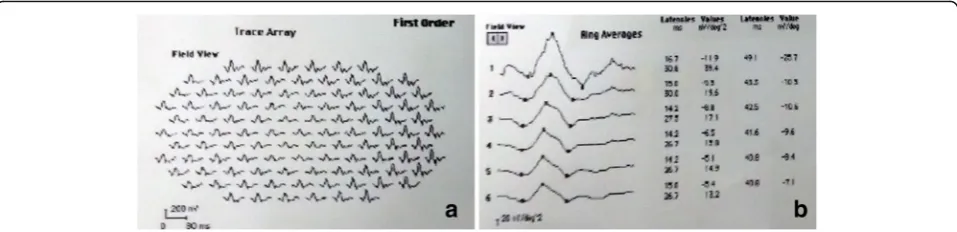
The changes in mfERG response amplitude densities and implicit times of ring 1 and ring 2 were illustrated in Table 1 and Table 2 respectively. There were significant reductions in P1 response amplitude densities in ring 1–2 and P1 implicit time in ring1 (P < 0.05). The representa-tive mfERG images of a case are shown in Fig. 1.
Correlation analysis among LogMAR best-corrected visual acuity, CMT and mfERG values Statistical analysis demonstrated that there was statistically significant cor-relation between LogMAR BCVA and central macular thickness, P1 amplitude densities,N1amplitude densities, N1 implicit times in ring 1–2 (r = 0.0614,−0.650,−0.484, 0.543, 0.489, 0.528, 0.582, P = 0.004, 0.002, 0.031, 0.013, 0.029, 0.017, 0.007; Table 3).
The contribution of central macular thickness and mfERG values in defining for LogMAR BCVA was tested through multiple stepwise regression analysis. Parameters have statistically significant correlation with LogMAR BCVA were considered for the model as potential predic-tors. Multiple linear regression equation: Y = 0.152 + 0.001 X1–0.009 X2, X1 = CMT, X2 = P1 amplitude density in
ring 1, r2= 0.720.
P1 implicit time in ring 2 and CMT was significantly correlated (r = 0.545, P < 0.01), while there were not sig-nificant correlation between other mfERG values and CMT (Table 4).
Discussion
Previous studies [2, 3, 6] in the use of mfERG in asses-sing idiopathic ERM have found the mfERG values were reduced in the central retina. Consistent with previous studies, our results demonstrated that mfERGchanges in ring 1 and ring 2. The observed reduction in mfERG values indicates visual function impairment associated with idiopathic ERM occurred in areas beyond fovea, which was consistent with extensive macular edema to perifovea in OCT figures.
Significant changes were found in P1 amplitude dens-ities in ring 1–2 and P1 implicit time in ring1 in eyes with ERM compared to the control fellow eyes, while there were no significant differences in N1 amplitude densities or implicit times. This result is similar to previ-ous report [3, 4]. TheN1 and P1 mfERG wave forms are believed to originate from the outer retinal layer and the inner retinal layer respectively [9, 10]. Previous studies [11, 12] have reported inner retina had the most variabil-ity of thickness in eyes with ERM. It seems that P1 wave
changes were the main deterioration in mfERG
Fig. 1Representative mfERG Images of a patient with idiopathic epiretinal membrane.aThe first order trace array: the 103 hexagonal elements projected onto the corresponding retina area.bRing averages: The 103 hexagonal elements that compose the six concentric rings. The mfERG responses showed significant reductions in P1 response amplitude densities in ring 1–2 and P1 implicit time in ring1
Table 3Correlation analysis among LogMAR best-corrected visual acuity, CMT and mfERG values
LogMAR BCVA correlation factors eyes r P-value
CMT 20 0.0614 0.004*
P1 amplitude density in ring 1 20 −0.650 0.002*
P1 amplitude density in ring 2 20 −0.484 0.031*
P1 implicit time in ring 1 20 0.181 0.446
P1 implicit time in ring 2 20 0.318 0.172
N1 amplitude density in ring 1 20 0.543 0.013*
N1 amplitude density in ring 2 20 0.489 0.029*
N1 implicit time in ring 1 20 0.528 0.017*
N1 implicit time in ring 2 20 0.582 0.007*
*P< 0.05 (by Pearson correlation analyses)
Table 4Correlation analysis between CMT and mfERG values
CMT correlation factors eyes r P-value
P1 amplitude density in ring 1 20 −0.11 0.645
P1 amplitude density in ring 2 20 −0.017 0.945
P1 implicit time in ring 1 20 0.205 0.386
P1 implicit time in ring 2 20 0.545 0.013*
N1 amplitude density in ring 1 20 0.148 0.534
N1 amplitude density in ring 2 20 0.121 0.613
N1 implicit time in ring 1 20 0.098 0.68
N1 implicit time in ring 2 20 0.357 0.123
using focal macular ERGs and reported that there was a significant correlation between the b-wave amplitude and the visual acuity [14], while the P1 waveform of the mfERG appear to be generated by the same cells gener-ating the b-wave of the full-field ERG [10]. Although the cellular impairment mechanism underlying ERM remains unclear, we suggested that P1 wave changes in this study may reflect the inner retina layer damages in-duced by ERM, which seemed to play an important role in vision loss.
The mfERG values might be associated with numerous factors. Previous studies have found that abnormalities in the P1 latency disorders might reflect dysfunctions of the inner retinal layers and Müller cells [15]. We dem-onstrated significant correlation between P1 implicit time in ring 2 and CMT. In contrast, other studies [3] reported there was no statistically significant correlation between the mfERG values and CMT. This discrepancy may relate to the consistent damage caused by prolonged duration and thickened retinal thickness in this study.
The limitations of our study include a small sample size. This might have limited the power in detecting photo-receptor statues and other influence factors, which may have an impact on ERG values and statistical analysis. The mechanism of mfERG impairment related to ERM may not be straightforward. The multifocal ERG abnormalities as described hereneeds further study.
Conclusion
In summary, our findings showed mfERG abnormalities appear to demonstrate subtle macular function changes and correlate with visual acuity and central macular thick-ness in eyes with ERM. In first-order mfERG responses, P1 wave changes may be a sensitive functional measure-ment for ERM patients.
Abbreviations
BCVA:Best-corrected visual acuity; CMT: Central macular thickness; ERM: Epiretinal membrane; mfERG: Multifocal electroretinography; OCT: Optical coherence tomography
Acknowledgements Not applicable
Funding
No funding was received for this research.
accordance with the ethical standards of the institutional research committee and with the 1964 Declaration of Helsinki and its later amendments or comparable ethical standards. The protocol was approved by the institution view board of Beijing Tongren Hospital with reference number TRECKY-012. Informed content was obtained from all patients before enrollment.
Consent for publication Not applicable.
Competing interests
The authors declare that they have no competing interests.
Publisher’s Note
Springer Nature remains neutral with regard to jurisdictional claims in published maps and institutional affiliations.
Author details
1
Beijing Tongren Eye Center, Beijing Tongren Hospital, Capital Medical University; Beijing Ophthalmology and Visual Sciences Key Laboratory, Beijing, China.2Department of Ophthalmology, Yantai Yuhuangding Hospital, Affiliated Hospital of Medical College, Qingdao University, Yantai, Shandong, China.3Department of Ophthalmology, Beijing Electric Power Hospital, Beijing, China.4Department of Ophthalmology, Kailuan General Hospital,
Tangshan, China.
Received: 19 September 2016 Accepted: 20 November 2017
References
1. Inoue M, Kadonosono K. Macular diseases: epiretinal membrane. Dev Ophthalmol. 2014;54:159–63.
2. Hwang JU, Sohn J, Moon BG, Joe SG, Lee JY, Kim JG, Yoon YH. Assessment of macular function for idiopathic epiretinal membranes classified by spectral-domain optical coherence tomography. Invest Ophthalmol Vis Sci. 2012;53(7):3562–9.
3. Li D, Horiguchi M, Kishi S. Tomographic and multifocal electroretinographic features of idiopathic epimacular membranes. Arch Ophthalmol. 2004;122(10):1462–7.
4. Lim JW, Cho JH, Kim HK. Assessment of macular function by multifocal electroretinography following epiretinal membrane surgery with internal limiting membrane peeling. Clin Ophthalmol. 2010;4:689–94.
5. Moschos M, Apostolopoulos M, Ladas J, Theodossiadis P, Malias J, Moschos M, Papaspirou A, Theodossiadis G. Assessment of macular function by multifocal electroretinogram before and after epimacular membrane surgery. Retina. 2001;21(6):590–5.
6. Tari SR, Vidne-Hay O, Greenstein VC, Barile GR, Hood DC, Chang S. Functional and structural measurements for the assessment of internal limiting membrane peeling in idiopathic macular pucker. Retina. 2007;27(5):567–72.
7. Kinoshita T, Imaizumi H, Miyamoto H, Katome T, Semba K, Mitamura Y. Two-year results of metamorphopsia, visual acuity, and optical coherence tomographic parameters after epiretinal membrane surgery. Graefes Arch Clin Exp Ophthalmol. 2015;254(6):1041-9.
8. Hood DC, Bach M, Brigell M, Keating D, Kondo M, Lyons JS, Marmor MF, McCulloch DL, Palmowski-Wolfe AM. ISCEV standard for clinical multifocal electroretinography (mfERG) (2011 edition). Doc Ophthalmol. 2012;124(1):1–13. 9. Hood DC, Frishman LJ, Saszik S, Viswanathan S. Retinal origins of the
10. Dale EA, Hood DC, Greenstein VC, Odel JG. A comparison of multifocal ERG and frequency domain OCT changes in patients with abnormalities of the retina. Doc Ophthalmol. 2010;120(2):175–86.
11. Koo HC, Rhim WI, Lee EK. Morphologic and functional association of retinal layers beneath the epiretinal membrane with spectral-domain optical coherence tomography in eyes without photoreceptor abnormality. Graefes Arch Clin Exp Ophthalmol. 2012;250(4):491–8.
12. Arichika S, Hangai M, Yoshimura N. Correlation between thickening of the inner and outer retina and visual acuity in patients with epiretinal membrane. Retina. 2010;30(3):503–8.
13. Shimada Y, Sakurai S, Naito K, Sugino T, Kojima Y, Hori K, Horiguchi M. Multifocal electroretinogram and optical coherent tomography: prediction of visual outcome after epiretinal membrane removal. CLIN EXP OPTOM. 2011;94(3):296–301.
14. Tanikawa A, Horiguchi M, Kondo M, Suzuki S, Terasaki H, Miyake Y. Abnormal focal macular electroretinograms in eyes with idiopathic epimacular membrane. Am J Ophthalmol. 1999;127(5):559–64.
15. Lim JW, Kim HK, Cho DY. Macular function and ultrastructure of the internal limiting membrane removed during surgery for idiopathic epiretinal membrane. Clin Experiment Ophthalmol. 2011;39(1):9–14.
• We accept pre-submission inquiries
• Our selector tool helps you to find the most relevant journal
• We provide round the clock customer support
• Convenient online submission
• Thorough peer review
• Inclusion in PubMed and all major indexing services
• Maximum visibility for your research
Submit your manuscript at www.biomedcentral.com/submit