R E S E A R C H A R T I C L E
Open Access
Changes in hydration status of elite Olympic class
sailors in different climates and the effects of
different fluid replacement beverages
Evan JH Lewis
1, Sarah J Fraser
2, Scott G Thomas
3and Greg D Wells
3,4*Abstract
Background:Olympic class sailing poses physiological challenges similar to other endurance sports such as cycling or running, with sport specific challenges of limited access to nutrition and hydration during competition.
As changes in hydration status can impair sports performance, examining fluid consumption patterns and fluid/ electrolyte requirements of Olympic class sailors is necessary to develop specific recommendations for these elite athletes. The purpose of this study was to examine if Olympic class sailors could maintain hydration status with self-regulated fluid consumption in cold conditions and the effect of fixed fluid intake on hydration status in warm conditions.
Methods:In our cold condition study (CCS), 11 elite Olympic class sailors were providedad libitumaccess to three different drinks. Crystal Light (control, C); Gatorade (experimental control, G); and customized sailing-specific Infinit (experimental, IN) (1.0:0.22 CHO:PRO), were provided on three separate training days in cold 7.1°C [4.2–11.3]. Our warm condition study (WCS) examined the effect of fixed fluid intake (11.5 mL.kg.-1.h-1) of C, G and heat-specific experimental Infinit (INW)(1.0:0.074 CHO:PRO) on the hydration status of eight elite Olympic Laser class sailors in 19.5°C [17.0 - 23.3]. Both studies used a completely random design.
Results:In CCS, participants consumed 802 ± 91, 924 ± 137 and 707 ± 152 mL of fluid in each group respectively. This did not change urine specific gravity, but did lead to a main effect for time for body mass (p < 0.001), blood sodium, potassium and chloride with all groups lower post-training (p < 0.05). In WCS, fixed fluid intake increased participant’s body mass post-training in all groups (p < 0.01) and decreased urine specific gravity post-training (p < 0.01). There was a main effect for time for blood sodium, potassium and chloride concentration, with lower values observed training (p < 0.05). C blood sodium concentrations were lower than the INW group post-training (p = 0.031) with a trend towards significance in the G group (p = 0.069).
Conclusion:Ad libitumfluid consumption in cold conditions was insufficient in preventing a decrease in body mass and blood electrolyte concentration post-training. However, when a fixed volume of 11.5 mL.kg.-1.h-1was consumed during warm condition training, hydration status was maintained by preventing changes in body mass and urine specific gravity.
Keywords:Hydration, Sailing, Nutrition, Performance, Temperature
* Correspondence:[email protected]
3
Faculty of Kinesiology and Physical Education, The University of Toronto, 55 Harbord Street, Toronto, ON M5R 2W6, Canada
4
Physiology and Experimental Medicine, The Hospital for Sick Children, 555 University Avenue, Toronto, ON M5G 1X8, Canada
Full list of author information is available at the end of the article
Background
The maintenance of hydration status during training and competition has been repeatedly identified as a rate-limiting factor for athletic performance [1-3]. The con-tinued intake of fluids fortified with carbohydrates and electrolytes during activities lasting longer than one hour has been found to prevent deteriorations in endurance, strength, blood volume [4-6] and cognitive function [7].
As such, the study of hydration requirements of Olympic class sailors is lacking when compared to other endurance sports such as cycling and running [8,9]. While population size and sport specific challenges may be an influencing factor, the physiologic demands of Olympic class sailing, coupled with the strategic/tactical requirements make hy-dration a logical variable for success that has not been adequately studied [8]. When 28 elite Olympic class sailors from New Zealand were surveyed about their sport sci-ences practices, 68% reported being dehydrated during ra-cing from inadequate fluid intake that was likely related to 86% of athletes reporting a loss of concentration at the end of races and 50% reporting feelings of frustration about race results [10]. Examination of the hydration practices of
novice Laser class (Men’s singlehanded Olympic dinghy)
sailors competing in hot climates and moderate wind vel-ocities, revealed participants did not consume sufficient fluids to prevent a >2% loss of body mass after racing [9], a level that has previously been associated with reduced ath-letic performance [3]. In both studies, the authors attrib-uted a lack of sport science knowledge to the reported change in hydration status. Since the findings of Slater and Tan [9], we are not aware of any additional findings on the impact of environmental conditions on the hydra-tion practices or requirements of elite or novice Olympic class sailors.
Examination of the energy demands of Laser class sailors, revealed there is a direct correlation between wind velocity and the energy demand during sailing [11]. The Laser and other Olympic class dinghies require sailors to have well-developed strength endurance, espe-cially in the quadriceps, abdominal and upper back mus-cles. To navigate the boat upwind, the sailor must leverage his body out of the boat to counteract the force of the wind on the sail (for a detailed figure and descrip-tion see Castagna & Brisswalter [11]). Previous examin-ation of the physiologic response to sailing in moderate winds has determined energy requirements are largely met by aerobic metabolism. Higher skilled Laser sailors sail at 45 to 68% of maximal aerobic power during 30 or more minutes of upwind sailing in moderate conditions (14–22 km.h-1) [11,12]. Sweating rates at similar
inten-sities measured in America’s Cup sailors can results in
mean water losses of 1340 mL.h-1 [13]. As there are
many differences between America’s Cup and Olympic
class sailing [8,13] it is important to determine the
changes in hydration status and subsequent hydration requirements of Olympic class sailors.
Sweat rate and water loss are affected by environmental conditions [6] but it is unclear how sweat losses are com-pensated for by sailors in cold conditions. Furthermore, increased sweat losses in warm and hot conditions are not appropriately compensated for by increased fluid intake in elite football players [14,15] amateur Laser sailors [9] and
America’s Cup sailors [13]. As such, the purpose of the
CCS was to examine if Olympic class sailors could self-regulate fluid requirements in cold conditions by
provid-ing themad libitumaccess to different fluid replacement
beverages during training and examining how this affected hydration status. The purpose of the WCS was to test the effect of fixed fluid intake of different fluid replacement beverages on hydration status during training in warm conditions. Examining relative fluid intakes may be a novel way of developing hydration recommendations for sailors. Previous work examining the effect relative fluid intake rates on gastric emptying during cycle exercise determined that consuming 11.5 mL.kg-1.h-1 of a 7.5% carbohydrate solution had a higher percentage gastric emptying com-pared to 17.1 and 23.0 mL.kg-1.h-1 [16]. While absolute gastric emptying in this study was greater in the higher fluid intake groups, these intakes equated to approxi-mately 1200 and 1600 mL.h-1and resulted in gastric dis-comfort [16]. Therefore, the a second purpose of this study was to determine the optimal composition of a fluid replacement drink specific to elite Olympic class sailors and test if consuming 11.5 mL.kg-1.h-1 was sufficient to maintain hydration status.
Methods
Research design
Two studies were performed to examine the changes in hydration status of elite Olympic class sailors during training. The first was a cold condition study (CCS) that
examined ad libitum fluid consumption of three
differ-ent fluid replacemdiffer-ent drinks (Table 1) on hydration sta-tus and blood electrolyte concentration before and after
training in cold (4.2–11.3°C) temperatures. WCS
exam-ined the effect of fixed volume (11.5 mL.kg.-1.h-1) fluid consumption of three different fluid replacement drinks on hydration status and blood electrolyte concentration before and after in warm temperatures (17.0 - 23.3°C). Both studies used a single blinded, placebo-controlled, repeated-measures design. Participants were randomly assigned to each condition on three separate days using a
completely randomized design. In CCS,participants
In both studies, all training activities were performed in identical order for the same duration each day.
Experimental drinks
CCS and WCS had three different drink conditions, Crystal Light (C) (Kraft Foods Canada, Toronto, Ontario), Gatorade (G) (Gatorade, Barrington, Illinois) and Infinit (IN) (Infinit Nutrition Canada, Windsor, Ontario). All drinks were flavoured similarly in attempts to blind the participants. The composition of the C and G conditions were consistent between both studies; however the Infinit condition was altered to reflect the hypothesized fluid re-placement and electrolyte requirements of the participants determined during sweat rate testing (INW) (Table 1).
The carbohydrate content in the G drink was entirely sucrose. In the CCS, the carbohydrate content in the IN drink was approximately 60 : 40 ratio of dextrose and
maltodextrin with a carbohydrate concentration of 60 g.
L-1. The INW drink in WCS had a carbohydrate ratio of
2 : 1 dextrose and fructose. Protein in both drinks was whey protein isolate with 13.3 g.L-1 and 6.7 g.L-1 in the IN and INW drinks respectively.
Participants in CCS were provided ad libitum access
to their drink condition. To measure the amount of fluid
consumed during training, the content of each subject’s
water bottles was measured to the nearest 1.0 mL before and after training and the difference was recorded.
In WCS participants were instructed to consume one water bottle per hour containing 11.5 mL.kg.-1.h-1 of fluid based on pre-training body weight. At the beginning of each hour, participants were provided with an individually pre-measured sport bottle with their respective drink and instructed to ingest all of the fluid within the hour. Each participant had a secure bottle holder in their boat to pro-vide convenient access to their drink throughout each hour of training. Participants in both studies were asked to refrain from consuming any other fluids or food within the hour before training, during training and until all post-training measures had been completed.
Subjects
CCS Eleven males (mean [range])(age 23.3 y [19.5–31.6]; height 182.8 cm [177.5 - 187.0]; mass 81.5 kg [74.2–95.9])
were recruited for this study. All participants competed in Olympic class boats (Men’s Laser n = 6; 49er skiff n = 3;
Men’s Finn n = 1 and Men’s RS:X n = 1). WCS had eight
male participants that competed in the Men’s Laser (age
22.9 y [19.9–27.0]; height 183.4 cm [180.2–190.0]; mass 81.1 kg [78.8 - 84.5]). All participants in both studies had a minimum of four years experience competing at the inter-national level in their respective class. The subjects were studied during training camps designed to replicate com-petitive conditions with the environmental condition being the variable between each study. Potential risks from par-ticipating in each study were explained to the subjects prior to obtaining written consent. The University of Toronto Research Ethics Board approved all study procedures.
Sweat rate
Prior to the each study, sweat rate and sodium loss were determined during cycle exercise in controlled laboratory conditions (CCS 21.3°C, 57.4% relative humidity; WCS 21.8°C, 59.1% relative humidity). For the day of testing, participants were instructed to drink 500 mL of water upon waking, refrain from eating breakfast and report to the laboratory at 08:30. After voiding, participants were weighed to the nearest 0.1 kg (Precision Scale UC-321PL, A&D Medical, San Jose, California, USA) wearing only dry lightweight shorts. Participants had four adhesive sweat patches (Tegaderm, 3 M, London, Ontario, Canada) affixed to their, chest, upper-back, forearm and thigh to measure whole-body sodium as previously described [17]. Participants were fitted to an electronically braked ergom-eter (Velotron Dynafit Pro, Seattle, WA, USA) with Computrainer Software, which allowed them to adjust their resistance to maintain desired heart rate. Subjects were instructed to warm up for five minutes before com-pleting 30 minutes of cycling. Intensity was set at 80% of age-predicted maximum heart rate (Equation 1) as this is an average heart rate observed during racing in windy conditions [18]. Patches were removed once saturated or at the conclusion of the test and sweat concentration from all patches were analyzed (Sweat Chek 3120, Wescor Biomedical Systems, Logan, Utah, USA). This protocol produced profuse sweating in all participants and was similar to previously validated testing procedures [19].
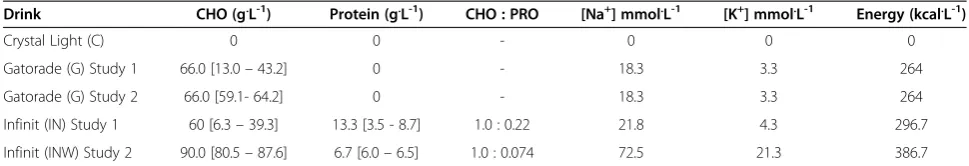
Table 1 Composition of experimental drinks in CCS and WCS
Drink CHO (g.L-1) Protein (g.L-1) CHO : PRO [Na+] mmol.L-1 [K+] mmol.L-1 Energy (kcal.L-1)
Crystal Light (C) 0 0 - 0 0 0
Gatorade (G) Study 1 66.0 [13.0–43.2] 0 - 18.3 3.3 264
Gatorade (G) Study 2 66.0 [59.1- 64.2] 0 - 18.3 3.3 264
Infinit (IN) Study 1 60 [6.3–39.3] 13.3 [3.5 - 8.7] 1.0 : 0.22 21.8 4.3 296.7
Infinit (INW) Study 2 90.0 [80.5–87.6] 6.7 [6.0–6.5] 1.0 : 0.074 72.5 21.3 386.7
Blood electrolytes
In CCS finger prick blood samples were collected into heparinized capillary tubes for immediate analysis in CHEM8+ cartridges inserted into an iSTAT point of care monitor (Abbott, Princeton, NJ, USA). The CHEM8+ cartridge analyses sodium, potassium, chloride, glucose, hematocrit and hemoglobin as previously described [20].
In WCS, venous blood samples were collected from the
antecubital vein into heparinized tubes. Two participants were uncomfortable with venous sampling so finger prick blood samples were collected as described in CCS. Samples were pipetted into iSTAT CHEM8+ cartridges and analyzed as described in CCS.
Hydration status
Before and after training, participants provided a mid-stream urine sample in a polyurethane collection container for immediate analysis of urine specific gravity (USG) in triplicate (4410 PAL-10S, Novatech International, Houston, Texas, USA). At this time, participants voided completely and were then weighted to the nearest 0.1 kg (Precision Scale UC-321PL, A&D Medical, San Jose, California, USA), wearing only dry lightweight shorts. Differences in body mass were used to estimate hydration status and to calcu-late sweat rate (Equation 3). Urine excreted by each partici-pant during training in WCS was collected in a large airtight container, carried by a support boat. There was no correction made for respiratory water loss or metabolic fluid changes. Changes in plasma volume were calculated using changes in hematocrit and hemoglobin according to the methods of Dill and Costill [21].
Environmental conditions
Environmental conditions were measured every 30 minutes during training using a portable weather station with anemometer (Kestrel 4000, Nielsen-Kellerman, Mckellar, Australia).
Calculations
Participant’s target heart rate during sweat rate testing
was calculated by subtracting participants’age from 220
and then multiplying by 80%.
Heart rate¼ð220ageÞ∗0:80 ð1Þ
Mean whole body sodium output was calculated based on the equation of Patterson et al. [17].
Wholebody Na½ ¼28:2% chest Na½ þ28:2% back Na½ þ11:3% forearm Na½
þ32:3% thigh Na½ ð2Þ
This data was pooled and used as a guide to determine the electrolyte content of the Ex drink (Table 1).
Sweat rate (millilitres per hour) was estimated as change in body mass (kilograms), with the assumption 1 kg = 1 L, during the 3 hour practice plus total fluid in-take (milliliters) and minus total urine output during practice (millilitres).
Sweat rate¼ðPre body massPost body massÞ
þFluid intakeUrine output
Practice length ð3Þ
Total sweat sodium loss (grams) for participants was calculated by multiplying their sweat sodium concentra-tion (millimoles per litre) with the molecular weight of sodium (22.99 grams per mol) with the total sweat vol-ume lost (litres).
Sodium loss¼Sweat sodium concentration∗22:99
∗Sweat loss ð4Þ
The total sodium intake (grams) of each participant was calculated by multiplying the sodium concentration of each drink (Table 1) with the molecular weight of so-dium (22.99 grams per mol) with the total volume of each drink consumed (litres).
Sodium intake¼Drink sodium concentration
∗22:99∗Fluid intake ð5Þ
Statistical analysis
Data is presented as the mean [range] for all descriptive sta-tistics and mean ± SE for comparison between and within conditions with the level of confidence set at p < 0.05 to determine significance. Differences from pre to post train-ing between and within conditions were examined first using a multivariate analysis of variance (MANOVA) for the blood electrolytes and hemoglobin concentrations. Analysis of variance (ANOVA) tests were then applied to each variable to determine which conditions differed and a Tukey’s honestly significant difference post-hoc analysis ap-plied when appropriate. Electrolytes with no differences detected using MANOVA, blood glucose, USG and body mass changes were analyzed using repeated measures ANOVA. There was no difference between the athletes sail-ing different boats in CCS so all participants were pooled into a single group. In WCS, participants’sweat rate and so-dium balance variables and glucose intake were analyzed
using a one-way ANOVA with Tukey’s honestly significant
difference. Analysis was performed using SPSS version 20.
Results
Cold condition study
Environmental conditions
During training the wet bulb temperature was 7.1°C
[4.2 – 11.3] with 62.7% [32 – 87] relative humidity.
Hydration status
Pre-training USG values showed that participants arrived for training in a borderline hypohydrated state. There were at least three participants in each group that had USG values greater than 1.025. Examination of USG after training showed no effect of time (p = 0.318) (Table 2). At least two participants per group had USG values greater than 1.025. Measurement of plasma volume supports our USG mea-surements, as there was no difference from pre- to post-training (p = 0.871). Participants consumed an average of 811.1 mL [242–1638] of fluid during training (Table 2). This resulted in an average decrease in body mass of 0.40 kg
[0–1.0]. Body mass changes were not different between
groups but there was a main effect for time (p < 0.001).
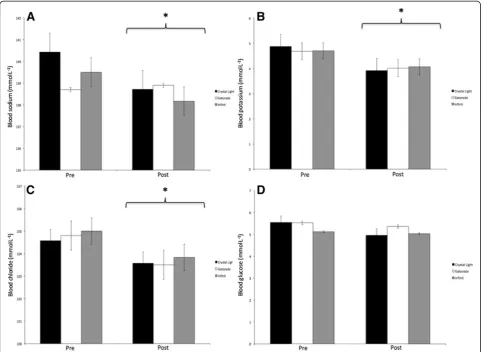
Hematological measurements
Blood sodium concentrations were lower post-training with a main effect for time (p = 0.02). The group by time inter-action for sodium trended toward significance (p = 0.084)
(Figure 1A). Participants’ blood potassium concentration
were lower after training C −19.4%, G −13.7% and IN
−13.0%, with a main effect for time (p < 0.001) (Figure 1B) and blood chloride concentrations also lower after training with a main effect for time (p = 0.007) (Figure 1C). There was a trend towards a main effect for time for blood glu-cose (p = 0.074) (Figure 1D).
Warm condition study
Environmental conditions
Wet bulb temperature during training was 19.5°C [17.0
-23.3] with 82.3% relative humidity [76.0 – 89.1]. Wind
velocity was 24.3 km.h-1[15.0–36.0).
Hydration status
Examination of USG and body mass revealed a main effect for time for both measures respectively (p = 0.01, p = 0.003) with no difference between drink conditions (Table 3).
Be-fore training participants’ USG was higher in all groups
with the C and G groups having near hypohydrated values of 1.019 and 1.020 respectively. Two participants in the C group had USG values >1.030. Body mass increased after training for all groups (p = 0.01). Participants gained an average of 0.31 kg or 0.44% body mass.
Blood hemoglobin concentration was significantly lower in the G group after training when compared to controls pre-training (p > 0.05) (Table 3). When changes in hemoglobin and hematocrit were used to calculate changes in plasma volume there was a main effect for time (p < 0.001), indicating a significant increase from pre to post-training; however, there were no differences between groups (Table 2).
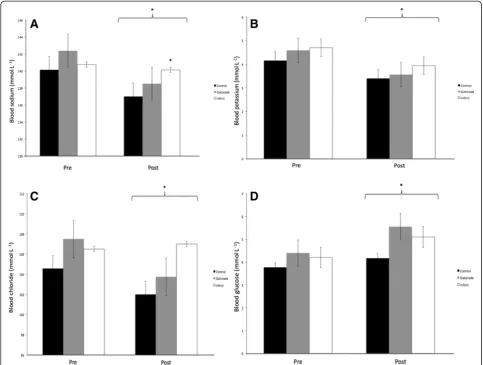
Electrolytes
Blood sodium concentrations were reduced 2.6% in the C and 2.3% in the G condition when compared to INW (p = 0.031, p = 0.069) (Figure 2). Post-training sodium concentration was different between C and INW condi-tions only (p = 0.031) (Figure 2A). Sodium intake was different between each group; however, the amount lost through sweat was not different (Table 2). This resulted in only the INW group having a near neutral sodium balance compared to C and G groups (p = 0.022) There was a main effect for time for both blood potassium and chloride concentration (p < 0.001, p < 0.001) (Figure 2). One-way ANOVA of the post-training measurements of these electrolytes suggested a trend towards difference in groups for chloride (p = 0.072).
Blood glucose
Despite the different carbohydrate concentrations be-tween groups, there was no difference bebe-tween condi-tions for blood glucose levels (Figure 2D). A main effect for time was found (p = 0.006), suggesting an increase in blood glucose after training.
Discussion
The present studies measured changes in hydration sta-tus of elite Olympic class sailors in cold and warm con-ditions. CCS revealed participants consumed insufficient fluids to prevent a decrease in body mass during train-ing, regardless of drink condition, causing a reduction in blood electrolyte concentration. WCS showed that
con-suming 11.5 mL.kg-1.h-1 of fluid from any condition
prevented a decrease in body mass, lowered USG in all conditions and blood sodium concentration and sodium
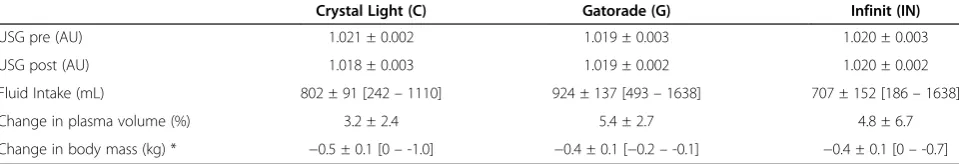
Table 2 Changes hydration status measured during the CCS
Crystal Light (C) Gatorade (G) Infinit (IN)
USG pre (AU) 1.021 ± 0.002 1.019 ± 0.003 1.020 ± 0.003
USG post (AU) 1.018 ± 0.003 1.019 ± 0.002 1.020 ± 0.002
Fluid Intake (mL) 802 ± 91 [242–1110] 924 ± 137 [493–1638] 707 ± 152 [186–1638]
Change in plasma volume (%) 3.2 ± 2.4 5.4 ± 2.7 4.8 ± 6.7
Change in body mass (kg) * −0.5 ± 0.1 [0–-1.0] −0.4 ± 0.1 [−0.2–-0.1] −0.4 ± 0.1 [0–-0.7]
Figure 1Changes in blood variables from the cold condition study (CCS). A–Blood sodium concentration,B–Blood potassium concentration,C- blood chloride concentration,D–Blood glucose concentration. * Above a bracket indicates a main effect for time (p < 0.05). All data are shown as mean ± SE.
Table 3 Changes of hydration variables measured in the WCS
Crystal Light (C) Gatorade (G) Infinit (INW)
USG pre (AU) 1.020 ± 0.003 1.020 ± 0.002 1.018 ± 0.002
USG post (AU)c 1.015 ± 0.006 1.007 ± 0.002 1.014 ± 0.002
Change in body mass (kg) 0.3 ± 0.1 0.4 ± 0.2 0.3 ± 0.2
Change in hemoglobin (%)+ −4.1 ± 1.5 −7.5 ± 1.6 −4.5 ± 3.0b
Change in plasma volume (%)+ 1.3 ± 0.28 1.7 ± 0.33 1.5 ± 0.82
Sweat rate (mL.h-1) 510.1 [20.9 -841.1] 597.3 [401.1–848.0] 727.2 [456.2-849.0]
Sodium intake (g)* 0 1.2 [1.1–1.2] 4.7 [4.4–4.7]
Sodium loss (g) 3.1 [0.94–5.9] 3.7 [2.0–5.8] 4.9 [2.0–7.4]
Sodium balance (g) −3.1 [−4.4–0.94] −2.5 [2.9 - -0.77] −0.23 [−1.2–2.7]a
* - All groups are significantly different from each other (p < 0.001). a–Significantly different from Crystal Light (p = 0.022). + Main effect for time indicating that there was an increase in plasma volume in all groups following training (p < 0.001). b–Significantly different from pre-training (p < 0.05). c–different from pre-training USG with a main effect for time (p = 0.003).
balance were maintained with the custom drink condi-tion (INW) only.
Hydration
The average pre-training USG value for all groups in both studies was 1.019 (Table 2 and 3), which is very close to the 1.020 threshold that has been associated with hypohydration [22]. As participants were encour-aged to consume fluids ad libitum prior to training, this finding suggests individual practices are inadequate.
Hamouti et al. [23] have suggested an athlete’s muscle
mass may influence USG values and therefore a USG measurement of 1.020 may not be an accurate cut-off for hypohydration. While developing an exact cut-off for hypohydration in athletes given their developed muscle mass compared the average population may require further study, the observed pre-practice USG values recorded during both studies were at the higher end of optimal. Since training began at 11:00 am daily, there
was adequate time for athletes to consume fluids prior to arriving at the sailing centre. Furthermore, the vari-ability between participants in pre-training USG mea-surements, especially in the WCS, favours inadequate fluid consumption as opposed to a higher rate of urine protein metabolites due to high muscle mass.
In the WCS, participants’fluid intake was standardized to 11.5 mL.kg-1.h-1to reflect previous recommendations on relative fluid intake [16] and enable the comparison of hydration status and sodium balance between subjects
and drinks. The decision to standardize participants’
fluid intake was also based partially on the variability of fluid intake observed during the CCS and from inad-equate fluid intake reported in previous studies [9,14]. A leading cause of insufficient fluid intake for athletes training and competing in cold temperatures is reduced thirst, which is restored in warm conditions [24]. Exam-ination of elite football players training in cool (5°C) temperatures revealed athletes consumed far less fluid
than was lost from sweating [15]. Furthermore, runners have been found to underestimate their sweat rates in cool conditions, despite accurate estimations of their fluid consumption [25]. These and our findings suggest athlete’s perception of sweat rates in cool climates is im-paired, which reinforces the need for specific hydration guidelines. The fluid requirements of participants in WCS (19.5°C [17.0 - 23.3]), were anticipated to reflect
the average laboratory sweat rate of 1470 mL.h-1
mea-sured at 21.8°C. The fluid intake rate of 11.5 mL.kg-1.h-1 was selected to deliver approximately 65% of the average laboratory sweat rate and a volume less than one litre (906.2 –971.8 mL.h-1), with a carbohydrate content be-tween 6-9%. This range of carbohydrate consumption in fluid replacement drinks has been identified as an optimal range for absorption and gastric emptying [6].
Further-more, consuming volumes greater than 1000 mL.h-1
dur-ing exercise has caused gastro-intestinal discomfort in highly trained individuals [26]. None of the participants in the study commented on any bloating or gastro-intestinal issues during or after training.
Surprisingly, participants’average on-water sweat rate was only 611.8 ± 47.2 mL.h-1. This was 41.5% lower than the pre-study laboratory sweat rate of 1470 mL.h-1. As a result, participants mean fluid intake was 933.33 ± 5.13 mL.h-1or 153.0% fluid replacement. Since on-water temperatures were similar to that of the laboratory sweat rate testing, it appears the cooling effect of splashing waves and brief pauses in activity between training drills did not elicit the same physiologic sweat response during sailing as seen during cycle exercise. This suggests la-boratory based sweat rate testing over estimates sweat rates observed on-water in this study. Therefore, the on water environmental conditions experienced by Olympic class sailors may have a direct modulating influence on sweat rate and fluid requirements. Based on our observa-tions, a lower fluid replacement rate would be more ap-propriate for the conditions experienced in this study. Extrapolating from the data presented, a fluid intake rate of 7.4 mL.kg-1.h-1would achieve the desired hydration state.
USG and electrolytes
The greater fluid consumption compared to fluid loss dur-ing WCS may account for some of our results. Analysis of USG showed an effect for time (p = 0.003) with lower values after training in all groups (Table 3). This was coupled with a main effect for time for body weight, whereby all groups increased body mass during training as direct result of fluid intake. This was a clear difference from CCS during which there was no difference in USG and a decrease in body mass post-training (p < 0.001). In CCS it was not surprising to see no difference between groups for measures of hydration status; however, given the 3 and 4 fold higher concentrations of sodium and
potassium between the INW and G drink conditions in WCS, we anticipated a difference between groups post-training. While it is clear that all groups retained fluid during training, an effect of the positive fluid balance, the higher sodium concentration in the INW condition did not have a compounding effect on fluid retention as could have been anticipated as observed in previous findings [27].
The sweat sodium loss of participants in WCS (Table 3) is similar to values reported by other groups studying elite athletes [15,28]. While there was no differ-ence in sodium loss with the different drinks, sodium balance was almost unchanged in the INW group com-pared to C and G conditions. This was a result of the INW drink being designed for full sodium replacement. Sodium intake is essential for the absorption and reten-tion of fluid during exercise [27]. Results from hydrareten-tion testing in other sports have shown elite athletes have dif-ficulty replacing sodium lost during training using fluid replacement drinks [19,29]. These finding, coupled with our results from CCS, can be explained in part by the ad libitum fluid consumption study protocol. This indicates athletes may have difficulty self-regulating their hydra-tion requirements particularly in cold condihydra-tions, as it is easy to become caught-up in the focus and intensity of training and/or competition. This further supports the need for individual, sport specific or relative fixed vol-ume fluid replacement recommendations.
Blood glucose carbohydrates intake
Examination of the energy demands of Laser sailing by Castagna and Brisswalter [11] revealed aerobic metabol-ism is the main energy source used by elite sailors to ful-fill muscle energy demands. As such, blood glucose levels in CCS were trending towards a decrease over time (p = 0.074), despite the supply of exogenous carbo-hydrates in the G and IN groups; although, the average carbohydrate intake in these groups was only 61 g and 42 g respectively. Interestingly, the blood glucose concen-tration of the C group was stable through the 2.5 h training session despite consuming no exogenous carbohydrates (Figure 1D). In comparison, trained cyclists working at
74% VO2max in laboratory conditions experienced a
sig-nificant decrease in blood glucose after 90 minutes of cyc-ling [30]. Examination of substrate metabolism during
60 minutes of cycling at 70% VO2max at 0°C revealed
al-most 60% of energy expenditure was from carbohydrate metabolism [31]. This level was maintained regardless of infused non-esterified fatty acids, suggesting that carbohy-drates are a preferred source of energy in cold conditions as fatty acid metabolism has been found to increase based on substrate availability in temperature environments [32]. While the intensity of Laser sailing in conditions similar
difference in intensity may have been enough to prevent deleterious changes in blood glucose in the C condition.
In WCS, blood glucose levels were surprisingly un-changed between the drink conditions (Figure 2D). Although a main effect for time was observed (p = 0.006), indicating that blood glucose was higher after training, this was largely driven by the G and INW groups. The carbohydrate content in the G drink was 66 g.L-1, which is approximately in-line with the current American College of Sports Medicine recommendations [4]. These guide-lines were based on the understanding that carbohydrates ingested during exercise could only be oxidized at a
max-imum rate of 1 g.min-1 [33]. However, advances in
car-bohydrate metabolism research have determined up to 1.75 g.min-1can be oxidized when using multiple trans-portable carbohydrates, such as glucose and fructose [34]. As such, the carbohydrate content in the INW drink was comprised of glucose and fructose delivered in a 2:1 ratio at 1.3–1.5 g.min-1 based on a concentration of 90 g.L-1. Previous work has determined this ratio of carbohydrate delivered in solution and ingestion at 1.5 g.min-1can im-prove exogenous carbohydrate metabolism during exercise by 13% [35] to 48% [36] compared to consuming an isoca-loric glucose only solution. While carbohydrate oxidation was not measured in this study, consuming a drink with high carbohydrate concentration using multiple trans-porters has a potentially powerful effect for sailing
ath-letes, as World Cup regattas last 5–7 days with up to
three hours of competitions per day. Therefore, reducing endogenous carbohydrate oxidation could potentially pre-serve stored muscle glycogen energy for later in the com-petition, which has previously been found to have a performance enhancing effect [37].
During competition, sailors can spend anywhere from two hours to six hours on-water, with time divided between warm-up, racing and waiting for changes in wind and wea-ther and cool-down. Given the length of time on-water, the co-ingestion of carbohydrates and protein is necessary to prevent extended periods of muscle protein breakdown. Research examining the addition of whey protein to carbo-hydrate electrolyte beverages has revealed inconsistent re-sults for improved athletic performance in both acute exercise [38,39] and cycling time trials [40,41]. In these studies, the addition of protein to an experimental beverage was focused on improving athletic performance in acute ex-ercise. In contrast, the addition of protein to a carbohydrate electrolyte drink used during multi-day competitions may be more appropriate for metabolic reasons and worthy of continued investigation. Saunders et al. [42] found the use of a fluid replacement drink fortified with protein during a two cycle-to-exhaustion tests within the same day was ef-fective in attenuating the nutritional deficit incurred during exercise and helped to reduce skeletal muscle damage com-pared to a carbohydrate electrolyte drink alone. Therefore,
performing multiple bouts of exercise within a day or con-secutive days of competition may be necessary to fully ob-serve the nutritional and physiologic effects of protein ingested with a carbohydrate electrolyte beverage during exercise [43].
Limitation
The authors acknowledge there were several limitations to the present study. The sample size for both studies was calculated to detect electrolyte changes. Based on subject variability and the applied nature of this research additional subjects would have been beneficial to detect differences between conditions; however, the maximum number of available participants was recruited.
Conclusion
Participants in the ad libitum design CCS were unable to maintain hydration status in any condition due to in-adequate fluid consumption. This may have resulted from a reduced desire to drink and/or poor estimation of individual hydration requirements in cold tempera-tures. When 11.5 mL.kg-1.h-1 of fluid was consumed in the WCS, all conditions improved urinary markers of hydration and prevented a loss of body mass. The C and G conditions were unable to maintain blood electrolyte concentrations while the customized INW condition was effective in maintaining blood sodium concentra-tions but not potassium. This was the first study to test relative fluid intake based on laboratory sweat rate on the hydration requirements of Olympic class sailors in warm conditions. Therefore, it is important to note that laboratory sweat testing results did not directly corres-pond with on-water sweat rate. This finding may guide further research of the hydration requirements of sailors in different environmental conditions.
Competing interests
The authors declare that they have no competing interests.
Author contributions
EJHL, SGT and GDW participated in study conception and design. EJHL and SJF performed data collection. EJHL performed statistical analysis and data analysis with SGT and GDW. All authors participated in writing, editing and approval of the final manuscript.
Acknowledgments
The authors would like to thank the athletes and coaches for their participation in this study and the Canadian Yachting Association and CORK for the use of their facilities. Additionally, we would like to thank the Canadian Sport Centre Ontario for the use of their equipment and resources. Evan Lewis was supported by an Ontario Ministry of Health Promotion Research Program in Applied Sport Science Grant and a Mitacs Accelerate Award.
Author details
1Department of Nutritional Sciences, University of Toronto, 150 College
Medicine, The Hospital for Sick Children, 555 University Avenue, Toronto, ON M5G 1X8, Canada.
Received: 19 September 2012 Accepted: 7 February 2013 Published: 21 February 2013
References
1. Hargreaves M, Dillo P, Angus D,et al:Effect of fluid ingestionon on muscle metabolism during prolonged exercise.J Appl Physiol1996,80:363–366. 2. D’anci KE, Vibhakar A, Kanter JH,et al:Voluntary dehydration and
cognitive performance in trained college athletes.Perception and Motor Skills2009,109:251–269.
3. Coyle E:Fluid and fuel intake during exercise.Journal of Sports Science 2004,22:39–55.
4. ACSM:Exercise and fluid replacement: Position stand.Medicine and Science in Sports and Exercise2007,39:377–390.
5. Costill D:Sweating: Its composition and effects on body fluids.Annals New York Academy of Science1977,301:160–174.
6. Coyle E, Montain S:Benefits of fluid replacement with carbohydrate during exercise.Medicine and Science in Sports and Exercise1992, 24:S324–S330.
7. Adam GE, Carter R, Cheuvront SN,et al:Hydration effects on cognitive performance during military tasks in temperate and cold environments.
Physiology and Behaviour2008,93:748–756.
8. Allen J, De Jong M:Sailing and sports medicine: A literature review.Br J Sports Med2006,40:587–593.
9. Slater G, Tan B:Body mass changes and nutrient intake of dinghy sailors while racing.J Sports Sci2007,25:1129–1135.
10. Legg SJ, Smith P, Slyfield D,et al:Knowledge and reported use of sport science by elite new zealand olympic class sailors.J Sports Med Phys Fitness1997,37:213–217.
11. Castagna O, Brisswalter J:Assessment of energy demand in laser sailing: Influences of exercise duration and performance level.Eur J Appl Physiol 2007,99:95–101.
12. Vogiatzis I, Spurway N, Wilson J,et al:Assessment of aerobic and anaerobic demands of dinghy sailing at different wind velocities.J Sports Med Phys Fitness1995,35:103–107.
13. Neville V, Gant N, Folland J:Thermoregulatory demands of elite professional america’s cup yacht racing.Scand J Med Sci Sports2009, 20:475–484.
14. Kurdak S, Shirreffs SM, Maughan R,et al:Hydration and sweating responses to hot-weather football competition.Scand J Med Sci Sports 2010,20:133–139.
15. Maughan RJ, Shirreffs SM, Merson SJ,et al:Fluid and electrolyte balance in elite male football (soccer) players training in a cool environment.
J Sports Sci2005,23:73–79.
16. Mitchell JB, Voss W:The influence of volume on gastric emptying and fluid balance during prolong exercise.Medicine and Science in Sports and Exercise1991,23:314–319.
17. Patterson MJ, Galloway SD, Nimmo MA:Variations in regional sweat composition in normal human males.Exp Physiol2000,85:869–875. 18. Fletcher E, Cunningham P:Indoor rowing: Sailing guide. Concept 2. 2007.
http://concept2.co.uk/training/sailing.
19. Palmer M, Spriet L:Sweat rate, salt loss and fluid intake during an intense on-ice practice in elite canadian male junior hockey players.Appl Physiol Nutr Metab2008,33:263–271.
20. Laursen P, Suriano R, Quod M,et al:Core temperature and hydration status during an ironman triathlon.Br J Sports Med2006,40:320–325. 21. Dill DB, Costill DL:Calculation of percentage changes in volumes of
blood, plasma, and red cells in dehydration.J Appl Physiol1974, 37:247–248.
22. Casa DJ, Armstrong LE, Hillman SK,et al:National athletic trainer’s association position statement: Fluid replacement for athletes.Journal of Athlete Training2000,35:212–224.
23. Hamouti N, Del Coso J, Avila A,et al:Effects of athletes’muscle mass on urinary markers of hydration status.Eur J Appl Physiol2010,109:213–219. 24. Kenefick RW, Hazzard MP, Mahood NV,et al:Thirst sensations and avp
responses at rest and during exercise-cold exposure.Medicine and Science in Sports and Exercise2004,36:1528–1534.
25. Passe D, Horn M, Stofan J,et al:Voluntary dehydration in runners despite favorable conditions for fluid intake.Int J Sport Nutr Exerc Metab2007, 17:284–295.
26. Noakes TD:Fluid replacement during exercise.Exercise Sport Science Review1993,21:297–330.
27. Takamata A, Mack GW, Gillen CM,et al:Sodium appetite, thirst and body fluid regulation in humans during rehydration without sodium replacement.American Journal of Physiology Regulation and Integrated Comparative Physiology1994,266:1493–1502.
28. Shirreffs SM, Aragon-Vargas LF, Chamorro M,et al:The sweating response of elite professional soccer players to training in the heat.Int J Sports Med2005,26:90–95.
29. Maughan R, Merson SJ, Broad NP,et al:Fluid and electrolyte intake and loss in elite soccer players during training. International Journal of Nutrition and Exercise.Metabolism2004,14:333–346.
30. Coyle E, Hagberg J, Hurley B,et al:Carbohydrate feeding during prolonged strenuous exercise can delay fatigue.J Appl Physiol1983, 55:230–235.
31. Layden J, Malkova D, Nimmo MA:During exercise in the cold increased availability of plasma nonesterified fatty acids does not affect the pattern of substrate oxidation.Metabolism2004,53:203–208.
32. Hawley JA:Effect of increased fat availability on metabolism and exercise capacity.Medicine and Science in Sports and Exercise2002,34:1485–1491. 33. Jeukendrup A, Tipton K:Legal nutritional boosting for cycling.Curr Sports
Med Rep2009,8:186–191.
34. Jeukendrup A:Carbohydrate and exercise performance: The role of multiple transportable carbohydrates.Current Opinions in Clinical Nutrition and Metabolic Care2010,13:452–457.
35. Jeukendrup A, Moseley L, Mainwaring G,et al:Exogenous carbohydrate oxidation during ultra endurance exercise.J Appl Physiol2006, 100:1134–1141.
36. Jentjens R, Underwood K, Achten J,et al:Exogenous carbohydrate oxidation rates are elevated after combined ingestion of glucose and fructose during exercise in the heat.J Appl Physiol2006,100:807–816. 37. Coyle E, Coggan AR:Muscle glycogen utilized during prolonged exercise
when fed carbohydrate.J Appl Physiol1986,61:165–172. 38. Ivy JL, Res PT, Sprague RC,et al:Effect of a carbohydrate-protein
supplement on endurance performance during exercise of varying intensity.Int J Sport Nutr Exerc Metab2003,13:382–395.
39. Romano-Ely BC, Todd MK, Saunders MJ,et al:Effect of an isocaloric carbohydrate-protein-antioxidant drink on cycling performance.Medicine and Science in Sports and Exercise2006,38:1608–1616.
40. Toone RJ, Betts JA:Isocaloric carbohydrate versus carbohydrate-protein ingestion and cycling time-trial performance.Int J Sport Nutr Exerc Metab 2010,20:34–43.
41. van Essen M, Gibala MJ:Failure of protein to improve time trial performance when added to a sports drink.Medicine and Science in Sports and Exercise2006,38:1476–1483.
42. Saunders MJ, Kane MD, Todd MK:Effects of a carbohydrate-protein beverage on cycling endurance and muscle damage.Medicine and Science in Sports and Exercise2004,36:1233–1238.
43. Cathcart AJ, Murgatroyd SR, McNab A,et al:Combined carbohydrate– protein supplementation improves competitive endurance exercise performance in the heat.Eur J Appl Physiol2011,111:2051–2061.
doi:10.1186/1550-2783-10-11