R E S E A R C H A R T I C L E
Open Access
Chronic TCR-MHC (self)-interactions limit
the functional potential of TCR
affinity-increased CD8 T lymphocytes
Minh Ngoc Duong, Efe Erdes, Michael Hebeisen
*†and Nathalie Rufer
*†Abstract
Background:Affinity-optimized T cell receptor (TCR)-engineered lymphocytes targeting tumor antigens can mediate potent antitumor responses in cancer patients, but also bear substantial risks for off-target toxicities. Most preclinical studies have focused on T cell responses to antigen-specific stimulation. In contrast, little is known on the regulation of T cell responsiveness through continuous TCR triggering and consequent tonic signaling. Here, we addressed the question whether increasing the TCR affinity can lead to chronic interactions occurring directly between TCRs and MHC-(self) molecules, which may modulate the overall functional potency of tumor-redirected CD8 T cells. For this purpose, we developed two complementary human CD8 T cell models (i.e. HLA-A2 knock-in and knock-out) engineered with incremental-affinity TCRs to the HLA-A2/NY-ESO-1 tumor antigen.
Methods:The impact of HLA-A2 recognition, depending on TCR affinity, was assessed at the levels of the TCR/CD3 complex, regulatory receptors, and signaling, under steady-state conditions and in kinetic studies. The quality of CD8 T cell responses was further evaluated by gene expression and multiplex cytokine profiling, as well as real-time quantitative cell killing, combined with co-culture assays.
Results:We found that HLA-A2 per se (in absence of cognate peptide) can trigger chronic activation followed by a tolerance-like state of tumor-redirected CD8 T cells with increased-affinity TCRs. HLA-A2posbut not HLA-A2negT cells displayed an activation phenotype, associated with enhanced upregulation of c-CBL and multiple inhibitory
receptors. T cell activation preceded TCR/CD3 downmodulation, impaired TCR signaling and functional
hyporesponsiveness. This stepwise activation-to-hyporesponsive state was dependent on TCR affinity and already detectable at the upper end of the physiological affinity range (KD≤1μM). Similar findings were made when affinity-increased HLA-A2negCD8 T cells were chronically exposed to HLA-A2pos-expressing target cells.
Conclusions:Our observations indicate that sustained interactions between affinity-increased TCR and self-MHC can directly adjust the functional potential of T cells, even in the absence of antigen-specific stimulation. The observed tolerance-like state depends on TCR affinity and has therefore potential implications for the design of affinity-improved TCRs for adoptive T cell therapy, as several engineered TCRs currently used in clinical trials share similar affinity properties.
Keywords:Immunotherapy, Preclinical study, CD8 T cells, NY-ESO-1 tumor antigen, TCR affinity optimization, TCR/ CD3 complex, T cell activation, Receptor signaling, T cell function
© The Author(s). 2019Open AccessThis article is distributed under the terms of the Creative Commons Attribution 4.0 International License (http://creativecommons.org/licenses/by/4.0/), which permits unrestricted use, distribution, and reproduction in any medium, provided you give appropriate credit to the original author(s) and the source, provide a link to the Creative Commons license, and indicate if changes were made. The Creative Commons Public Domain Dedication waiver (http://creativecommons.org/publicdomain/zero/1.0/) applies to the data made available in this article, unless otherwise stated. * Correspondence:[email protected];[email protected]
†Michael Hebeisen and Nathalie Rufer contributed equally to this work.
Background
Recent progress in oncology has shown that cytotoxic CD8 T cells are essential players in generating protective and durable immune responses against cancer. Efficient triggering of T cell responses is mainly dictated by the strength of T cell receptor (TCR) binding to cognate peptide-MHC (pMHC), i.e. the TCR-pMHC affinity/ avidity. Seminal clinical trials demonstrated the import-ance of TCR-pMHC affinity/avidity in cimport-ancer patients treated with engineered T cells of enhanced TCR affinity [1]. Clinical studies performed with affinity-enhanced T cells against the cancer testis HLA-A2/NY-ESO-1157-165
antigen provided augmented in vivo functional capacity and improved tumor growth control [2–4]. The genetic-ally modified TCR (1G4α95:LY) has been largely used to treat patients with melanoma, sarcoma or multiple mye-loma without major harmful effects [2–4]. In contrast, the clinical success of affinity-enhanced TCRs specific for other antigens was associated with off-target adverse events, leading to serious and potentially lethal toxicities [1], as with the MAGE-A3/HLA-A1 TCR [5,6]. Compiled data from numerous experimental models further indicate that T cell activation and subsequent function can be lim-ited to a particular TCR-pMHC affinity window [7]. Not-ably, T cells expressing TCRs with increased affinity, above the physiological range, or with prolonged half-lives, display substantial functional defects. This likely in-volves the presence of negative feedback mechanisms, which may prevent overreactive T cell responses [8, 9]. Collectively, there is a clear need to promote better pre-clinical strategies, including the prediction of optimized T cell responsiveness and off-target toxicity related to en-hanced TCR-pMHC affinity, to guarantee the safety of candidate TCRs for clinical testing.
While tolerance mechanisms related to TCR affinity have been well documented in thymocytes during cen-tral tolerance induction [10], only limited information is available on the regulatory processes underlying periph-eral T cell-mediated responses against tumor or micro-bial antigens according to TCR affinity. Models using affinity-matured TCR variants [11] or altered peptide li-gands [12] have revealed defined tolerogenic mecha-nisms such as deletion or anergy. For instance, CD8 T cells engineered with a TCR of nanomolar affinity are rapidly deleted through mechanisms of peripheral T cell tolerance [11]. Moreover, increasing the TCR signaling strength by altered peptide ligands favors anergy induc-tion [12]. Gallergos et al. further described that CD4 T cells expressing a TCR of higher avidity were less able to control Mycobacterium tuberculosis infection in vivo than T cells of intermediate avidity [13]. Specifically, this study identified programmed TCR downregulation as a potential mechanism restricting high avidity CD4 T cell responses at the peak of clonal expansion [13]. Along
this line, we reported that SHP-1 phosphatase activity and PD-1 were involved in limiting T cell signaling and function, depending on TCR affinity, in tumor-specific CD8 T cells of increased-affinity TCRs [9,14]. Together, these observations revealed the presence of negative feedback mechanisms restricting antigen-specific T cell responses in relation to the TCR-pMHC affinity.
TCR affinity-optimization strategies imply the modifica-tion of TCR sequences by inserting point-mutamodifica-tions within the complementary-determining regions (CDRs) of the TCRα- and/or β-chains. Initial studies showed that high affinity TCR variants generated by mutations in the CDR1, CDR2 or CDR3 loops retained remarkable peptide specificity [15]. Single and dual CDR3αand CDR2βamino acid changes further allowed the enhancement of antigen-specific reactivity in TCR-redirected CD4 and CD8 T cells [16]. Through a rational design approach, we previously established a panel of incremental affinity to the HLA-A2/ NY-ESO-1 tumor antigen, mostly involving amino-acid changes in CDR2β combined to single point-mutations within CDR3βand/or CDR2α[9,17]. These TCR affinity-enhanced variants retained NY-ESO-1 specificity and similar peptide recognition patterns as the wild-type re-ceptor [17]. Since improved TCR affinity (KD≤1μM)
mainly resulted from increased contacts with the HLA-A2 (referred to as A2) backbone [17], we hypothesized that A2-(self) molecules per se may directly trigger chronic in-teractions with affinity-increased TCRs and modulate the functional state of tumor-redirected CD8 T cells, even in the absence of cognate peptide. To address this issue, we generated two complementary CD8 T cell models. Jurkat J76 CD8αβT cells (A2 knock-in) engineered with affinity-increased TCRs were used to assess the impact of A2 at the TCR/CD3 complex, regulatory receptor and signaling levels, under steady-state conditions and in kinetic studies. TCR-redirected primary CD8 T lymphocytes, knocked-out for the A2 allele (i.e. A2neg) or not (A2pos), further provided a unique experimental setting for evaluating the quality of T cell responses through various biological out-comes. Together, our data provide strong evidence that chronic TCR-A2 (self)-interactions can directly induce the early activation of tumor-redirected CD8 T cells, followed by a tolerance-like state. Importantly, this occurred readily in T cells expressing TCRs at the upper limit of the nat-ural affinity range, indicating possible consequences for T cell adoptive immunotherapy, currently based on such TCR affinity-optimization strategies [1].
Materials and methods
Culture of cell lines and primary CD8 T lymphocytes
NA8 cells (CVCL-S599) were cultivated and primary CD8 T lymphocytes were generated from peripheral blood cells as described in detail in the Additional file1.
Generation of A2 primary CD8 T cells and CRISPR-A2 NA8 tumor cells
CRISPR-A2 primary CD8 T cells and NA8 cells were gen-erated based on the design of the 20 nucleotide-single guide (sgRNA) sequence targeting HLA-A*0201 (GAGG GTCCGGAGTA TTGGGA) as described in detail in the Additional file1. In brief, following the generation of the lenti-CRISPR-A2 plasmid and subsequent production of lentiviral particles, ultra-concentrated supernatant was used to infect freshly isolated A2pos CD8 T lymphocytes after 24 h stimulation with CD3/CD28 beads (1st expan-sion) or NA8 cells to create CRISPR-A2 (A2neg)-CD8 T cells or CRISPR-A2 (A2neg)-NA8 cells, respectively. Lenti-CRISPR-EGFP sgRNA 6 (Addgen plasmid #51765) was used as a mock control. Transduced cells (A2neg) were sorted to purity with PE-labeled HLA-A2 antibody by flow cytometry (FACSAriaII, BD Biosciences).
Generation of A2posJ76 CD8αβT cells
HLA-A*0201 sequence was codon-optimized with Geneart tool (Thermofisher) and subsequently cloned into pRRL lentiviral plasmid. The sequence was confirmed by DNA sequencing. Supernatant of lentiviral-transfected 293 T cells was used to infect A2negJ76 CD8αβcells, allowing the gen-eration of A2posJ76 CD8αβcells. Surface expression of A2 molecules was assessed with PE-labeled HLA-A2 antibody by flow cytometry (FACSAriaII, BD Biosciences) and yielded over 95% of A2posJ76 CD8αβcells.
Generation of TCR-engineered primary CD8 T cells and J76 CD8αβT cells
The plasmids encoding for the panel of incremental affinity TCRs against A2/NY-ESO-1157-165(Additional file1: Table
S1) were cloned as described in the Additional file1. Super-natant of lentiviral-transfected 293 T cells was used to in-fect (i) A2posand A2negprimary CD8 T cells stimulated for 24 h with CD3/CD28 beads (1st expansion), (ii) CRISPR-A2 and CRISPR-EGFP primary CD8 T cells stimulated for 24 h with phytohemagglutinin (PHA) and A2negfeeder cells (2nd expansion), or (iii) A2posand A2negJ76 CD8αβT cells. For functional analysis, primary CD8 T cells were sorted between 15 and 21 days post TCR transduction with PE-labeled A2/NY-ESO-1157-165-specific multimer by flow
cy-tometry (FACSAriaII, BD Biosciences). During 10 days after re-stimulation with PHA/A2negfeeder cells (3rd expansion), primary CD8 T cells were regularly counted by trypan blue and population doubling was calculated based on the initial cell number obtained after sort with multimer.
Surface staining by flow cytometry
Surface staining was performed by incubating 1-3 × 10⁵ TCR-transduced A2pos and A2neg J76 CD8αβ cells or primary CD8 T cells at 4 °C with NY-ESO-1 multimers for 40 min and/or corresponding antibodies (panTCRαβ, CD3ε, CD5, PD1, TIM-3, TIGIT, 2B4, CD69, CD25, 4-1BB, CD28; Additional file 1: Table S2) for 20 min. For total CD3ε expression analysis, cells were fixed in PBS 1% formaldehyde before being stained with the corre-sponding antibody and permeabilized with 0.1% saponin. Annexin V and Ki67 staining were performed according to the manufacturer’s instructions (BD Biosciences). All experiments were performed under unstimulated, resting culture conditions. Samples were acquired with a Gallios (Beckman Coulter) flow cytometer and data were ana-lyzed by FlowJo software (Tree star, v10.0.8). Co-expression analysis was performed with SPICE software (v.5.35, NIH, Bethesda).
Phospho-flow assay
2.5 × 10⁵ TCR-transduced A2pos and A2neg J76 CD8αβ cells were left unstimulated or stimulated with either 1μg/ ml unlabeled A2/NY-ESO-1157-165 multimer or 10μg/ml
OKT3 anti-CD3εantibody or 1μg/ml PMA and 250 ng/ ml ionomycin for 5 min. Cells were fixed with 4% parafor-maldehyde (Polysciences) for 10 min at 37 °C followed by permeabilization with 100% ice-cold methanol (Sigma Al-drich) for 20 min before being stained with the following antibodies for 30 min at room temperature: anti-phospho-CD3ζ(CD247) Alexa Fluor647 (Y142, Clone: K25–407.6, BD Phosflow), anti-phospho-ERK1/2 Alexa Fluor® 647 (T202/Y204 of ERK1 and T185/Y187 of ERK2, Clone: E10, Cell Signaling Technology), and anti-total c-CBL (Clone: YE323, Abcam). Samples were acquired with a Gallios (Beckman Coulter) flow cytometer and data were analyzed by FlowJo software (Tree star).
Microarray analysis
Genome-wide microarray analysis was previously per-formed on A2posprimary CD8 T cells engineered with the panel of NY-ESO-1-specific TCR variants (GSE42922) [9]. Gene set enrichment was analyzed with GSEA (www. broadinstitute.org/gsea). Enrichment was considered sig-nificant if nominalpvalue was < 0.05 and false discovery rate (FDR) was < 0.25.
Multiplex cytokine profiling assay
0.1 × 10⁶ A2pos or A2neg primary CD8 T cells were seeded in 96-well plate. After 1 day, cells were left either unstimulated or were stimulated with 0.1 nM (0.025μg/ ml) unlabeled A2/NY-ESO-1157-165 multimer for 24 h.
human Th cytokine panel (Biolegend) according to the manufacturer’s instructions.
Real-time IncuCyte killing assay
104 A2pos NA8 cells were seeded per well in 96-well plates 1 day before TCR-transduced A2pos (CRISPR/ GFP) or A2neg (CRISPR/A2) primary CD8 T cells were added at an E:T ratio of 1:10, with or without 1 nM NY-ESO-1157-165 peptide. IncuCyte caspase-3/7 reagent
(Essen Bioscience) was added at 10μM final. Cell conflu-ence and apoptosis were monitored every 2 h for 3–4 days with 10X camera in the IncuCyte system. Data was analyzed with the integrated software.
Coculture experiments
For TCR-redirected primary CD8 T cell cocultured with NA8 cells, 3 × 10⁵A2posor A2negNA8 cells were seeded per well in 24-well plates for 1 day, and CRISPR-A2 (A2neg) CD8 T cells expressing the indicated TCR vari-ants were added at a 1:1 ratio and cocultured for 3 days. For long-term cocultures, A2negCD8 T cells were passed every 3–4 days on a new layer of A2pos or A2neg NA8 cells. Cells were harvested and labeled with antibodies before being analyzed by flow cytometry. CD8 T cells and NA8 cells were distinguished based on FCS-SSC pa-rameters and CD8 staining. In the mixed primary CD8 T cell coculture, CRISPR-A2 (A2neg)- and CRISPR-EGFP (A2pos) CD8 T cells were mixed at a 1:1 ratio immedi-ately prior to TCR transduction by lentivectors. Cells were stained with surface antibodies and analyzed by flow cytometry at indicated time post-TCR transduction. A2pos and A2neg CD8 T cells were distinguished based on the A2 staining.
Statistical analysis
Data were analyzed using Prism software (GraphPad, v.7.03). Direct comparison between A2pos(CRISPR/GFP) and A2neg (CRISPR/A2) primary CD8 T cells or A2pos and A2neg J76 CD8αβT cells transduced with the same TCR variant were performed using matched, two-way ANOVA followed by Sidak’s multiple comparisons test. The numbers of independent experiments as well as the associated P values at α= 0.05 wherever the difference was significant are indicated throughout the manuscript.
Results
Downregulation of basal TCR/CD3 complex depends on both TCR affinity and HLA-A2 expression
Through structure-based rational predictions [18], we have established a panel of affinity-increased TCRs for the NY-ESO-1 tumor antigen presented in the context of HLA-A2 (referred to as A2) (Additional file 1: Table S1 [17];), and reported significant reduced levels of sur-face TCR/CD3εin A2posprimary CD8 T cells redirected
with increased affinity TCRs [14]. This was readily ob-served under steady-state conditions, i.e. in long-term cultures of primary resting CD8 T cells in the absence of cognate antigen, that were periodically restimulated with phytohemagglutinin and feeder cells. Extending on this study, however, we did not find major changes in the baseline expression of TCRαβor of CD28 costimulatory receptor within engineered CD8 T lymphocytes express-ing the same TCR affinity panel but lackexpress-ing A2 (Fig. 1
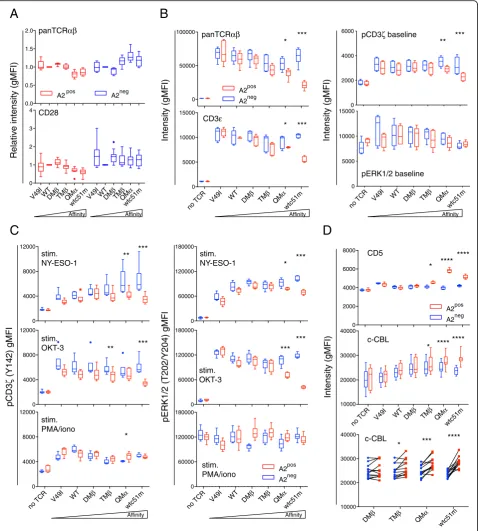
a). These data suggest a critical role of A2 expression in modulating basal levels of the TCR/CD3 complex, according to TCR affinity. Therefore, we next used the Jurkat 76 (i.e. J76) A2neg T cell subline, which is devoid of endogenous TCRαβ chains, but was modified to express CD8αβ (Edes and Uckert et al.,unpublished data; Additional file1: Figure S1A), to study the function of the redirected TCR complex and its components. We generated J76 CD8αβ T cells ex-pressing A2 de novo by lentiviral transduction and showed that the A2 molecules were fully functional (Additional file1: Figure S1B, C). Following TCR transduction with affinity-enhanced variants and under resting culture conditions, levels of surface TCRαβand CD3εas well as of the prox-imal phospho-CD3ζ signaling molecule were down-modulated in de novo A2-expressing J76 cells along the TCR affinity gradient, when compared to A2negJ76 cells (Fig.1b, Additional file 1: Figure S1D). This was not the case for the total (i.e. intracellular and extracellular) levels of CD3ε (Additional file 1: Figure S1E) and the distal ERK1/2 signaling node (Fig. 1b). Together, these results demonstrate that basal downregulation of the TCR/CD3 complex and associated CD3ζin redirected J76 CD8αβT cells depends on both TCR affinity and A2 expression.
Basal TCR/CD3 downregulation leads to impaired TCR signaling capacity
To assess whether this TCR/CD3 downregulation state impacts on the signaling potential of the J76 CD8αβ T cells in response to cell activation, we measured the phosphorylation levels of CD3ζ and ERK1/2 under vari-ous stimulation conditions (Fig. 1 c, Additional file 1: Figure S2A). Antigen-specific TCR-triggering by A2/NY-ESO-1157-165 multimers and TCR-dependent
cross-linking with the CD3ε/OKT3 antibody generated drastic declines in both phospho-CD3ζ and phospho-ERK1/2 levels. This mostly occurred for the TCR variants dis-playing TCR affinities at the limit or above the natural affinity range (i.e. TMβ, QMα and wtc51m) and was only detected in A2posJ76 cells. In contrast, stimulation with PMA/ionomycin, which bypasses the TCR/CD3 complex, led to comparable patterns of CD3ζ and of ERK1/2 phosphorylation between A2pos and A2neg J76 CD8αβT cells and across the TCR affinity range (Fig.1
B
Affinity Affinity
Intensity (gMFI)
no
TCR V49I WT DMβ TMβ QM
α
wtc51m
pERK1/2 baseline
** ***
pCD3ζ baseline
0 5000 10000 15000 0 50000 100000
no TCR
V49I WT DMβ TMβ QMα wtc51m
CD3ε panTCRαβ
* ***
*** *
A2pos A2neg
0 2000 4000 6000
0 5000 10000 15000
Intensity (gMFI)
0 4000 8000 12000
C
Affinity Affinity
pCD3
ζ
(Y142) gMFI
pERK1/2 (T202/Y204) gMFI
0 4000 8000 12000 0 4000 8000 12000
0 60000 120000 180000 0 60000 120000 180000
0 60000 120000 180000
no TCR
V49I WT DMβ TMβ QM α
wtc51m
stim. NY-ESO-1
stim. NY-ESO-1
stim. OKT-3
stim. PMA/iono
stim. PMA/iono stim. OKT-3
** ***
* ***
*** ***
***
no TCR
V49I WT DMβ TMβ QM α
wtc51m **
*
A2pos A2neg
A
0.0 0.5 1.0 1.5 2.0
Relative intensity (gMFI)
panTCRαβ
0 1 2 3 4 CD28
Affinity Affinity V49I WTDMβTMβQM
α
wtc51mV49I WTDM
β
TMβQM
α
wtc51m
D
10000 20000 30000 40000
******** *
c-CBL
10000 20000 30000 40000
c-CBL
DMβ TMβ QM α
wtc51m no TCR V49I
WT DMβ TMβ QM α
wtc51m 0
2000 4000 6000
8000 CD5
**** **** *
*** **** *
Intensity (gMFI)
A2pos A2neg
A2pos A2neg
Fig. 1Baseline expression levels of the TCR/CD3 complex, CD5 and c-CBL and phosphorylation levels of CD3ζand ERK upon stimulation in relation to HLA-A2.a, bExpression levels of TCR/CD3 complex and CD28 in A2posand A2negprimary CD8 T cells (a) or A2posand A2negJ76
CD8αβcells (b) engineered with TCRs of incremental affinities and analyzed under steady-state culture condition, in the absence of cognate antigen.cQuantification of CD3ζand ERK1/2 phosphorylation in TCR-expressing A2posand A2negCD8αβJ76 cells after stimulation with NY-ESO-1
multimer, OKT3 (anti-CD3ε) antibody or PMA/Ionomycin.dQuantification of CD5 and c-CBL expression in A2posand A2negCD8αβJ76 cells. Direct
comparison (bottom panel) of c-CBL expression in A2negversus A2posCD8αβJ76 cells for the indicated TCR variants by two-tailed, pairedttest. a-dData are means ± SD and representative of 5 to 15 independent experiments. TCR-transduced A2poscells versus A2negT cells are depicted as
(CD3ζ) and distal (ERK1/2) signaling capacity after TCR-mediated cell activation. Again, impairment in TCR signaling required the presence of A2.
Basal TCR/CD3 downregulation is linked to enhanced CD5 and c-CBL levels
TCR signaling is negatively regulated by the E3 ubiquitin-protein ligase CBL and the CD5 co-receptor. Whereas c-CBL has been shown to control ubiquitination and degradation of the CD3 chains [19], CD5 acts as a scaffold for c-CBL-mediated ubiquitylation in response to TCR stimulation [20, 21]. Given the importance of both mole-cules in TCR signaling regulation, we wondered whether CD5 and c-CBL were involved in the TCR/CD3 downreg-ulation state observed in A2-expressing J76 T cells of high affinity TCRs. Under baseline conditions, we found signifi-cant increased expression of CD5 and of total c-CBL in A2posJ76 CD8αβT cells with high affinity TCRs (Fig.1d, Additional file 1: Figure S2B). Conversely, only minimal differences in expression were seen in J76 cells lacking the A2 molecule. These observations suggest that downmodu-lation of the TCR/CD3 complex could be mediated by CD5 and c-CBL, whereby c-CBL might directly be in-volved in CD3ζdegradation through ubiquitination pro-cesses. Once more, this was already observed in engineered CD8 T cells expressing TCRs at the upper end of the physiological affinity range (i.e. TMβ) and occurred through the recognition of A2.
Phenotypic activation precedes TCR/CD3 downregulation upon affinity-increased TCR transduction
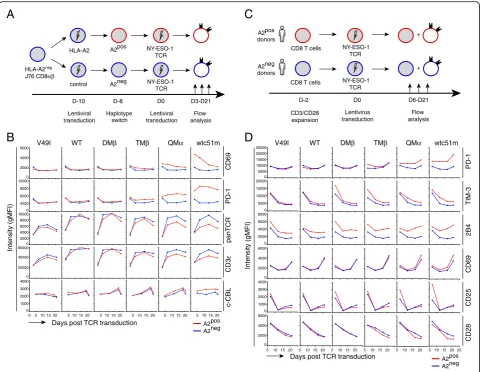
TCR downmodulation was previously reported as a con-sequence of T cell activation [13, 22]. Hence, we next explored the dynamics of TCR/CD3ε downmodulation alongside to co-activating/co-inhibitory receptor expres-sion, by performing kinetic studies, in which A2pos and A2negJ76 CD8αβT cells were followed for various time-points upon TCR transduction (Fig. 2 a). Rapid (at day 3) and sustained expression of the activation marker CD69 associated to increased PD-1 levels were exclu-sively found in TCR affinity-increased A2pos J76 cells (Fig. 2b, Additional file 1: Figure S2C). From day 7 and onwards, these cells, in contrast to A2negcells, also dis-played reduced surface expression of TCRαβ and of CD3ε, which inversely correlated to augmented total CBL protein. Similar longitudinal experiments were per-formed on primary CD8 T lymphocytes isolated from A2pos and A2neg healthy donors following TCR trans-duction (Fig.2 c). Consistent with the data obtained for the J76 model, several co-inhibitory receptors (i.e. PD-1, TIM-3, 2B4) and activation markers (i.e. CD25, CD69) were found rapidly upregulated in A2pos but not A2neg primary T cells, according to TCR affinity (Fig.2d). Ex-cept for CD25, this upregulation was maintained
over-time post-TCR transduction, and contrasted to the downmodulation of CD28 costimulatory molecule oc-curring only at later time-points (Fig.2 d) or to the re-duced TCRαβ levels found in long-term cultures (Fig.1
a [14];). Overall, these data revealed a step-wise early ac-tivation state followed by TCR/CD3 and CD28 downreg-ulation in A2posCD8 T cells of increased affinity TCRs.
A2 expression is required to induce strong activation upon affinity-increased TCR transduction in primary CD8 T cells
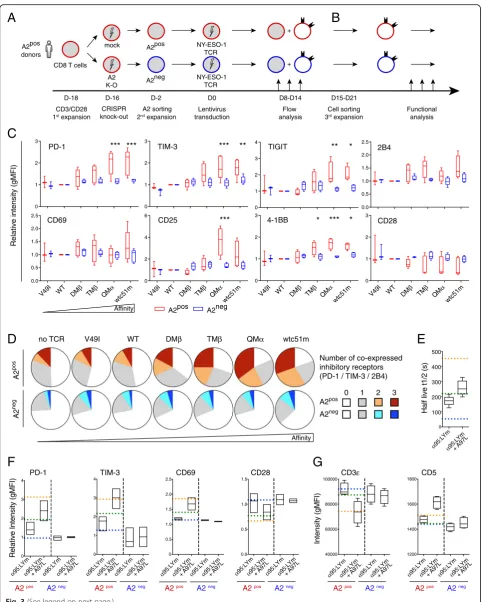
To determine whether A2 expression has a direct impact on the activation status of affinity-improved CD8 T cells, we generated A2 knock-out primary CD8 T cells with a sequence-specific CRISPR/Cas9 lentiviral construct. A2pos (i.e. CRISPR/mock) and A2neg(i.e. CRISPR/A2) CD8 T cells sharing the same cellular background were then transduced with the affinity-increased TCR panel, expanded non-specifically with PHA/A2neg-feeder cells and characterized for their expression of co-activating/co-inhibitory receptors (Fig. 3 a). From day 8 to 14 following TCR transduction, A2pos CD8 T cells displayed substantially high expression of PD-1, TIM-3 and TIGIT co-inhibitory receptors and of CD25 and 4-1BB activation markers, again contrasting to the reduced CD28 expression, along the TCR affinity range (Fig.3c, Additional file1: Figure S3A). These A2posCD8 T cells also co-expressed multiple inhibitory receptors (Fig.3
d), but still showed enhanced relative proliferation capacity (Additional file1: Figure S3B). Conversely, knock-out of A2 expression completely abolished this phenotypic activation state. These results show that A2 expression per se (in the absence of cognate antigen) is required to induce the sus-tained activation phenotype of tumor-redirected primary CD8 T cells upon affinity-increased TCR transduction.
A CDR3-based TCR variant of improved binding avidity displays phenotypic activation and TCR/CD3
downmodulation
PD-1, TIM-3 and CD69 expression were observed for A2pos primary CD8 T cells engineered with theα95:LYm/A97L TCR variant, with only a trend for the α95:LYm bearing cells (Fig.3f). This phenotypic activation was further asso-ciated to the downmodulation of CD28 (Fig. 3 f) and of TCR/CD3εcomplex, while CD5 expression was enhanced (Fig. 3 g). Together, the CDR3-based TCR variant (α95: LYm/A97L) displayed comparable phenotypic activation and TCR/CD3 downmodulation as seen for TMβ, bearing dual and single point-mutations in CDR2β and CDR3β (A97L), respectively (Additional file1: Table S1).
A2 expression is linked to functional hyporesponsiveness through affinity-increased TCRs
We next investigated whether this step-wise activation to TCR downmodulation could further impact on the
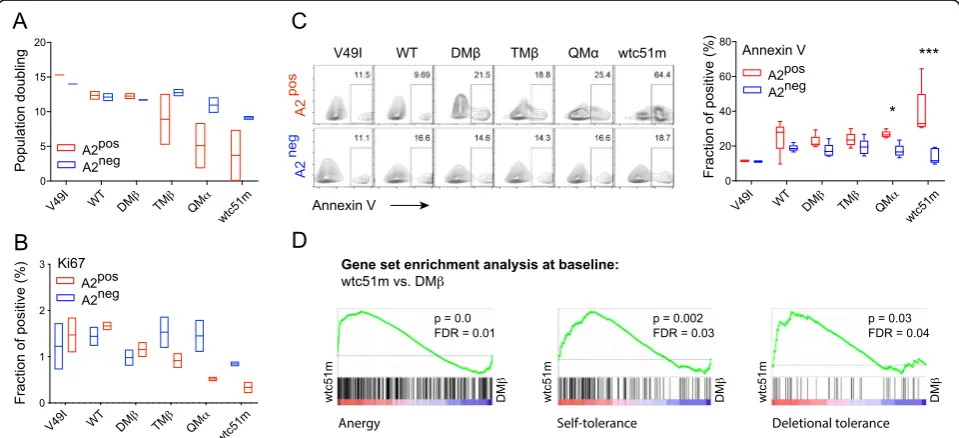
functional capacity of redirected A2posCD8 T cells of in-creased affinity TCRs. Following TCR transduction (> day 15), A2pos (i.e. CRISPR/mock) and A2neg (i.e. CRISPR/A2) primary CD8 T cells were FACS-sorted, non-specifically expanded by PHA/A2negfeeder cells, be-fore being evaluated for cell proliferation capacity and basal apoptotic levels (Fig. 3 b). All A2neg redirected CD8 T cell variants displayed similar population dou-blings, contrasting to the impaired proliferative potential of A2pos T cells along the TCR affinity gradient (Fig. 4
a). This correlated to reduced Ki67pos(Fig. 4b) and in-creased Annexin-Vpos(Fig. 4c) cell fraction. Since PD-1 was rapidly upregulated upon increased-affinity TCR transduction and could account for this T cell hypore-sponsive state, we incubated A2pos redirected T cells with anti-PD-1 mAb (nivolumab) from day −1 of TCR
B
V49I WT DMβ TMβ QMα wtc51mIntensity (gMFI)
Days post TCR transduction A2pos A2neg 5 10 15 20 5 10 15 20 5 10 15 20 5 10 15 20 5 10 15 20 5 10 15 2025
PD-1
TIM-3
2B4
CD69
CD25
CD28
25000 20000 15000 10000 5000 0 20000 15000 10000 5000 0 8000 6000 4000 2000 0 6000
4000
2000
0 4000 3000
1000 0 2000
6000
4000
2000
0
D
PD-1
CD69
panTCR
A2pos A2neg
CD3
ε
Intensity (gMFI)
Days post TCR transduction
5 10 15 20 5 10 15 20 5 10 15 20 5 10 15 20
0 510 15 20
c-CBL
5 10 15 20 6000
4000
2000
0
60000
40000
20000
0
A
CD3/CD28 expansion
Flow analysis
+
+ A2pos
donors
A2neg donors
CD8 T cells
NY-ESO-1 TCR
NY-ESO-1 TCR CD8 T cells
Lentivirus transduction
D6-D21 D0
D-2
C
HLA-A2neg J76 CD8αβ
Flow analysis Haplotype
switch Lentiviral
transduction A2pos
A2neg HLA-A2
control
NY-ESO-1 TCR
Lentiviral transduction
NY-ESO-1 TCR
D3-D21 D0
D-8 D-10
wtc51m QMα
TMβ DMβ WT
V49I
4000 3000
1000 0 2000 8000 6000 4000 0 10000
8000 6000 4000 2000 10000
0
Fig. 2Kinetics of the expression of co-activating/inhibitory surface receptors upon affinity-increased TCR transduction in the absence of cognate peptide antigen.a, cSchematic representations of the phenotype characterization of A2posand A2negJ76 CD8αβcells (a) or A2posand A2neg
primary CD8 T cells from individual healthy donors (c) following affinity-increased TCR transduction, in the absence of antigen-specific stimulation.
b and dKinetic analyses of CD69, PD-1, TCR/CD3εcomplex and c-CBL in redirected J76 CD8αβcells (b) or of co-activating/co-inhibitory receptor expression in redirected primary CD8 T cells (d) from day 3 or 6 up to day 21 after TCR transduction. Data are representative of 2 to 4
C
CD28 0 1 2 3 0.0 0.5 1.0 1.5 2.0 2.5 CD69 PD-1 0 1 2 3*** *** TIM-3
0 1 2 3
*** ** 2B4
0.0 0.5 1.0 1.5 2.0 2.5 0 2 4 6 CD25 *** 0 1 2 3 4
TIGIT ** *
0 1 2 3
4-1BB *** *
Relative intensity (gMFI)
A2pos A2neg
Affinity V49I WT DMβ TMβ QMα
wtc51m V49I
WT DMβ TMβ QMα
wtc51m V49I
WT DMβ TMβ QMα
wtc51m V49I
WT DMβ TMβ QMα wtc51m *
0 1 2 3
D
A2 pos A2 neg AffinityWT DMβ TMβ wtc51m
V49I QMα
no TCR
Number of co-expressed inhibitory receptors (PD-1 / TIM-3 / 2B4)
A2pos A2neg
E
F
0 1 2 3 4Relative Intensity (gMFI) 0 1 2 3 4 α95: LYm α95: LYm + A97L Half live t1/2 (s) 0 100 200 300 400 500 α95:L Ym α95: LYm α95:L Ym + A97L α95:L Ym + A97L
A2 neg
A2 pos
α95:L Ym α95:L Ym α95: LYm + A97L α95:L Ym + A97L 0 0.5 1.0 1.5 2.0 2.5 0.0 0.5 1.0 1.5 40000 60000 80000 100000 1200 1400 1600 1800
α95:LYm α95:L Ym
α95:LYm +
A97L α95:LYm +
A97L α95:L Ym
α95: LYm
α95:LYm +
A97L α95:LYm +
A97L
G
A2 neg
A2 pos
A2 neg
A2 pos A2 pos A2 neg
α95: LYm α95: LYm α95: LYm + A97L α95:
LYm
+ A97L
A2 neg
A2 pos
α95: LYm α95: LYm α95: LYm + A97L α95:L Ym + A97L
A2 neg
A2 pos
PD-1 TIM-3 CD69 CD28 CD3ε CD5
Intensity (gMFI)
A
A2pos donors
CD8 T cells
D-18
CD3/CD28 1st expansion
D-2
A2 sorting 2nd expansion D-16 CRISPR knock-out A2pos A2neg + + mock A2 K-O Cell sorting 3rd expansion Flow analysis Functional analysis D8-D14 NY-ESO-1 TCR NY-ESO-1 TCR Lentivirus transduction D0 D15-D21
B
transduction throughout the whole experimental time-line as indicated in Fig.3a and b. Strikingly, PD-1 block-ade did not prevent the early activation phenotype nor the subsequent reduced proliferative capacity of the high affinity A2pos T cells (Additional file 1: Figure S4). We also performed a gene set enrichment analysis (GSEA) and found that gene sets associated to anergy, self-tolerance and deletional self-tolerance [24–26] were prefer-entially enriched in the high-affinity (i.e. wtc51m) TCR bearing A2pos T cells compared to the wild-type or optimal-affinity (i.e. DMβ) TCR-expressing cells (Fig. 4
d, Additional file1: Figure S5), under steady-state condi-tions (Additional file1: Table S3).
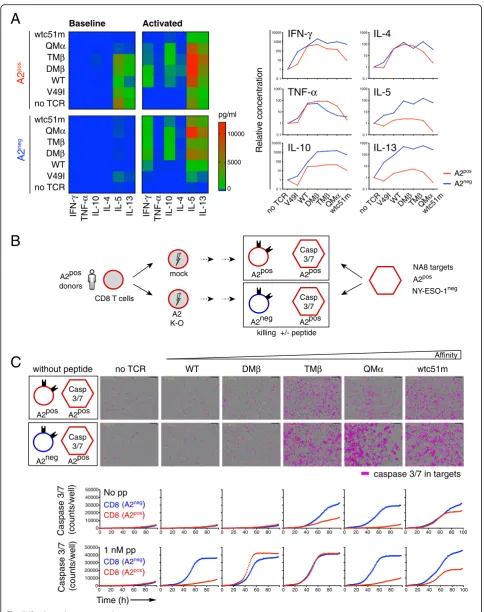
Furthermore, we evaluated the impact of sustained TCR affinity-mediated cell activation on the ability of A2pos versus A2neg tumor-redirected primary CD8 T cells to produce various cytokine mediators by multiplex cytokine profiling. Data showed reduced Th1 and Th2 cytokine production in high-affinity A2pos T cells com-pared to the A2negcells after low dose NY-ESO-1/multi-mer stimulation (Fig.5 a). A similar trend was observed under resting conditions. We further found that A2neg CD8 T cells of high affinity TCRs displayed increased baseline levels of granzyme B and perforin, as well as stronger killing or CD107a degranulation capacity in peptide-pulsed target assays than the corresponding (See figure on previous page.)
Fig. 3Basal expression of co-activating/inhibitory receptors upon affinity-increased TCR transduction in relation to HLA-A2.aSchematic representation of the experimental design using A2-KO CD8 T cells. A2posprimary CD8 T cells were first knocked-out for HLA-A2 by CRISPR/Cas9, expanded by PHA/A2negfeeder cells and transduced with affinity-increased TCRs, before being characterized by flow cytometry (from day 8 to day 14).bFor functional analyses, TCR-redirected A2posand A2negprimary CD8 T cells were further purified by FACS-sorting (between D15–21) and expanded using PHA/A2negfeeder cells.cQuantification of the expression of co-activating/inhibitory receptors on A2pos(CRISPR/GFP) and A2neg(CRISPR/A2) primary CD8 T cells from day 8 to day 14 post-TCR transduction, independently of antigen-specific stimulation. Data are depicted as means ± SD (relative to the WT TCR variant) and representative of 4 to 5 independent experiments. *P≤0.05, **P≤0.01, and ***
P≤0.001.dCo-expression of 0 to 3 co-inhibitory (PD-1, TIM-3 and 2B4) receptors of A2pos(CRISPR/GFP) and A2neg(CRISPR/A2) primary CD8 T cells.eTCR-pMHC off-rate measurements of two CDR3-based TCR variants (α95:LYm andα95:LYm/A97L).fQuantification of PD-1, TIM-3, CD69 and CD28 expression levels in primary CD8 T cells redirected with CDR3-based TCR variants, in the absence of antigen-specific stimulation.g
Expression levels of TCR/CD3 complex and of CD5 in redirected J76 CD8αβcells with CDR3-based TCR variants, analyzed under steady-state culture conditions.e-gData are depicted in comparison to WT (blue dotted line), DMβ(green line) and TMβ(orange line) TCR variants and are representative of 2 to 4 independent experiments
Fig. 4Proliferative capacity, basal apoptotic levels and tolerance-related transcriptional profiles in relation to HLA-A2.aPopulation doublings of A2posand A2negtumor-redirected primary CD8 T cells upon CRISPR/A2-Cas9 strategy were assessed by periodic cell counting of living cells
during 10 days post-TCR sorting in the absence of cognate antigen. Data are representative of 2 independent experiments.b, cQuantification of the fraction of Ki67-positive (b) and Annexin-V-positive cells (c) in A2pos(CRISPR/GFP) and A2neg(CRISPR/A2) primary CD8 T cells under resting
conditions.cRepresentative dot blots (left panel) and Annexin V quantifications (right panel) are depicted. Data are means ± SD of 4 to 5 independent experiments. * P≤0.05 and *** P≤0.001.dGSEA of available gene sets describing anergy [24], self-tolerance [25], and deletional tolerance [26] were found enriched in A2poswtc51m- versus DMβ-expressing primary CD8 T cells under steady-state culture conditions. Nominal
A
Affinity
no TCR WT DMβ TMβ QMα wtc51m
Caspase 3/7 (counts/well)
Time (h) Caspase 3/7 (counts/well)
1 nM pp No pp
(A2neg)
CD8
(A2pos)
CD8
(A2neg)
CD8
(A2pos)
CD8
caspase 3/7 in targets
A2pos Casp
3/7
A2pos
A2neg Casp
3/7
A2pos
C
0 20 40 60 80 0
10000 20000 30000 40000 50000
0 20 40 60 80 0 20 40 60 80 0 20 40 60 80 0 20 40 60 80 0 20 40 60 80 100
0 20 40 60 80 0
10000 20000 30000 40000 50000
0 20 40 60 80 0 20 40 60 80 0 20 40 60 80 0 20 40 60 80 0 20 40 60 80 100 without peptide
B
A2pos donors
CD8 T cells
A2neg mock
A2 K-O
A2pos NA8 targets
A2pos NY-ESO-1neg Casp
3/7
Casp 3/7
killing +/- peptide A2pos
A2pos
IL-4 IL-5
IL-13
IL-10
V49I WT DMβ TMβ QMα wtc51m
no TCR
V49I WT DMβ TMβ QMα wtc51m
no TCR
IFN-γ
TNF-α
A2
pos
A2
neg
Baseline Activated
0.1 1 10 100 1000
0.1 1 10 100 1000
0.1 1 10 100 1000 10000 0.1 1 10 100 1000 10000
0.1 1 10 100 1000
IL-4 IL-5
IL-13
IL-10
IFN-γ
TNF-α
5000 10000
pg/ml
0
IL-4
IL-5
IL-13 IL-10
IFN-γ
TNF-α
0.1 1 10 100 1000
A2pos
A2neg
Relative concentration
V49I WTDMβTMβQMα
wtc51m
no TCR V49I WTDM
β
TMβQM
α
wtc51m
no TCR
A2pos T cells (Additional file 1: Figure S6A-C). Despite these functional changes, the EC50 values defined as the
peptide concentration producing half-maximal response, were for each defined TCR variant similar between A2posand A2negT cells, indicating that the sensitivity of TCR triggering for a given TCR affinity variant was fully preserved (Additional file1: Figure S6D). Finally, we per-formed real-time quantitative killing analyses by incubat-ing A2posor A2neg redirected T cells together with NA8 melanoma cells (NY-ESO-1neg/A2pos) over a 4-day period using IncuCyte technology (Fig. 5 b). This ap-proach also enabled us to address whether chronic TCR-A2 (self)-interactions could lead to qualitative functional adjustments over time. In the absence of cognate anti-gen, NA8/A2pos target killing was observed for both A2posand A2negT cells with increased-affinity TCRs (i.e. TMβ, QMα and wtc51m) (Fig. 5 c). Nonetheless, A2neg T cells always displayed better killing capacity over A2posT cells. The adjunction of low dose of NY-ESO-1 peptide allowed the functional stimulation of all TCR-redirected A2neg T cells, irrespective of TCR affinity, whereas improved A2posT cell-mediated killing only oc-curred for TCR variants with affinities in the upper nat-ural range (DMβ, TMβ). Together, these data indicate that A2pos tumor-redirected primary CD8 T cells of affinity-increased TCRs are characterized by the upregu-lation of tolerance-like gene sets (Additional file1: Table S3) combined to an overall functional impairment (i.e. proliferation, cytokine production and killing capacity) in comparison to A2negT cells. This functional hypore-sponsiveness was retained following low doses of antigen-specific stimulation (Fig.5), in line with our pre-vious observations [9,17].
Short-term TCR-A2 (self)-interactionsin translead to phenotypic and functional T cell activation
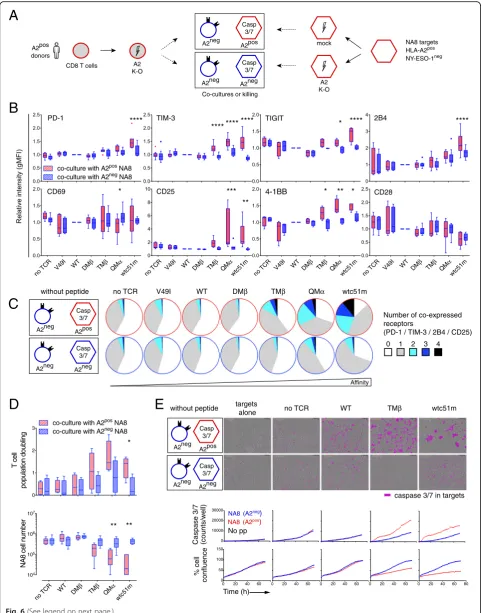
Given the importance of A2 expression on the step-wise activation-to-hyporesponsive state of A2posCD8 T cells, we hypothesized that A2-(self) molecules per se may directly trigger chronic interactions with affinity-increased TCRs. To address this question, we initially performed short-term (72 h) co-cultures of A2negprimary CD8 T cells with either A2pos (CRISPR/mock) or A2neg (CRISPR/A2) NA8 target cells in the absence of cognate antigen (Fig.6a). Multiple
co-activating (CD25, 4-1BB) and co-inhibitory (PD-1, TIM-3, TIGIT and 2B4) receptors were found up-regulated and co-expressed when T cells of affinity-increased TCRs were cultivated in presence of A2posNA8 cells (Fig. 6b and c). Cocultures between A2neg J76 CD8αβ T cells and A2pos NA8 cells led to similar PD-1 and CD69 upregulation (Additional file1: Figure S7). Moreover, this activation state correlated to enhanced proliferation and killing capacity of the T cells when co-cultivated with A2pos but not A2neg NA8 cells (Fig. 6 d and e). Along the same lines, mixing A2pos (CRISPR/mock) and A2neg (CRISPR/A2) primary CD8 T cells together resulted in the progressive disappear-ance over time of A2posT cells, inversely associated to the enrichment of A2negNY-ESO-1-specific T cells, in high af-finity TCR variants (Additional file1: Figure S8). These data demonstrate that short-term TCR-A2 (self)-interactionsin
trans can induce the phenotypic and functional activation
of A2negCD8 redirected T cells of affinity-increased TCRs (i.e. from TMβonwards), in the absence of cognate antigen.
Long-term TCR-A2 (self)-interactionsin transdrive a functional hyporesponsive state
To investigate whether chronic TCR-A2 (self)-interactions could lead to the previously observed hyporesponsive state (Figs. 4 and 5), we performed extended co-cultures be-tween A2neg primary CD8 T cells and either A2pos or A2negNA8 cells, by passing the T cells over fresh layers of tumor cells every 3–4 days (Fig.7a). All co-cultures were again carried out in the absence of antigen-specific stimu-lation. Kinetic analyses showed that following the rapid and initial upregulation of co-activating and co-inhibitory receptors on CD8 T cells redirected with high affinity TCRs, there was a progressive decline in their expression thereafter (Fig. 7 b). This effect was only found in co-cultures with A2pos NA8 cells. Cell proliferation was no longer noticed for increased-affinity T cells after day 12 of co-culture with A2pos NA8 cells (data not shown). We also examined the killing capacity of these long-term cul-tured A2neg CD8 T cells against A2pos NA8 target cells using the IncuCyte design (Fig. 7 c). The high affinity T cell variant (wtc51m), cocultured during extended periods of time with A2neg NA8 cells, retained superior killing capacity over WT or TMβT cell variants. This was not the case when the same wtc51m A2neg T cells were (See figure on previous page.)
Fig. 5Basal cytokine production and killing capacity in relation to HLA-A2.aMultiplex cytokine production data was performed on A2posand A2negprimary CD8 T cells without (baseline) or with low dose of 0.1 nM A2/NY-ESO-1157-165multimers (activated) during 24-h of culture. Cytokine
concentrations are shown as heat map (left panel) or as relative concentrations to no-TCR variants after specific stimulation (right panel).b
Schematic representation of the real-time quantitative killing assay by IncuCyte. A2pos(CRISPR/GFP) and A2neg(CRISPR/A2) primary CD8 T cells of affinity-increased TCRs were co-cultured with NA8 (A2pos/NY-ESO-1neg) target tumor cells (E:T ratio; 1:10), without or with low dose of 1 nM NY-ESO-1157-165peptide (pp) during 4 days.cRepresentative images at 96 h (upper panels) and quantification (lower panels) of caspase
B
CD28
PD-1 TIM-3 2B4
CD69 CD25
TIGIT
4-1BB
V49I WT DMβ TMβ QM
α
wtc51m
no TCR V49I WT DM
β
TMβ QM
α
wtc51m
no TCR V49I WT DM
β
TMβ QM
α
wtc51m
no TCR V49I WT DM
β
TMβ QM
α
wtc51m no TCR
**** ********
**** * **** ****
*** **
* * ** *
C
co-culture with A2neg NA8
co-culture with A2pos NA8
D
T cell
population doubling
NA8 cell number
0 1 2 3
104 105 106 107
no TCR
WT DMβ TMβ QMα wtc51m
** ** *
co-culture with A2neg NA8 co-culture with A2pos NA8
Caspase 3/7 (counts/well)
% cell
confluence
0 10000 20000 30000
0 20 40 60 0
50 100 150
0 20 40 60 0 20 40 60 0 20 40 60 0 20 40 60 80
(A2neg)
NA8 (A2pos) NA8
Time (h)
caspase 3/7 in targets
A2neg Casp
3/7
A2pos
A2neg Casp
3/7
A2neg
E
targets no TCR WT TMβ wtc51malone
No pp without peptide
A2pos donors
CD8 T cells
A2neg
A2neg NA8 targets
HLA-A2pos NY-ESO-1neg A2
K-O
A2 K-O mock Casp
3/7
Casp 3/7
A2neg A2pos
A
Co-cultures or killing
A2neg
Casp 3/7
A2pos
A2neg
Casp 3/7
A2neg
WT DMβ TMβ wtc51m
V49I QMα
no TCR
Affinity
0 1 2 3 4 Number of co-expressed receptors
(PD-1 / TIM-3 / 2B4 / CD25) without peptide
(See figure on previous page.)
Fig. 6Activation phenotype and basal killing capacity of tumor-redirected A2negCD8 T cells in short-term co-cultures with NA8 target cells.a
Schematic representation of the experimental design; A2neg(CRISPR/A2) primary CD8 T cells of increased-affinity TCRs were co-cultured with A2posor A2neg(CRISPR/A2) NA8 tumor cells for 3 days in the absence of cognate antigen.bExpression levels of co-activating/inhibitory receptors on A2negCD8 T cells after 3 days of co-culture with either A2posor A2negNA8 cells.cCo-expression of 0 to 4 co-inhibitory (PD-1, TIM-3 and 2B4) and co-activating (CD25) receptors.dQuantification of T cell population doublings (upper panel) and of NA8 cell numbers (lower panel) after 3 days of co-culture with A2posor A2negNA8 cells.eRepresentative images at 70 h (upper panel) and quantification (lower panel) of caspase 3/7-dependent apoptosis induced by tumor-redirected A2negCD8 T cells co-cultivated during 3 days with A2posor A2negNA8 cells are depicted, using IncuCyte technology. Data are expressed as means ± SD and are representative of 4 to 8 (bandc), 4 to 6 (d) and 2 (e) independent experiments. * P≤0.05, ** P≤0.01, *** P≤0.001 and ****P≤0.0001
C
A2neg Casp
3/7
A2pos
A2neg Casp
3/7
A2pos
no TCR WT TMβ wtc51m
caspase 3/7 in targets
0.1nM pp no pp
Time (h)
Time (h) Caspase 3/7 (counts/well)
% cell
confluence
Caspase 3/7 (counts/well)
% cell
confluence
without peptide
V49I WT DMβ TMβ QMα wtc51m
PD-1 TIM-3 2B4 CD25
Time (days)
B
co-culture with A2neg NA8 co-culture with A2pos NA8
A
A2pos donors
CD8 T cells
A2neg A2neg
A2 K-O
A2neg A2pos
A2neg A2neg
Casp 3/7
Casp 3/7
A2pos A2pos
killing +/- peptide A2neg
A2neg
T cell sorting co-culture
renewed targets
D0 - D21 D21 D21-25
Fig. 7Activation phenotype and basal killing capacity of tumor-redirected A2negCD8 T cells in long-term co-cultures with NA8 tumor cells.a
Schematic representation of the experimental design; A2neg(CRISPR/A2) primary CD8 T cells were co-cultured with either A2posor A2negNA8
tumor cells for 20 days in the absence of cognate antigen before being sorted and tested for their killing capacity.bKinetics of the expression levels of co-activating/inhibitory receptors on A2negCD8 T cells during long-term co-cocultures with A2posor A2negNA8 cells.cRepresentative
images at 94 h (upper panel) and quantification (lower panel) of caspase 3/7-dependent apoptosis of NA8postarget cells induced by A2negCD8 T
previously co-cultivated with A2pos NA8 cells over time, as this co-culture combination led to impaired T cell kill-ing capacity (Fig.7c). Collectively, the long-term exposure to A2 expressionin transrecapitulates at the killing level, the observed hyporesponsive state found in A2posT cells upon high affinity TCR transduction. These results further indicate that chronic TCR-A2 (self)-interactions can trig-ger sustained T cell activation, driving to the functional hyporesponsiveness in CD8 T cells engineered with affinity-increased TCRs.
Discussion
TCR-ligand interactions influence many aspects of T cell biology. Stronger interactions usually confer superior T cell activation and responsiveness than weaker ones [27–30]. However, recent advances describe that negative feedback mechanisms may limit effector function according to TCR affinity/avidity [9,11–13]. Here, we addressed the question whether increasing the TCR affinity can directly trigger the chronic TCR recognition of A2-(self) molecules (i.e. TCR-MHC (self)-interactions) and modulate the overall func-tional potency of tumor-redirected CD8 T cells. Using two complementary tumor-redirected CD8 T cell models, we first showed that the de novo expression of A2 molecules in TCR-engineered Jurkat J76 CD8αβ T cells led to TCR/ CD3 downregulation and impaired TCR signaling in a TCR affinity-dependent manner (Fig.1). This was inversely cor-related to enhanced expression of the negative TCR tuning molecules, CD5 and c-CBL (Fig.1). We further found that strong T cell activation always preceded global T cell hypo-responsiveness in tumor-redirected primary CD8 T cells of increasing affinity TCRs (Fig.2-5). This was again dependent on the recognition of A2 molecules and was already ob-served for TCR variants engineered with affinities lying at the upper limit of the physiological range. Finally, the step-wise activation-to-hypofunctional state could be recapitu-latedin transin A2negprimary CD8 T cells of high affinity TCRs when co-cultured with A2pos-presenting NA8 cells (Figs.6and7). Together, our data indicate that chronic in-teractions between affinity-increased TCRs and self-A2 mol-ecules can directly tune the functional potential of CD8 T cells, even in the absence of antigen-specific stimulation. This TCR affinity-mediated hyporesponsive state is novel and has implications for the design of affinity-improved TCRs for immunotherapy.
Our findings are in agreements with recent studies reporting that chronic activation arising independently of antigenic stimulation can drive a hyporesponsive func-tional state in primary T cells [31,32]. Namely, enhancing basal TCR signaling with a Zap-70 gain-of-function muta-tion was associated with marked increase in PD-1 expres-sion and T cell unresponsiveness, a state sharing features to T cell anergy [31]. Moreover, tonic CD3ζ phosphoryl-ation triggered through the clustering of chimeric antigen
receptors (CARs) predisposes the CAR-T cells to early ex-haustion and limits their in vivo efficacy against tumors [32]. Here, we describe that TCR-A2 (self)-interactions oc-curring with affinity-increased TCRs provided sustained activation stimuli to transduced CD8 T cells, resulting in subsequent impaired functional performance. These high affinity T cells also shared several features commonly seen in other hyporesponsive T cell states such as exhaustion [33]. For instance, they co-expressed several inhibitory re-ceptors, before displaying gene sets related to self-tolerance and showing reduced ability to proliferate and to produce cytokines (Figs.3 4and5). These observations offer new evidence that chronic T cell activation engaged negative feedback regulations by which inhibitory recep-tors and TCR/CD3 downmodulation likely restrain TCR signaling and function, to provide potential protective mechanisms against TCR-MHC self-reactivity.
One possible explanation for the chronic interactions occurring between affinity-increased TCRs and A2 (self)-molecules might stem from the TCR affinity-optimization process used to generate our NY-ESO-1-specific TCR panel [18], including the nanomolar affinity TCR wtc51m variant, designed by phage-display screening [34]. Gain in TCR affinity above the physiological range (KD≤1μM)
within the CDR3α/βloops (Fig. 3). These observations are suggestive of the presence of TCR affinity-related activation thresholds. At present, additional studies are still needed to fully appreciate the respective consequences of CDR3α/β -based mutations compared to those involving the CDR2α/β ones, on the overall TCR interactions to HLA-A2, the func-tional efficacy and the potential off-target recognition of these tumor-redirected CD8 T cells.
The impact of chronic TCR-A2 (self)-interactions on tumor-redirected A2pos CD8 T cells upon TCR trans-duction of increased affinities led to the co-expression of multiple inhibitory receptors such as PD-1, TIM-3, TIGIT and 2B4, that preceded T cell hyporesponsiveness (Fig. 3). This is reminiscent of the recently developed concept that many inhibitory receptors including PD-1 represent markers of T cell activation [38]. Notably, PD-1 levels have been related to the strength of TCR signal-ing and thus to the functional avidity of tumor-specific T cells to compensate for T cell activation [39]. Another finding was that early PD-1 inhibition by nivolumab did not reverse the stepwise activation to hypofunctional state of our TCR affinity-optimized A2pos CD8 T cells (Additional file1: Figure S4). These observations suggest that the hyporesponsive state of increased affinity CD8 T cells may involve the combination of several distinct negative regulatory pathways. In support to this, we found that basal TCR/CD3ε downmodulation inversely correlated to increased expression of the tuning mole-cules CD5 and c-CBL [20], and resulted into additional impaired TCR signaling (Figs. 1 and 2). Intriguingly, early PD-1 blockade did not recapitulate the results ob-tained upon PD-L1 blockade in long-term cultured hy-poresponsive A2pos T cells of highest affinity TCRs and showing functional recovering [9]. One possible explan-ation is that as PD-1 expression is finely regulated by genetic and epigenetic dynamic mechanisms [40], the stage at which CD8 T cells can get reinvigorated upon PD-1 blockade may matter. In that regard, late cultures of CD8 T cells may be more sensitive to the inhibition of the PD-1/PD-L1 axis than early expanded T cells upon TCR transduction. Alternatively, blocking PD-1 directly (as shown here) may not necessarily lead to the same biological effects than PD-L1 inhibition [9], since PD-1 and PD-L1 may be differently expressed on given T cell subpopulations and their expression may further differ over time after activation [41].
One major safety concern when using affinity-enhanced TCRs for adoptive T cell therapy, is that can-didate TCRs may target normal tissues as a consequence of off-target recognition [1]. Our study further empha-sizes the possible impact of TCR-MHC (self)-interac-tions in relation to membrane receptor expression, cell activation, signaling and function of redirected CD8 T cells. The development of various safeguard strategies as
for example the use of more complex cell cultures [6], is therefore becoming mandatory in preclinical studies to provide a better evaluation of these potential adverse risks. In that regard, Inderberg and colleagues recently tested the effect of overexpressing the negative regulator c-SRC kinase in redirected T cells and showed that while the T cells retained target recognition and binding, they were incapable of executing their effector functions [42]. They propose to use these “dummy” T cells for in vivo safety validation of new therapeutic TCRs prior their clinical use [42]. Here, we show that the J76 cell line, de-void of endogenous TCRαβ chains and expressing CD8αβ coreceptor represents another useful model to appraise the impact of increased-affinity TCRs and MHC expression on TCR/CD3 complex activation and signaling capacity (Fig. 1). TCR-redirected primary CD8 T cells expressing A2 (CRISPR/GFP) or not (CRISPR/ A2) are also highly indicative of how given affinity-increased TCRs do recognize and kill target cells in the absence of cognate antigen (Fig. 5). Notably, the use of primary CD8 T cell lacking A2 expression provided a complementary evaluation of the potential TCR-MHC (self)-interactions occurring in relation to TCR affinity. The IncuCyte technology further offers a strong bio-logical and relevant culture system as it allows assessing the long-term functional impact of affinity-engineered TCRs on target cells at the qualitative level. Investiga-tions based on animal models still remain necessary, as these cannot be fully replaced by in vitro studies, espe-cially in validating the in vivo capacity of engineered T cells. Yet, mouse models may not always be suitable for predicting off-target toxicities, as demonstrated in the preclinical investigations performed on the affinity-enhanced MAGE-A3/HLA-A1 TCR that caused fatal toxicity against cardiac tissues [6].
Conclusions
HLA-class I expression to generate universal T cells from allogeneic donors [45]. Together, this study further underlines the need to wisely assess TCR affinity-increased candidates for ensuring optimal and harmless TCR design for adoptive T cell-based therapies.
Supplementary information
Supplementary informationaccompanies this paper athttps://doi.org/10. 1186/s40425-019-0773-z.
Additional file 1.Table S1.Characteristics of affinity-increased HLA-A2/ NY-ESO-1-specific TCRs.Table S2.List of antibodies 93 used in the study.
Table S3.List of gene 95 sets used for GSEA.Figure S1.Characterization and baseline expression of TCR/CD3 complex in de novo HLA-A2-expressing Jurkat J76 CD8αβT cells.Figure S2.Phosphorylation levels of CD3ζand ERK upon stimulation and basal expression levels of surface receptors in A2pos and A2neg J76 CD8αβT cells.Figure S3.Basal expression levels of co-activating/inhibitory receptors on A2pos and A2neg primary CD8 T cells upon affinity-increased TCR transduction.
Figure S4.Surface staining and population doublings of primary 130 A2pos CD8 T cells with or without PD-1 blocking antibody.Figure S5.
Gene Set Enrichment Analysis (GSEA) of high-affinity versus optimal TCR variants.Figure S6.CD107a degranulation and killing capacity of A2pos and A2neg primary CD8 T cells expressing affinity-increased TCRs.Figure S7.Expression levels of PD-1 and CD69 in A2neg J76 CD8αβcells during 14 days of co-culture with NA8 tumor cells.Figure S8.Dynamics of A2pos versus A2neg redirected primary CD8 T cell sub-populations in co-cultures following TCR transduction.
Abbreviations
A2:HLA-A*0201; MAPK: Mitogen-activated protein kinases; PD-1: programmed cell death-1; PD-LPD-1: PD-1 ligand 1; pMHC: peptide-Major Histocompatibility Complex; PTPN6/SHP-1: Protein tyrosine phosphatase non receptor type 6; TCR: T cell receptor
Acknowledgements
We thank Lukas Baitsch, Petra Baumgaertner, Laura Carretero-Iglesia, Barbara Couturaud, Connie Gilfillan, Julien Schmidt and Daniel Speiser for their help, comments and critical reading of the manuscript. We are also grateful to Ni-cole Montandon and Natasa Jovanovic for excellent technical and secretarial help and to Anne Wilson and the flow cytometry facility of Lausanne for op-erational support.
Author’s contributions
MND, MH and NR designed the study. MND, EE, and MH performed the experiments. MND, EE, MH and NR analyzed and interpreted the results. MND, MH and NR wrote the manuscript. All authors read, corrected and approved the final manuscript.
Funding
This study was sponsored and supported by the Department of Oncology (University of Lausanne), the ISREC Foundation (Switzerland), and the Swiss National Science Foundation (310030–159417, 310030–179280).
Availability of data and materials
The datasets used and/or analyzed during the current study are available from the corresponding authors.
Ethics approval and consent to participate
Human peripheral blood cells were obtained from healthy donors of the Interregional Blood Transfusion SRC Ltd. All blood donors had previously completed the Swiss National Medical questionnaire to verify that they fulfilled the criteria for blood donation and provided written informed consent for the use of blood samples in medical research after anonymization.
Consent for publication
Not applicable.
Competing interests
The authors declare that they have no competing interests.
Received: 19 July 2019 Accepted: 5 October 2019
References
1. Johnson LA, June CH. Driving gene-engineered T cell immunotherapy of cancer. Cell Res. 2017;27(1):38–58.
2. Robbins PF, Morgan RA, Feldman SA, Yang JC, Sherry RM, Dudley ME, et al. Tumor regression in patients with metastatic synovial cell sarcoma and melanoma using genetically engineered lymphocytes reactive with NY-ESO-1. J Clin Oncol. 2011;29(7):917–24.
3. Robbins PF, Kassim SH, Tran TL, Crystal JS, Morgan RA, Feldman SA, et al. A pilot trial using lymphocytes genetically engineered with an NY-ESO-1-reactive T-cell receptor: long-term follow-up and correlates with response. Clin Cancer Res. 2015;21(5):1019–27.
4. Rapoport AP, Stadtmauer EA, Binder-Scholl GK, Goloubeva O, Vogl DT, Lacey SF, et al. NY-ESO-1-specific TCR-engineered T cells mediate sustained antigen-specific antitumor effects in myeloma. Nat Med. 2015;21(8):914–21. 5. Linette GP, Stadtmauer EA, Maus MV, Rapoport AP, Levine BL, Emery L, et al.
Cardiovascular toxicity and titin cross-reactivity of affinity-enhanced T cells in myeloma and melanoma. Blood. 2013;122(6):863–71.
6. Cameron BJ, Gerry AB, Dukes J, Harper JV, Kannan V, Bianchi FC, et al. Identification of a Titin-derived HLA-A1-presented peptide as a cross-reactive target for engineered MAGE A3-directed T cells. Sci Transl Med. 2013;5(197):197ra03.
7. Hebeisen M, Allard M, Gannon PO, Schmidt J, Speiser DE, Rufer N. Identifying individual T cell receptors of optimal avidity for tumor antigens. Front Immunol. 2015;6:582.
8. Kalergis AM, Boucheron N, Doucey MA, Palmieri E, Goyarts EC, Vegh Z, et al. Efficient T cell activation requires an optimal dwell-time of interaction between the TCR and the pMHC complex. Nat Immunol. 2001;2(3):229–34. 9. Hebeisen M, Baitsch L, Presotto D, Baumgaertner P, Romero P, Michielin O,
et al. SHP-1 phosphatase activity counteracts increased T cell receptor affinity. J Clin Invest. 2013;123(3):1044–56.
10. Hogquist KA, Jameson SC. The self-obsession of T cells: how TCR signaling thresholds affect fate 'decisions' and effector function. Nat Immunol. 2014; 15(9):815–23.
11. Engels B, Chervin AS, Sant AJ, Kranz DM, Schreiber H. Long-term persistence of CD4(+) but rapid disappearance of CD8(+) T cells expressing an MHC class I-restricted TCR of nanomolar affinity. Mol Ther. 2012;20(3):652–60. 12. Smith TR, Verdeil G, Marquardt K, Sherman LA. Contribution of TCR signaling
strength to CD8+ T cell peripheral tolerance mechanisms. J Immunol. 2014. 13. Gallegos AM, Xiong H, Leiner IM, Susac B, Glickman MS, Pamer EG, et al.
Control of T cell antigen reactivity via programmed TCR downregulation. Nat Immunol. 2016;17(4):379–86.
14. Presotto D, Erdes E, Duong MN, Allard M, Regamey PO, Quadroni M, et al. Fine-tuning of optimal TCR signaling in tumor-redirected CD8 T cells by distinct TCR affinity-mediated mechanisms. Front Immunol. 2017;8:1564. 15. Chlewicki LK, Holler PD, Monti BC, Clutter MR, Kranz DM. High-affinity,
peptide-specific T cell receptors can be generated by mutations in CDR1, CDR2 or CDR3. J Mol Biol. 2005;346(1):223–39.
16. Robbins PF, Li YF, El-Gamil M, Zhao Y, Wargo JA, Zheng Z, et al. Single and dual amino acid substitutions in TCR CDRs can enhance antigen-specific T cell functions. J Immunol. 2008;180(9):6116–31.
17. Irving M, Zoete V, Hebeisen M, Schmid D, Baumgartner P, Guillaume P, et al. Interplay between T cell receptor binding kinetics and the level of cognate peptide presented by major histocompatibility complexes governs CD8+ T cell responsiveness. J Biol Chem. 2012;287(27):23068–78.
18. Zoete V, Irving M, Ferber M, Cuendet MA, Michielin O. Structure-based, Rational Design of T Cell Receptors. Front Immunol. 2013;4:268. 19. Wang HY, Altman Y, Fang D, Elly C, Dai Y, Shao Y, et al. Cbl promotes
ubiquitination of the T cell receptor zeta through an adaptor function of Zap-70. J Biol Chem. 2001;276(28):26004–11.
20. Voisinne G, Garcia-Blesa A, Chaoui K, Fiore F, Bergot E, Girard L, et al. Co-recruitment analysis of the CBL and CBLB signalosomes in primary T cells identifies CD5 as a key regulator of TCR-induced ubiquitylation. Mol Syst Biol. 2016;12(7):876.
22. Valitutti S, Muller S, Salio M, Lanzavecchia A. Degradation of T cell receptor (TCR)-CD3-zeta complexes after antigenic stimulation. J Exp Med. 1997;185(10):1859–64. 23. Hebeisen M, Schmidt J, Guillaume P, Baumgaertner P, Speiser DE, Luescher
I, et al. Identification of rare high-avidity, tumor-reactive CD8+ T cells by monomeric TCR-ligand off-rates measurements on living cells. Cancer Res. 2015;75(10):1983–91.
24. Okamura T, Fujio K, Shibuya M, Sumitomo S, Shoda H, Sakaguchi S, et al. CD4+CD25-LAG3+ regulatory T cells controlled by the transcription factor Egr-2. Proc Natl Acad Sci U S A. 2009;106(33):13974–9.
25. Schietinger A, Delrow JJ, Basom RS, Blattman JN, Greenberg PD. Rescued tolerant CD8 T cells are preprogrammed to reestablish the tolerant state. Science. 2012;335(6069):723–7.
26. Parish IA, Rao S, Smyth GK, Juelich T, Denyer GS, Davey GM, et al. The molecular signature of CD8+ T cells undergoing deletional tolerance. Blood. 2009;113(19):4575–85.
27. Allard M, Couturaud B, Carretero-Iglesia L, Duong MN, Schmidt J, Monnot GC, et al. TCR-ligand dissociation rate is a robust and stable biomarker of CD8+ T cell potency. JCI Insight. 2017;2(14):e92570.
28. Alexander-Miller MA, Leggatt GR, Berzofsky JA. Selective expansion of high-or low-avidity cytotoxic T lymphocytes and efficacy fhigh-or adoptive immunotherapy. Proc Natl Acad Sci U S A. 1996;93(9):4102–7.
29. Zeh HJ 3rd, Perry-Lalley D, Dudley ME, Rosenberg SA, Yang JC. High avidity CTLs for two self-antigens demonstrate superior in vitro and in vivo antitumor efficacy. J Immunol. 1999;162(2):989–94.
30. Almeida JR, Price DA, Papagno L, Arkoub ZA, Sauce D, Bornstein E, et al. Superior control of HIV-1 replication by CD8+ T cells is reflected by their avidity, polyfunctionality, and clonal turnover. J Exp Med. 2007;204(10):2473–85. 31. Hsu LY, Cheng DA, Chen Y, Liang HE, Weiss A. Destabilizing the
autoinhibitory conformation of Zap70 induces up-regulation of inhibitory receptors and T cell unresponsiveness. J Exp Med. 2017;214(3):833–49. 32. Long AH, Haso WM, Shern JF, Wanhainen KM, Murgai M, Ingaramo M, et al.
4-1BB costimulation ameliorates T cell exhaustion induced by tonic signaling of chimeric antigen receptors. Nat Med. 2015;21(6):581–90. 33. Wherry EJ, Kurachi M. Molecular and cellular insights into T cell exhaustion.
Nat Rev Immunol. 2015;15(8):486–99.
34. Dunn SM, Rizkallah PJ, Baston E, Mahon T, Cameron B, Moysey R, et al. Directed evolution of human T cell receptor CDR2 residues by phage display dramatically enhances affinity for cognate peptide-MHC without increasing apparent cross-reactivity. Protein Sci. 2006;15(4):710–21. 35. van der Merwe PA, Davis SJ. Molecular interactions mediating T cell antigen
recognition. Annu Rev Immunol. 2003;21:659–84.
36. van der Merwe PA, Dushek O. Mechanisms for T cell receptor triggering. Nat Rev Immunol. 2011;11(1):47–55.
37. Slansky JE, Jordan KR. The Goldilocks model for TCR-too much attraction might not be best for vaccine design. PLoS Biol. 2010;8(9):e1000482. 38. Legat A, Speiser DE, Pircher H, Zehn D, Fuertes Marraco SA. Inhibitory receptor
expression depends more dominantly on differentiation and activation than "exhaustion" of human CD8 T cells. Front Immunol. 2013;4:455.
39. Simon S, Labarriere N. PD-1 expression on tumor-specific T cells: friend or foe for immunotherapy? Oncoimmunology. 2017;7(1):e1364828. 40. Pauken KE, Wherry EJ. Overcoming T cell exhaustion in infection and
cancer. Trends Immunol. 2015;36(4):265–76.
41. Xu-Monette ZY, Zhang M, Li J, Young KH. PD-1/PD-L1 blockade: have we found the key to unleash the antitumor immune response? Front Immunol. 2017;8:1597.
42. Inderberg EM, Mensali N, Oksvold MP, Fallang LE, Fane A, Skorstad G, et al. Human c-SRC kinase (CSK) overexpression makes T cells dummy. Cancer Immunol Immunother. 2018;67(4):525–36.
43. Sandberg JK, Karre K, Glas R. Recognition of the major histocompatibility complex restriction element modulates CD8(+) T cell specificity and compensates for loss of T cell receptor contacts with the specific peptide. J Exp Med. 1999;189(6):883–94.
44. Holler PD, Chlewicki LK, Kranz DM. TCRs with high affinity for foreign pMHC show self-reactivity. Nat Immunol. 2003;4(1):55–62.
45. Torikai H, Reik A, Soldner F, Warren EH, Yuen C, Zhou Y, et al. Toward eliminating HLA class I expression to generate universal cells from allogeneic donors. Blood. 2013;122(8):1341–9.
Publisher’s Note