Publisher: Asian Economic and Social Society
The Use Of Receiver Operating Characteristic (Roc) Analysis In The Evaluation Of The Performance Of Two Binary Diagnostic Tests Of Gestational Diabetes Mellitus.
Okeh UM (Department of Industrial mathematics and Applied Statistics, Ebonyi State University, Abakaliki Nigeria)
Ogah IE (Ebonyi State University Teaching Hospital Abakaliki (EBSUTHAI),Nigeria)
Okeh US (Department of Medical Laboratory Sciences, Ebonyi State University Abakaliki, Nigeria)
Agwu A (Federal Medical Centre, Abakaliki, Nigeria)
35 Introduction
Gestational diabetes mellitus (GDM) is estimated to occur in 2–9% of all pregnancies (Crowther et al,2005;Esakoff et al,2005;Jensen et al,2003;Sivan et al,2001;Tuffnell et al,2003). It is defined as carbohydrate intolerance with onset or first recognition during pregnancy and is associated with increased rates of adverse pregnancy outcomes, such as macrosomia; shoulder dystocia; birth-related trauma, such as fractures and nerve palsies; neonatal hypoglycemia; and jaundice. In addition, women with GDM are at substantially higher risk to develop diabetes in later life (Crowther et al, 2005; Brody et al,2003;Langer et al,2005;Naylor et al,1997). Results from a randomized controlled trial show that treatment of GDM by means of dietary advice, blood glucose monitoring, and insulin therapy, if required, reduces the rate of serious perinatal complications without increasing the rate of caesarean delivery (Crowther et al, 2005). Based on these results, identification through screening and subsequent treatment of women with GDM appears beneficial. However, consensus on the optimal policy for screening is lacking. The American Diabetes Association recommends screening based on risk factors for GDM (age >25 years, obese, close relative with diabetes, history of
GDM or a previous macrosomic infant, or specific ethnicity) followed by the 50-g 1-h oral glucose challenge test as a screening test (Poyhonen-Alho et al,2005;Santos-Ayarzagoitia et al,2006;ADA,2003). Other methods of screening that are regularly used are (repeated) random glucose testing and fasting glucose measurement. It is indefinite which test is the most accurate in testing women for GDM. The diversity in screening methods may result in unidentified cases of GDM and preventable neonatal and maternal morbidity. Establishment of an optimal, evidence-based screening policy to detect and treat GDM in a timely fashion could contribute to a reduction of perinatal complications. Two regularly used screening tests in the Ebonyi State health system are the random glucose test and the 50-g glucose challenge test. The objective of the present study was to compare these two tests as screening tests for GDM as a first step in determining optimal screening policy in GDM.
Receiver Operating Characteristic Curve
ROC (Receiver Operating Characteristic) analysis is being used as a method for evaluation and comparison of classifiers ( Ferri et al, 2002). The ROC gives complete description of classification accuracy as given by the area under the ROC curve. The ROC curve originates from signal detection theory (Hosmer The Use Of Receiver Operating Characteristic (Roc) Analysis In The Evaluation Of The Performance Of Two Binary Diagnostic Tests Of Gestational Diabetes Mellitus.
Abstract
Author (s)
Okeh UM
Department of Industrial mathematics and Applied Statistics, Ebonyi State University, Abakaliki Nigeria. E-mail:[email protected]
Ogah IE
Ebonyi State University Teaching Hospital Abakaliki ,Nigeria.
Okeh US
Department of Medical Laboratory Sciences, Ebonyi State University Abakaliki, Nigeria.
Agwu A
Federal Medical Centre, Abakaliki, Nigeria.
Key words: random glucose test, 50-g glucose challenge test, 75-g oral glucose tolerance test, ROC curve.
36 and Lemeshow, 2000); the curve shows how the
receiver operates the existence of signal in the presence of noise. The ROC curve plots the probability of detecting true signal (sensitivity) and false signal (1 – specificity) for an entire range of possible cut points. The sensitivity and specificity of a classifier also depend on the definition of the cut-off point for the probability of predicted classes. A ROC curve demonstrates the trade-off between true positive rate and false positive rate in binary classification problems. To draw a ROC curve, the true positive rate (TPR) and the false positive rate (FPR) are needed. TPR determines the performance of a classifier or a diagnostic test in classifying positive cases correctly among all positive samples available during the test. FPR, on the other hand, defines how many incorrect positive results, which are actually negative, there are among all negative samples available during the test. Because TPR is equivalent to sensitivity and FPR is equal to (1 –specificity), the ROC graph is sometimes called the sensitivity vs. (1 - specificity) plot. The area under the ROC curve has become a particularly important measure for evaluating classifiers’ performance because it is the average sensitivity over all possible specificities (Bradley 1997). The larger the area, the better the classifier performs. If the area is 1.0, the classifier achieves both 100% sensitivity and 100% specificity. If the area is 0.5, then we have 50% sensitivity and 50% specificity, which is no better than flipping a coin. This single criterion can be compared for measuring the performance of different classifiers analyzing a dataset. (Hanley,1982; Bamber,1975). After a classifier has been made, it is also useful to measure its calibration. Calibration evaluates the degree of correspondence between the estimated probabilities of a specific outcome resulting from a classifier and the outcomes predicted by domain experts. This can then be tested using goodness-of-fit statistics. This test examines the difference between the observed frequency and the expected frequency for groups of patients and can be used to determine if the classifier provides a good fit for the data. If the p-value is large, then the classifier is well calibrated and fits the data well. If the p-value is small, then the classifier is not well calibrated. There is a pair of diagnostic sensitivity and specificity values for every individual cut-off. To construct a ROC graph, we plot these pairs of values on the graph with the 1-specificity on the x-axis and sensitivity on the y-axis. Receiver operating characteristic curve analysis is often used to help determine the cut-off point to optimize sensitivity and specificity. An ROC curve is a graphical representation of the tradeoff between the false negative and false positive rates for every possible cut-off value (Zweig and Campbell, 1993).Alternatively, the ROC curve is the
37 test characteristic, the other gets worse and vice versa.
For example, when improving sensitivity, specificity decreases and when improving specificity, sensitivity decreases. The area under the ROC curve can also be used statistically to compare the discriminating ability between two diagnostic tests (Zweig and Campbell,1993).We can say that the relationship between the area under the ROC curve(AUC) and diagnostic accuracy can be seen in the table-1
AUC is a global measure of diagnostic accuracy. It tells us nothing about individual parameters, such as sensitivity and specificity. Out of two tests with identical or similar AUC, one can have significantly higher sensitivity, whereas the other significantly higher specificity. Furthermore, data on AUC state nothing about predicative vales and about the contribution of the test in ruling-in and ruling-out a diagnosis. Global measures are there for general assessment and for comparison of two or more diagnostic tests. By the comparison of areas under the two ROC curves we can estimate which one of two tests is more suitable for distinguishing health from disease or any other two conditions of interest. It should be pointed out that this comparison should not be based on visual nor intuitive evaluation (Obuchowski et al, 2004). For this purpose we use statistic tests which evaluate the statistical significance of estimated difference between two AUC, with previously defined level of statistical significance (P).
Research Design And Method
In a prospective cohort study, all pregnant women attending the outpatient obstetric departments at the Ebonyi State University Teaching Hospital Abakaliki (EBSUTHAI) and Federal Medical Centre (FMC) Abakaliki during a 3-year study period from January 2007 to December 2009 were invited to participate. Women known to have preexisting diabetes were excluded from the study, as well as those who had not reported for prenatal care in one of two participating hospitals before 24 weeks of gestation. Only women who delivered after 28 weeks of gestation were included in the analysis.
Data
At intake, the following information was obtained: obstetric history, family history of diabetes, ethnicity (categorized as Igbo or non-Igbo), height, self reported weight (before pregnancy), age, and smoking habits (categorized as smoking or nonsmoking). BMI was calculated as weight in kilograms divided by the square of height in meters. The following data regarding pregnancy and outcome were recorded after delivery: weight gain during pregnancy, treatment
with diet or insulin, duration of pregnancy in days, birth weight of the neonate in grams, Apgar score after 1 and 5 min, and arterial and venous pH from the umbilical cord. In all women, the random glucose test was performed at intake (±12 weeks) and between the 24th and 28th week of gestation. If the random plasma glucose measured between 24 and 28 weeks of gestation was ≥6.8 mmol/l, the random glucose test was considered abnormal. If random plasma glucose measurement was not performed between the 24th and 28th week, a random plasma glucose at intake ≥6.8 mmol/l was considered indicative for GDM. A 50-g oral glucose challenge test was performed between the 24th and 28th week of gestation. The test was performed irrespective of time of the day and of the last meal. Plasma glucose was measured 1 h after administration of a solution containing 50 g of glucose. The predefined cutoff value for an abnormal test result was a 1-h plasma glucose value of 7.8 mmol/l. If either the random glucose test or the 50-g oral glucose challenge test exceeded the predefined threshold value, a 2-h 75-g oral glucose tolerance test (OGTT) was performed within 1 week to confirm or rule out the presence of GDM (reference test). The OGTT was performed in the morning after a 12-h overnight fast and 3 days of minimal 150- to 200-g carbohydrate diet. Plasma glucose was determined before and 2 h after administration of a 75-g glucose-containing solution. GDM was considered present if venous plasma glucose equaled or exceeded the threshold values according to
World Health Organization criteria (<7.8 mmol/l after 12-h overnight fast and ≥7.8 mmol/l at 2 h after administration of a 75-g glucose-containing solution). These criteria were also applied in the randomized controlled trial in which treatment of GDM was considered beneficial (Crowther et al, 2005).
Verification bias
38 protocol, not performed in all patients. We used the
following procedure to correct for verification bias. We performed the OGTT (reference test) in an arbitrary subset of consecutive patients with two negative screening test results to determine the extent to which cases of GDM were missed by the screening tests. Subsequently, we estimated OGTT measurements in women who were not subjected to an OGTT based on results of the random test and the 50-g 50-glucose screenin50-g test as well as on patient characteristics using multiple logistic regression analysis. In other words, if the result of the OGTT was missing, OGTT values were estimated with multiple regression analysis, using the results of the two screening tests and available patient characteristics. This procedure to handle missing data is called imputation and is a commonly used adequate technique to correct for verification bias (Rubin, 1987;Schafer, 1997). By using multiple imputation instead of single imputation (i.e., performing the imputation procedure multiple times instead of just once), uncertainty in the imputed values is reflected by the variation in imputed values across multiple imputed datasets and, thus, by appropriately larger SEs (Frank,2001). The multiple imputation procedure was also used to impute incidental missing data on patient characteristics.
Statistical analysis
The distribution of continuous variables is reported as means ±SD. We constructed two-by-two tables for abnormal and normal test results on the random glucose test and the 50-g glucose screening test against the OGTT. These tables reflect true-positive, false-positive, true -negative, or false-negative test results for both the random glucose test and the 50-g glucose challenge test. Diagnostic accuracy (sensitivity, specificity, predictive values, and likelihood ratios) and 95% CIs were calculated. Receiver operating characteristic (ROC) analysis was used to evaluate the discriminatory power of the two screening tests. Data were analyzed using SPSS 12.0.1 (SPSS, Chicago, IL) and SAS 9.1.3.
Table 3:Screening and diagnostic test results before and after correction for verification bias. The figures in the table represent the number of women with the specific combination of test results before (after) correction of verification bias. Figures between parentheses represent the number of women after correction for verification bias.
Results
We included 1,305 women. Four women were excluded from analysis because they delivered before
39 unverified women were only classified as having
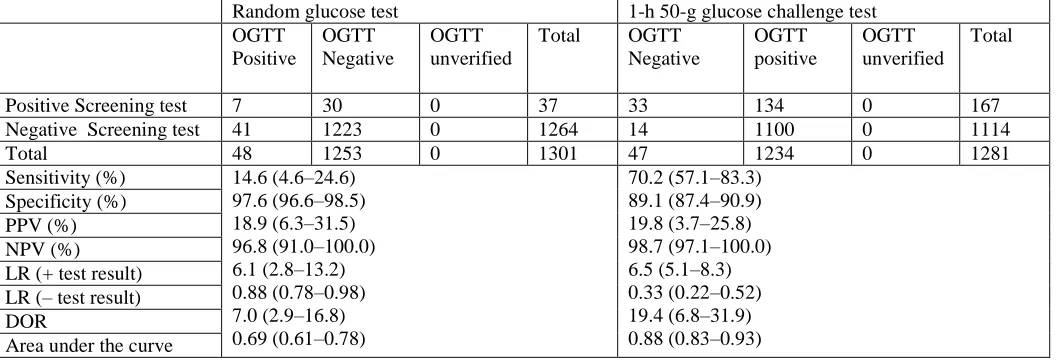
GDM if they had consistently imputed OGTT values that were indicative for GDM (>75%). After this adjusted multiple imputation procedure, the prevalence of GDM in our sample was 3.7%. Only two unverified women were classified as having GDM, whereas in all other women that were unverified no GDM was assumed. Table 2 displays results of the comparison of the two screening tests in terms of accuracy measures calculated after correction for verification bias. Comparison of accuracy measures after correction for verification bias resulted in an almost five times- higher sensitivity in favor of the 50-g glucose challenge test compared with the random glucose test (70.2% [95% CI 57.1– 83.3] vs. 14.6% [4.6 –24.6]). The random glucose test had less false-positive test results and was therefore more specific (97.6% [96.6 –98.5] vs. 89.1% [87.4 –90.9]). Positive predictive values for both tests were comparable, as were the negative predictive values. The likelihood ratio of an abnormal test result was larger for the 50-g glucose challenge test than for the random glucose test. The likelihood ratio of a normal test was smaller for the 50-g glucose challenge test. The area under the ROC curve was larger for the 50-g glucose challenge test (0.88 [0.83– 0.93]) than for the random glucose test (0.69 [0.61– 0.78]). There was a significant difference in the areas under the curve of the two tests of 0.19 (0.11– 0.27).
Conclusions
Evidence for screening for GDM is often inconsistent and difficult to interpret due to various screening methods and thresholds applied internationally. An evidence-based policy could increase the number of identified women with GDM and therefore reduce the number of neonatal and maternal complications by providing adequate monitoring and treatment for these women. For this purpose, the present study compared the random glucose test and the 50-g glucose challenge test as screening tests for GDM. The area under the curve was larger for the 50-g glucose challenge test, indicating that the 50-g glucose challenge test was a better predictor for GDM than the random glucose test. A potential weakness in the present study is the number of missing reference tests, due to which verification bias occurred. Because verification was apparently not performed at random, characteristics other than the screening test results influenced the chance of verification. An intuitive and straightforward procedure to correct for verification bias would be to calculate the ratio of diseased to nondiseased from the results of the verified patients stratified by screening test results and to extrapolate this ratio to the unverified patients (Begg, 1987; Begg
40 results in favor of the fasting glucose measurement,
whereas Rey et al. (2004) showed the 50-g glucose challenge test to be superior. Other studies investigating the test characteristics of the glucose challenge test reported sensitivities ranging from 58 to 80% (de Sereday et al, 2003;Maresh,2005) for a specificity of
:
65% (Maresh,2005). In these studies, thresholds for an abnormal result of the challenge test ranged from 7.2 to 7.8 mmol/l. In the present study, a predefined cutoff value for an abnormal test result was set at 7.8 mmol/l. If thresholds were set <7.8 mmol/l, sensitivity of the 50-g glucose challenge test would increase at the expense of a decreased specificity. The random glucose test is a fast, simple, and relatively inexpensive test. Accuracy of random glucose measurement is less frequently studied than that of the glucose challenge test. Nasrat et al. (1988) evaluated random glucose measurement, which revealed asensitivity of 16% and a specificity of 96% using a threshold value of 7.0 mmol/l or 6.4 mmol/l if evaluated ≥2 h postprandial. Jowett et al. (1987) also concluded that random glucose measurement is not sufficiently sensitive for screening on GDM. Results from the present study are in accordance with results from those two groups, using a threshold value for an abnormal test result of 6.8 mmol/l. As high sensitivity is key to any screening test, random glucose testing is not an accurate method to screen women for GDM because five of six women with GDM would still be missed. In conclusion, we recommend that despite easy implementation, low costs, and relative high specificity, random glucose measurement should not be used as a screening test for GDM. Until superior screening alternatives become available, the 50-g glucose challenge test should be the preferred screening test for GDM.
Table 1: Relationship between the area under the ROC curve (AUC) and diagnostic accuracy. Area Diagnostic Accuracy
0.9-1.0 Excellent 0.8-0.9 Very good
0.7-0.8 Good
0.6-0.7 Sufficient
0.5-0.6 Bad
< 0.5 Test not useful
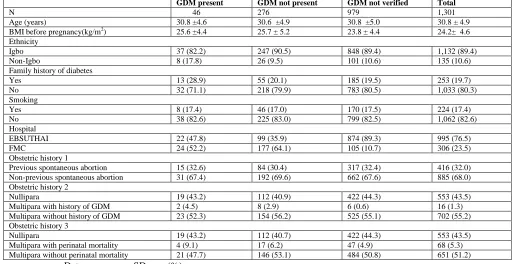
Table 2-Demographics before correction for verification bias
GDM present GDM not present GDM not verified Total
N 46 276 979 1,301
Age (years) 30.8 ±4.6 30.6 ±4.9 30.8 ±5.0 30.8 ± 4.9
BMI before pregnancy(kg/m2) 25.6 ±4.4 25.7 ± 5.2 23.8 ± 4.4 24.2± 4.6
Ethnicity
Igbo 37 (82.2) 247 (90.5) 848 (89.4) 1,132 (89.4)
Non-Igbo 8 (17.8) 26 (9.5) 101 (10.6) 135 (10.6)
Family history of diabetes
Yes 13 (28.9) 55 (20.1) 185 (19.5) 253 (19.7)
No 32 (71.1) 218 (79.9) 783 (80.5) 1,033 (80.3)
Smoking
Yes 8 (17.4) 46 (17.0) 170 (17.5) 224 (17.4)
No 38 (82.6) 225 (83.0) 799 (82.5) 1,062 (82.6)
Hospital
EBSUTHAI 22 (47.8) 99 (35.9) 874 (89.3) 995 (76.5)
FMC 24 (52.2) 177 (64.1) 105 (10.7) 306 (23.5)
Obstetric history 1
Previous spontaneous abortion 15 (32.6) 84 (30.4) 317 (32.4) 416 (32.0)
Non-previous spontaneous abortion 31 (67.4) 192 (69.6) 662 (67.6) 885 (68.0)
Obstetric history 2
Nullipara 19 (43.2) 112 (40.9) 422 (44.3) 553 (43.5)
Multipara with history of GDM 2 (4.5) 8 (2.9) 6 (0.6) 16 (1.3)
Multipara without history of GDM 23 (52.3) 154 (56.2) 525 (55.1) 702 (55.2)
Obstetric history 3
Nullipara 19 (43.2) 112 (40.7) 422 (44.3) 553 (43.5)
Multipara with perinatal mortality 4 (9.1) 17 (6.2) 47 (4.9) 68 (5.3)
Multipara without perinatal mortality 21 (47.7) 146 (53.1) 484 (50.8) 651 (51.2)
41 Table-3
1301 women met the inclusion criteria
Negative random glucose test-1264 Positive random glucose test-37
Unknown 50g glucose
challenge test-20
Negative 50g glucose challenge test-1097
Positive 50g glucose challenge test-147
Negative 50g glucose challenge test-17
Positve 50g glucose challenge test-20
Negativ e OGTT-3(19)
Positive OGTT-1(1)
Unverifie d OGTT-16(0)
Negative OGTT-159(1084)
Positive OGTT-13(13)
Unverifie d OGTT-925(0)
Negativ e OGTT-97(120)
Positive OGTT-27(27)
Unverifie d OGTT-23(0)
Negativ e OGTT-8(16)
Positive OGTT-1(1)
Unverifie d OGTT-8(0)
Negativ e OGTT-9(14)
Positiv e OGTT-4(6)
Unverifie d OGTT-7(0)
Table 4: Results of the 2×2 table and accuracy measures calculated after correction for verification bias.
Random glucose test 1-h 50-g glucose challenge test OGTT
Positive
OGTT Negative
OGTT unverified
Total OGTT Negative
OGTT positive
OGTT unverified
Total
Positive Screening test 7 30 0 37 33 134 0 167
Negative Screening test 41 1223 0 1264 14 1100 0 1114
Total 48 1253 0 1301 47 1234 0 1281
Sensitivity (%) 14.6 (4.6–24.6) 97.6 (96.6–98.5) 18.9 (6.3–31.5) 96.8 (91.0–100.0) 6.1 (2.8–13.2) 0.88 (0.78–0.98) 7.0 (2.9–16.8) 0.69 (0.61–0.78)
70.2 (57.1–83.3) 89.1 (87.4–90.9) 19.8 (3.7–25.8) 98.7 (97.1–100.0) 6.5 (5.1–8.3) 0.33 (0.22–0.52) 19.4 (6.8–31.9) 0.88 (0.83–0.93) Specificity (%)
PPV (%) NPV (%) LR (+ test result) LR (– test result) DOR
42 References
American Diabetes Association (2003) Gestational diabetes mellitus. Diabetes Care 26 (Suppl. 1):S103–S105.
Bamber, D. (1975) "The area above the ordinal dominance graph and the area below the receiver operating characteristic graph" Journal of Mathematical Psychology, Vol.12, pp.:387–415.
Begg CB, Greenes RA (1983) "Assessment of diagnostic tests when disease verification is subject to selection bias" Biometrics, Vol. 39, pp. 207–215.
Begg CB (1987) "Biases in the assessment of diagnostic tests" Stat Med Vol.6, pp.411– 423.
Bradley, A. P. (1997) "The use of the area under the roc curve in the evaluation of machine learning algorithms" Pattern Recognition, Vol. 30, No.7, pp.1145-59.
Brody SC, Harris R, Lohr K (2003) "Screening for gestational diabetes: a summary of the evidence for the U.S. Preventive Services Task Force" Obstet Gynecol Vol.101, pp.380–392.
Crowther CA, Hiller JE, Moss JR, McPhee AJ, Jeffries WS, Robinson JS (2005) "Effect of treatment of gestational diabetes mellitus on pregnancy outcomes" N Engl J Med Vol.352, pp.2477–2486.
De Sereday MS, Damiano MM, Gonzalez CD, Bennett PH (2003) "Diagnostic criteria for gestational diabetes in relation to pregnancy outcome" J Diabetes Complications Vol.17:115–119.
Esakoff TF, Cheng YW, Caughey AB (2005) "Screening for gestational diabetes: different cut-offs for different ethnicities?" Am J Obstet Gynecol Vol.193, pp.1040– 1044.
Frank Harrell (2001) Regression Modeling Strategies. New York, Springer.
Ferri C., Flach P., Hernandez-Orallo J. (2002) Learning Decision Trees Using the Area under the ROC Curve. Nineteenth International Conference on Machine Learning (ICML 2002); Morgan Kaufmann; pp. 46-139.
Hanley, J. A. and McNeil, B. J. (1982) The meaning and use of the area under a receiver operating characteristic (ROC) curve. Radiology, Vol.143, pp.29–36.
Hosmer, D. W., Lemeshow, S. (2000) Applied Logistic Regression, Second Edition, Wiley, Inc., New York.
Hunink MG, Richardson DK, Doubilet PM, Begg CB (1990) "Testing for fetal pulmonary maturity: ROC analysis involving covariates, verification bias, and combination testing" Med Decis Making Vol.10, pp.201– 211.
Jensen DM, DammP, Sorensen B, Molsted- Pedersen L, Westergaard JG, Korsholm L, Ovesen P, Beck Nielsen H (2003) Proposed diagnostic thresholds for gestational diabetes mellitus according to a 75-g oral glucose tolerance test: maternal and perinatal outcomes in 3260 Danish women. Diabet Med 20:51–57
Jowett NI, Samanta AK, Burden AC (1987) Screening for diabetes in pregnancy: is a random blood glucose enough? Diabet Med Vol.4, pp.160 –163.
Langer O, Yogev Y, Most O, Xenakis EM (2005) Gestational diabetes: the consequences of not treating. Am J Obstet Gynecol Vol.192, pp.989–997.
Mathai M, Thomas TJ, Kuruvila S, Jairaj P (1994) "Random plasma glucose and the glucose challenge test in pregnancy" Natl Med J India Vol.7, pp.160 –162.
Maresh M (2005) Screening for gestational diabetes mellitus. Semin Fetal Neonatal Med Vol.10, pp.317–323.
McElduff A, Goldring J, Gordon P, Wyndham L (1994) A direct comparison of the measurement of a random plasma glucose and a post-50 g glucose load glucose, in the detection of gestational diabetes. Aust N Z J Obstet Gynaecol Vol.34, pp. 28 –30.
Nasrat AA, Johnstone FD, Hasan SA (1988) Is random plasma glucose an efficient screening test for abnormal glucose tolerance in pregnancy? Br J Obstet Gynaecol 95:855– 860.
Naylor CD, Sermer M, Chen E, Farine D (1997) "Selective screening for gestational diabetes mellitus: Toronto Trihospital Gestational Diabetes Project Investigators" N Engl J Med Vol.337, pp.1591–1596.
Obuchowski NA, Lieber ML, Wians FH Jr (2004) "ROC curves in clinical chemistry: uses, misuses, and possible solutions" Clin Chem, Vol.50, No.7, pp.1118-1125.
Pepe MS, Alonzo TA (2001) "Comparing disease screening tests when true disease status is ascertained only for screen positives" Biostatistics Vol.2, pp.249 –260.
43 Perucchini D, Fischer U, Spinas GA, Huch R, Huch A,
Lehmann R (1999) "Using fasting plasma glucose concentrations to screen for gestational diabetes mellitus: prospective population based study" BMJ Vol.319, pp.812– 815, 1999.
Poyhonen-Alho MK, Teramo KA, Kaaja RJ, Hiilesmaa VK (2005) "50 gram oral glucose challenge test combined with risk factorbased screening for gestational diabetes" Eur J Obstet Gynecol Reprod Biol Vol.121, pp.34– 37.
Rey E, Hudon L, Michon N, Boucher P, Ethier J, Saint-Louis P (2004) "Fasting plasma glucose versus glucose challenge test: screening for gestational diabetes and cost effectiveness" Clin Biochem Vol37, pp.780 –784.
Rubin DB (1987) Multiple Imputation for Nonresponse in Surveys. New York, John Wiley and Sons.
Santos-Ayarzagoitia M, Salinas-Martinez AM, Villarreal-Perez JZ (2006) "Gestational diabetes: validity of ADA and WHO diagnostic criteria using NDDG as the reference test" Diabetes Res Clin Pract Vol.74, pp.322–328.
Schafer JL (1997) Analysis of Incomplete Multivariate Data. New York, Chapman and Hall.
Sivan E, Weisz B, Homko CJ, Reece EA, Schiff E (2001) "One or two hours postprandial glucose measurements: are they the same?" Am J Obstet Gynecol Vol.185, pp.604–607.
Tuffnell DJ, West J, Walkinshaw SA (2003) Treatments for gestational diabetes and impaired glucose tolerance in pregnancy. Cochrane Database Syst Rev CD003395.