R E S E A R C H A R T I C L E
Open Access
Correlation between optic nerve head
circulation and visual function before and
after anti-VEGF therapy for central retinal
vein occlusion: prospective, interventional
case series
Daisuke Nagasato
1,2, Yoshinori Mitamura
3*, Kentaro Semba
3, Kei Akaiwa
3, Toshihiko Nagasawa
1,2, Yuki Yoshizumi
1,
Hitoshi Tabuchi
1and Yoshiaki Kiuchi
2Abstract
Background:To determine the correlation between the optic nerve head (ONH) circulation determined by laser speckle flowgraphy and the best-corrected visual acuity or retinal sensitivity before and after intravitreal bevacizumab or ranibizumab for central retinal vein occlusion.
Methods:Thirty-one eyes of 31 patients were treated with intravitreal bevacizumab or ranibizumab for macular edema due to a central retinal vein occlusion. The blood flow in the large vessels on the ONH, the best-corrected visual acuity, and retinal sensitivity were measured at the baseline, and at 1, 3, and 6 months after treatment. The arteriovenous passage time on fluorescein angiography was determined. The venous tortuosity index was calculated on color fundus photograph by dividing the length of the tortuous retinal vein by the chord length of the same segment. The blood flow was represented by the mean blur rate (MBR) determined by laser speckle flowgraphy. To exclude the influence of systemic circulation and blood flow in the ONH tissue, the corrected MBR was calculated as MBR of ONH vessel area–MBR of ONH tissue area in the affected eye divided by the vascular MBR–tissue MBR in the unaffected eye. Pearson’s correlation tests were used to determine the significance of correlations between the MBR and the best-corrected visual acuity, retinal sensitivity, arteriovenous passage time, or venous tortuosity index.
Results:At the baseline, the corrected MBR was significantly correlated with the arteriovenous passage time and venous tortuosity index (r= -0.807,P< 0.001;r= -0.716,P< 0.001; respectively). The corrected MBR was significantly correlated with the best-corrected visual acuity and retinal sensitivity at the baseline, and at 1, 3, and 6 months (allP< 0.050). The corrected MBR at the baseline was significantly correlated with the best-corrected visual acuity at 6 months (r= -0.651, P< 0.001) and retinal sensitivity at 6 months (r= 0.485,P= 0.005).
Conclusions:The pre-treatment blood flow velocity of ONH can be used as a predictive factor for the best-corrected visual acuity and retinal sensitivity after anti-VEGF therapy for central retinal vein occlusion.
Trial registration:Trial Registration number: UMIN000009072. Date of registration: 10/15/2012.
Keywords:Anti-vascular endothelial growth factor agent, Central retinal vein occlusion, Fundus-related microperimetry, Laser speckle flowgraphy, Retinal blood flow
* Correspondence:[email protected]
3Department of Ophthalmology, Institute of Biomedical Sciences, Tokushima
University Graduate School, 3-18-15 Kuramoto, Tokushima 770-8503, Japan Full list of author information is available at the end of the article
Background
A central retinal vein occlusion (CRVO) is one of the major causes of vision reduction, and anti-vascular endothelial growth factor (VEGF) agents have been shown to significantly improve visual acuity in eyes with macular edema (ME) due to a CRVO [1].
Laser speckle flowgraphy (LSFG) is a non-invasive method of real-time measurements of the blood flow on the optic nerve head (ONH), retina, and choroid [2–6]. It can measure the relative blood flow velocity, called the mean blur rate (MBR), that has been shown to be significantly correlated with the actual blood flow rate determined by the hydrogen gas clearance method and the microspheres technique [7, 8]. It has been reported that LSFG can record the blood flow from the same location of an eye with high reproducibility especially on the ONH [9]. This then provides an accurate way to monitor the circulation changes before and after phar-macological interventions [10].
Yamada et al. reported that the MBR values in large ONH vessels measured by LSFG were correlated with the higher aqueous VEGF concentrations in eyes with CRVO [11]. Nagaoka et al. reported that a single intra-vitreal bevacizumab (IVB) injection did not affected the retinal microcirculation in eyes with acute branch retinal vein occlusion (BRVO) for at least 3 months after the in-jection [12]. However, there has been no report that compared the ocular circulation before and after anti-VEGF therapy for CRVO except for a report of 3 cases in which the statistical association between ONH circu-lation and visual function was not determined [13].
Thus, the purpose of this study was to examine the relationship between the retinal blood flow and visual acuity or retinal sensitivity in 31 eyes before and after IVB or intravitreal ranibizumab (IVR) for CRVO.
Methods
This was a prospective, interventional case series of 31 eyes of 31 treatment-naïve patients (20 men and 11 women) with unilateral CRVO. The patients were exam-ined by LSFG and microperimetry at the baseline and at 1, 3, and 6 months after IVB or IVR for ME due to a CRVO. The fluorescein arteriovenous passage time was determined at the baseline. All patients were examined within 3 month of the onset of the symptoms. The age of the patients at presentation ranged from 40 to 83 years (mean, 66.9 years). All treatment-naïve patients who were diagnosed with ME due to CRVO, had a healthy fellow eye, and had IVB or IVR injections in the Department of Ophthalmology of Saneikai Tsukazaki Hospital from October 2012 through February 2015 were studied. Approval was obtained from the Institutional Review Board of Saneikai Tsukazaki Hospital prior to be-ginning this study, and the patients gave their written
informed consent prior to their inclusion. The patients have provided permission to publish clinical data of their case in this study. This study was registered with the University hospital Medical Information Network (UMIN) clinical trials registry. The registration title is “UMIN000009072, Correlation between optic nerve head circulation and retinal sensitivity before and after anti-VEGF drug intravitreal injection for central retinal vein oc-clusion” (October 15, 2012). The procedures used in this study adhered to the tenets of the Declaration of Helsinki.
Patients with ME due to a CRVO, central foveal thick-ness of ≥250 μm in the optical coherence tomographic (OCT) images, and a decimal visual acuity from 0.01 to 0.8 were studied. Patients with a history of cerebral in-farction, anti-VEGF therapy, vitrectomy, and uveitis, or other vitreoretinal diseases were excluded. In addition, patients with uncontrolled high blood pressure, diabetes, intraocular pressure (IOP) of 21 mmHg or more, or iris neovascularization were excluded.
The blood flow of the major blood vessels on the ONH was measured in all patients, and the arterioven-ous passage time of the retina was determined by fluor-escein angiography (FA). A previous study investigating CRVO with FA [14] showed that more than 10 disc areas of the nonperfusion areas were observed in the ischemic type of CRVO. Thus, a diagnosis of ischemic CRVO was made in eyes with more than 10 disc areas of the nonperfusion areas [11]. The venous tortuosity index was calculated on color fundus photograph.
Patients who started their treatment between October 2012 and August 2013 received IVB injections (1.25 mg/ 0.05 mL), and those who started treatment between September 2013 and February 2015 received IVR injec-tions (0.5 mg/0.05 mL). After the initial treatment, the patients were examined once a month. When the central foveal thickness was ≥250 μm, or the physician deter-mined that additional treatment was necessary, the patients received additional injections of the same anti-VEGF agent.
Laser speckle flowgraphy
LSFG-NAVI (Softcare, Fukuoka, Japan) was used to evaluate the ONH circulation in eyes with a CRVO (Figs. 1 and 2). The principles of LSFG have been reported in detail [15]. In brief, LSFG uses a diode laser (wavelength 830 nm) to detect the movement of the red
blood cells in the blood vessels. The light scattered by the movement of the blood cells creates speckle patterns on the area where the sensor is focused, and the scattered light produces a blur in the speckle patterns. The mean blur rate, which is the change in the blur, is a quantitative value that represents the relative blood flow velocity [15–19].
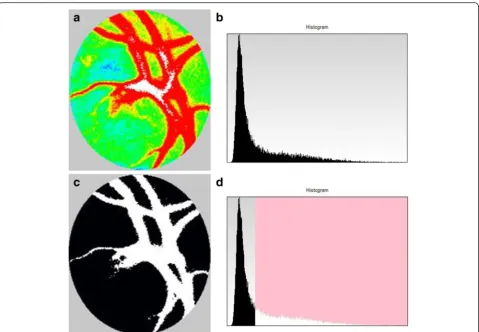
The patient's pupil was dilated with Mydrin P (1 % tropi-camide and 2.5 % phenylephrine) 30 min prior to the LSFG examinations. During the examinations, the patients were instructed to fixate steadily on a target light while the speckle pattern on the ONH was recorded. With an auto-tracking system, the same site can be measured for several seconds. The relative blood flow velocity is repre-sented by the MBR and displayed as a two-dimensional color map. The MBR of the vessel area is expressed as the MV and the MBR of the tissue area as the MT. The
appropriate threshold between the vessel and tissue areas is automatically determined by the built-in software, and the MBR of the area of the major arteries and veins as MV and the MBR of the tissue area as MT can be calcu-lated (Fig. 3) [9].
When measuring the retinal circulation with LSFG, the measurements are influenced by the deep choroidal circulation. Similarly, the ONH measurements are influenced by the blood flow of the ONH tissue (MT) [15, 16]. To evaluate the major arteriovenous circulation
of the ONH excluding the blood flow of the ONH tissue, the value was obtained by subtracting the MT from the MV [11]. In addition, to exclude the influence of each patient's systemic circulation at the time of the measure-ments and to allow for inter-patient comparisons of the measurements, a corrected MBR value was obtained by the MBR (MV minus MT) of the affected eye divided by the MBR (MV minus MT) of the fellow eye [11]. The LSFG was measured at the baseline and at 1, 3, and 6 months after the initial treatment.
Microperimetry
The retinal sensitivity was determined by macular integ-rity assessment (MAIA) microperimetry (CenterVue, Padova, Italy; Figs. 1 and 2). MAIA testing was con-ducted in a dark room without pupil dilation. The test-ing conditions were similar to that described in detail in previous studies [17, 18]. Briefly, 37 loci in the 10° cen-tral macula was assessed using a 4 to 2 threshold strat-egy, a fixation target that consisted of a red circle with a
1° diameter, stimulus size of Goldmann III, background luminance of 4 apostilb (asb), maximum luminance of 1000 asb, and a stimulus dynamic range of 36 dB.
Calculation of venous tortuosity index
The venous tortuosity index was calculated as previously reported (Figs. 1 and 2) [20, 21]. Briefly, color fundus photographs were obtained with a Topcon fundus cam-era (TRC-50DX, Topcon, Tokyo, Japan). The course of the veins was traced using the Photoshop software (Adobe Systems, Inc. Ca, USA). Measurements of the superior and inferior venous arcades were obtained starting from the ONH margin to the crossing point of a circle whose diameter was the distance from the center of ONH to the fovea. NIH ImageJ software was used to measure the length of the tortuous vein and length of the chord of the vessel. The venous tortuosity was calcu-lated by dividing the arc length of the retinal vein by the chord length of the same segment. The average of the venous tortuosity of the superior and inferior venous
arcades was calculated to obtain the venous tortuosity index.
Statistical analyses
Repeated-measures analysis of variance (ANOVA) with Greenhouse-Geisser corrections was used to determine the significance of the changes in the BCVA, retinal sen-sitivity, corrected MBR, MV, MT, SBP, DBP, heart rate, IOP, MAP, and MOPP. The Bonferroni test was used for post hoc analysis. Pearson’s correlation tests were used to determine the significance of correlations between the corrected MBR and the BCVA, retinal sensitivity, ar-teriovenous passage time, or venous tortuosity index. A
Pvalue of <0.05 was considered statistically significant.
Results
All patients were followed for at least 6 months after the initial injection of IVB or IVR. IVB was performed on 15 eyes and IVR on 16 eyes. The injections were adminis-tered two to five times (3.52 ± 0.88 (mean ± SD)) to each patient during the 6 months. According to the FA find-ings, the diagnosis of nonischemic CRVO was made in 26 eyes (Figs. 4 and 5), and the diagnosis of ischemic CRVO was made in 5 eyes. The SBP, DBP, heart rate, IOP, MAP, and MOPP were not significantly different among the baseline and 1, 3, and 6 months after the treatments (P= 0.930, P= 0.958, P= 0.966, P= 0.745,
P= 0.969, P= 0.886, respectively).
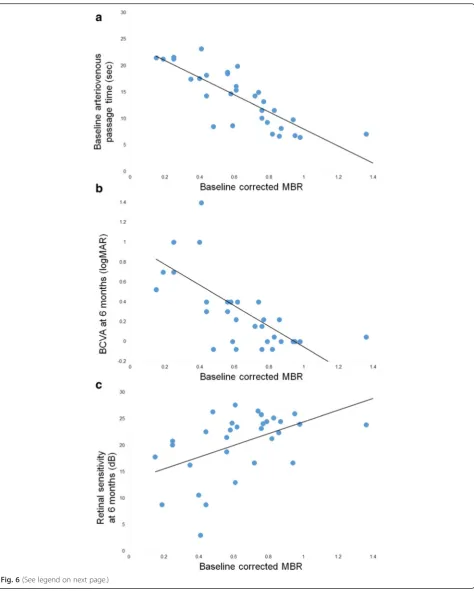
At the baseline, the corrected MBR was 0.63 ± 0.26. The arteriovenous passage time on FA was 14.0 ± 5.2 s, and the venous tortuosity index on color fundus photo-graph was 1.113 ± 0.053. The corrected MBR was sig-nificantly correlated with the arteriovenous passage time (r= -0.807, P <0.001; Fig. 6a) and venous tortuosity
index (r= -0.716, P <0.001). The corrected MBR after the first intravitreal injection was 0.60 ± 0.23 at 1 month, 0.61 ± 0.23 at 3 months, and 0.62 ± 0.28 at 6 months (Additional file 1). No significant differences were ob-served in the corrected MBR among the baseline and post-treatment times (P= 0.379). The MV in the af-fected eye was 34.8 ± 11.2 at the baseline, 32.0 ± 10.3 at 1 month, 31.6 ± 10.9 at 3 months, and 32.9 ± 12.2 at 6 months. No significant differences were observed in the MV among the baseline and post-treatment times (P= 0.116). The MT was 14.3 ± 4.6 at the baseline, 12.4 ± 3.8 at 1 month, 11.7 ± 4.0 at 3 months, and 12.3 ± 4.2 at 6 months. Significant differences were observed in the MT among the baseline and post-treatment times (P= 0.003). The MT at 1 and 3 months was significantly smaller than that at the baseline (P= 0.011,P= 0.002, respectively).
The mean BCVA was 0.68 ± 0.48 logMAR units at the baseline, 0.39 ± 0.36 logMAR units at 1 month after the first intravitreal injection, 0.36 ± 0.35 logMAR units at 3 months, and 0.33 ± 0.42 logMAR units at 6 months. Sig-nificant differences were observed in the BCVA among the baseline and post-treatment times (P <0.001). The BCVA at 1, 3, and 6 months was significantly better than that at the baseline (P<0.001,P= 0.001,P= 0.007, respectively).
The retinal sensitivity was 15.2 ± 7.5 dB at the baseline, 18.7 ± 6.6 dB at 1 month, 20.9 ± 6.0 dB at 3 months, and 20.4 ± 6.0 dB at 6 months. Significant differences were observed in the retinal sensitivity among the baseline and post-treatment times (P <0.001). The retinal sensi-tivity at 1, 3, and 6 months was significantly better than that at the baseline (P= 0.001, P <0.001, P= 0.001, respectively).
Fig. 4Fluorescein angiography before anti-VEGF therapy for central retinal vein occlusion (CRVO). The same case presented in Fig. 1. Because there are not more than 10 disc areas of the nonperfusion areas, this case was diagnosed with nonischemic CRVO
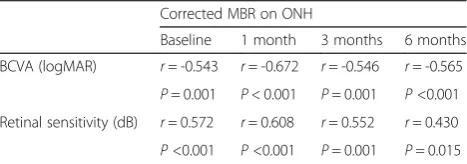
The MBR was significantly correlated with the BCVA (all P <0.005) and the retinal sensitivity (all P <0.050, Table 1) at all time points.
There was a significant correlation between the cor-rected MBR at the baseline and the BCVA at 6 months (r= -0.651, P <0.001; Fig. 6b). There was also a signifi-cant correlation between the corrected MBR at the baseline and the retinal sensitivity at 6 months (r= 0.485,
P= 0.005; Fig. 6c).
Discussion
The results showed that the corrected MBR at the base-line was significantly correlated with the BCVA and ret-inal sensitivity at 6 months after anti-VEGF therapy. This indicates that the visual prognosis is good in pa-tients with CRVO who have good blood flow on the ONH at the baseline. In a report on 3 cases with CRVO, Matsumoto et al. also suggested that the prognosis of CRVO may be predicted by measuring the MBR using LSFG [13]. In eyes with ME due to a BRVO, Nagaoka et al. reported that the visual prognosis was good when the retinal blood flow measured by laser Doppler velo-cimetry before IVB was good [12]. Taken together, these results suggest that the status of the blood flow prior to the treatment is a useful predictor of the post-treatment BCVA for both CRVO and BRVO.
The measurements of the LSFG had excellent repro-ducibility which then permitted a non-invasive method to measure the ocular circulation. Aizawa et al. used LSFG and reported that the intra-session reproducibility of the MBR in the ONH of three continuous ex-aminations was excellent with a coefficient of variation of 3.4 ± 2.0 and an intraclass correlation coefficient of 0.95 [9]. Aizawa et al. also reported that the MBR of the ONH tissue was strongly correlated with the visual field sensitivity in eyes with glaucoma [3]. In addition, Maekubo et al. reported that measurements of the ONH circulation by LSFG could be used for differentiating nonarteritic ischemic optic neuropathy from anterior optic neuritis [19]. Based on these findings, measuring the ONH circulation by LSFG can be considered a use-ful method in the clinic.
Yamada et al. measured the MBR on the ONH in eyes with untreated CRVO [11]. The corrected MBR was cal-culated to exclude the influence of the systemic circula-tion and blood flow of the ONH tissue. After obtaining the MBR values by subtracting the MT from the MV, the ONH blood flow was evaluated by taking the MBR values of the affected eye divided by the MBR values of the healthy fellow eye. The authors reported that this corrected MBR was significantly correlated with the ar-teriovenous passage time [11]. Similarly, a significant correlation was found between the corrected MBR and arteriovenous passage time in the present study. The strong correlation between the corrected MBR and arteriovenous passage time, which has been used as an indicator of retinal circulation, confirms that the method we used is a highly reliable way to evaluate the circula-tory status of the ONH. In addition, Yamada et al. re-ported that the corrected MBR values in large ONH vessels were significantly correlated with the aqueous VEGF concentrations in eyes with CRVO [11].
It is sometimes difficult to distinguish the vessel and tissue areas at the ONH in eyes with CRVO, because dilatation or blood stasis of capillary vessel on ONH ob-scures the boundary between the large vessel and tissue
(See figure on previous page.)
Fig. 6Correlation between optic nerve head (ONH) circulation and arteriovenous passage time or visual function. Correlation between the baseline mean blur rate (MBR) at the ONH and the baseline arteriovenous passage time, the best-corrected visual acuity (BCVA) at 6 months, or mean retinal sensitivity at 6 months is presented. To exclude the influence of systemic circulation and blood flow of ONH tissue, the corrected MBR was calculated as; (MBR of ONH vessel area–MBR of ONH tissue area) in the affected eye ÷ (vascular MBR–tissue MBR) in the healthy fellow eye [11].a: Correlation between the baseline corrected MBR at the ONH and the arteriovenous passage time at the baseline. The corrected MBR is significantly correlated with the arteriovenous passage time on fluorescein angiography (r= -0.807, P<0.001). The solid line represents the linear regression line (y = -16.102x + 24.200).b: Correlation between the baseline corrected MBR at the ONH and BCVA in logMAR units at 6 months after the initial treatment. The corrected MBR is significantly correlated with the BCVA at 6 months (r= -0.651,P<0.001). The solid line represents the linear regression line (y = -1.036x + 0.983).c: Correlation between the baseline corrected MBR at the ONH and mean retinal sensitivity at 6 months. The corrected MBR is significantly correlated with the retinal sensitivity at 6 months (r= 0.485,P= 0.005). The solid line represents the linear regression line (y = 11.059x + 13.378)
Table 1Correlations between MBR on ONH and BCVA or retinal
sensitivity before and after anti-VEGF therapy
Corrected MBR on ONH
Baseline 1 month 3 months 6 months BCVA (logMAR) r= -0.543 r= -0.672 r= -0.546 r= -0.565
P= 0.001 P< 0.001 P= 0.001 P<0.001 Retinal sensitivity (dB) r= 0.572 r= 0.608 r= 0.552 r= 0.430
P<0.001 P<0.001 P= 0.001 P= 0.015
on the LSFG images. Thus, the MV and MT values mea-sured in eyes with CRVO may include a measurement error. However, the corrected MBR in the present study was significantly correlated with not only arteriovenous passage time on FA but also the venous tortuosity index on fundus photograph, which suggests that this meas-urement error is considered to be small.
Nitta et al. reported that there was no significant change in the MBR measured by LSFG in the retinal artery, retinal vein, or ONH after a single IVB injection in eyes with a BRVO [22]. Nagaoka et al. also reported no significant changes in the retinal blood flow mea-sured by laser Doppler velocimetry after a single IVB injection for BRVO [12]. Consistent with these findings, our results showed no significant differences in the cor-rected MBR after IVB or IVR in eyes with a CRVO. On the other hand, Matsumoto et al. reported 3 cases of ME secondary to nonischemic CRVO in which the blood flow increased after IVBs [13]. In their case, the MBR increased in 3 or 4 weeks after the IVB was con-firmed by LSFG, but long term changes of the MBR and exact relationship between the MBR and visual prognosis were unclear.
This study has several limitations. First, the sample size was small, and the follow-up period was short. Fur-ther studies with a larger sample size and longer follow-up periods would be required to confirm our findings. We also need to keep in mind that when using LSFG the MBR is a relative value of the blood flow vel-ocity and not the absolute value. Therefore, when com-paring the difference between eyes, we used the corrected MBR value. The other limitation is that the present study included both patients treated with IVB and those with IVR. Lastly, Mayama et al. reported that phenylephrine eye drops can depress the ONH circula-tion [23]. In our study, Mydrin P, tropicamide and phenylephrine, was used prior to the LSFG testing to obtain more accurate measurements of the ONH circu-lation with LSFG. Thus, there is a possibility that phenylephrine may have influenced the ONH circula-tion. However, because Mydrin P was administered to both the affected and unaffected eyes and ONH circula-tion was evaluated using the equacircula-tion; the MBR of the affected eye/MBR of the unaffected eye, the magnitude of this influence may be small.
Conclusions
The blood flow velocity on the ONH was significantly correlated with the BCVA and retinal sensitivity before and after anti-VEGF therapy for CRVO. We suggest that the blood flow velocity of the ONH before the therapy is a predictive factor for the visual outcome after treatment for CRVO.
Ethics and consent to participate
Approval was obtained from the Institutional Review Board of Saneikai Tsukazaki Hospital prior to beginning this study, and the patients gave their written informed consent prior to their inclusion. The procedures used in this study adhered to the tenets of the Declaration of Helsinki.
Consent to publish
The patients have provided permission to publish clinical data of their case in this study.
Additional file
Additional file 1:Raw data (MBR, visual function). (DOC 68 kb)
Abbreviations
asb:apostilb; BCVA: best-corrected visual acuity; BRVO: branch retinal vein occlusion; CRVO: central retinal vein occlusion; DBP: diastolic blood pressure; FA: fluorescein angiography; IOP: intraocular pressure; IVB: intravitreal bevacizumab; IVR: intravitreal ranibizumab; LSFG: laser speckle flowgraphy; MAIA: macular integrity assessment; MAP: mean arterial pressure; MBR: mean blur rate; ME: macular edema; MOPP: mean ocular perfusion pressure; MT: mean blur rate of tissue area; MV: mean blur rate of vessel area; OCT: optical coherence tomography; ONH: optic nerve head; SBP: systolic blood pressure; SD-OCT: spectral-domain optical coherence tomography; UMIN: University hospital Medical Information Network; VEGF: vascular endothelial growth factor.
Competing interests
The authors declare that they have no competing interests.
Authors' contributions
Design of the study (YM), conduct of the study (DN, TN, YY, HT), management of the data (DN, YM, KS, KA, TN, YY, HT), analysis of the data (DN, YM, KS, KA, YK), interpretation of the data (DN, YM, KS, KA, YK), preparation of the manuscript (DN, YM) and overall coordination (YK). All authors read and approved the final manuscript.
Acknowledgements
This work was supported in part by Grants-in-Aid 25462717 (to YM) from the Ministry of Education, Culture, Sports, Science and Technology, Japan. The funding agencies had no role in the study design, data collection and analysis, decision to publish, or preparation of the manuscript. The authors thank Professor Emeritus Duco Hamasaki of the Bascom Palmer Eye Institute of the University of Miami for providing critical discussions and suggestions for our study and revision of the final manuscript.
Author details
1
Department of Ophthalmology, Saneikai Tsukazaki Hospital, Himeji, Japan.
2Department of Ophthalmology and Visual Sciences, Graduate School of
Biomedical Sciences, Hiroshima University, Hiroshima, Japan.3Department of
Ophthalmology, Institute of Biomedical Sciences, Tokushima University Graduate School, 3-18-15 Kuramoto, Tokushima 770-8503, Japan.
Received: 21 October 2015 Accepted: 29 March 2016
References
1. Yeh S, Kim SJ, Ho AC, Schoenberger SD, Bakri SJ, Ehlers JP, et al. Therapies for macular edema associated with central retinal vein occlusion: a report by the American Academy of Ophthalmology. Ophthalmology. 2015;122(4):769–78. 2. Sugiyama T, Araie M, Riva CE, Schmetterer L, Orgul S. Use of laser speckle
and fluorescein angiography, and the correlation with mean deviation. Clin Exp Ophthalmol. 2014;42(3):293–4.
4. Iwase T, Ra E, Yamamoto K, Kaneko H, Ito Y, Terasaki H. Differences of retinal blood flow between arteries and veins determined by laser speckle flowgraphy in healthy subjects. Medicine (Baltimore). 2015;94(33):e1256. 5. Yanagida K, Iwase T, Yamamoto K, Ra E, Kaneko H, Murotani K, et al.
Sex-related differences in ocular blood flow of healthy subjects using laser speckle flowgraphy. Invest Ophthalmol Vis Sci. 2015;56(8):4880–90. 6. Iwase T, Yamamoto K, Ra E, Murotani K, Matsui S, Terasaki H. Diurnal
variations in blood flow at optic nerve head and choroid in healthy eyes: diurnal variations in blood flow. Medicine (Baltimore). 2015;94(6):e519. 7. Takahashi H, Sugiyama T, Tokushige H, Maeno T, Nakazawa T, Ikeda T, et al.
Comparison of CCD-equipped laser speckle flowgraphy with hydrogen gas clearance method in the measurement of optic nerve head microcirculation in rabbits. Exp Eye Res. 2013;108:10–5.
8. Wang L, Cull GA, Piper C, Burgoyne CF, Fortune B. Anterior and posterior optic nerve head blood flow in nonhuman primate experimental glaucoma model measured by laser speckle imaging technique and microsphere method. Invest Ophthalmol Vis Sci. 2012;53(13):8303–9.
9. Aizawa N, Yokoyama Y, Chiba N, Omodaka K, Yasuda M, Otomo T, et al. Reproducibility of retinal circulation measurements obtained using laser speckle flowgraphy-NAVI in patients with glaucoma. Clin Ophthalmol. 2011;5:1171–6.
10. Sugiyama T, Kojima S, Ishida O, Ikeda T. Changes in optic nerve head blood flow induced by the combined therapy of latanoprost and beta blockers. Acta Ophthalmol. 2009;87(7):797–800.
11. Yamada Y, Suzuma K, Matsumoto M, Tsuiki E, Fujikawa A, Harada T, et al. Retinal blood flow correlates to aqueous vascular endothelial growth factor in central retinal vein occlusion. Retina. 2015;35(10):2037–42.
12. Nagaoka T, Sogawa K, Yoshida A. Changes in retinal blood flow in patients with macular edema secondary to branch retinal vein occlusion before and after intravitreal injection of bevacizumab. Retina. 2014;34(10):2037–43. 13. Matsumoto M, Suzuma K, Fukazawa Y, Yamada Y, Tsuiki E, Fujikawa A, et al.
Retinal blood flow levels measured by laser speckle flowgraphy in patients who received intravitreal bevacizumab injection for macular edema secondary to central retinal vein occlusion. Retin Cases Brief Rep. 2014;8(1):60–6. 14. Group CVOS. Natural history and clinical management of central retinal vein
occlusion. The Central Vein Occlusion Study Group. Arch Ophthalmol. 1997;115(4):486–91.
15. Isono H, Kishi S, Kimura Y, Hagiwara N, Konishi N, Fujii H. Observation of choroidal circulation using index of erythrocytic velocity. Arch Ophthalmol. 2003;121(2):225–31.
16. Nagahara M, Tamaki Y, Tomidokoro A, Araie M. In vivo measurement of blood velocity in human major retinal vessels using the laser speckle method. Invest Ophthalmol Vis Sci. 2011;52(1):87–92.
17. Sato S, Hirooka K, Baba T, Tenkumo K, Nitta E, Shiraga F. Correlation between the ganglion cell-inner plexiform layer thickness measured with cirrus HD-OCT and macular visual field sensitivity measured with microperimetry. Invest Ophthalmol Vis Sci. 2013;54(4):3046–51. 18. Roisman L, Ribeiro JC, Fechine FV, Lavinsky D, Moraes N, Campos M, et al.
Does microperimetry have a prognostic value in central serous chorioretinopathy? Retina. 2014;34(4):713–8.
19. Maekubo T, Chuman H, Nao-I N. Laser speckle flowgraphy for differentiating between nonarteritic ischemic optic neuropathy and anterior optic neuritis. Jpn J Ophthalmol. 2013;57(4):385–90.
20. Ferrara DC, Koizumi H, Spaide RF. Early bevacizumab treatment of central retinal vein occlusion. Am J Ophthalmol. 2007;144(6):864–71.
21. Yasuda S, Kachi S, Kondo M, Ueno S, Kaneko H, Terasaki H. Significant correlation between retinal venous tortuosity and aqueous vascular endothelial growth factor concentration in eyes with central retinal vein occlusion. PLoS One. 2015;10(7):e0134267.
22. Nitta F, Kunikata H, Aizawa N, Omodaka K, Shiga Y, Yasuda M, et al. The effect of intravitreal bevacizumab on ocular blood flow in diabetic retinopathy and branch retinal vein occlusion as measured by laser speckle flowgraphy. Clin Ophthalmol. 2014;8:1119–27.
23. Mayama C, Ishii K, Saeki T, Ota T, Tomidokoro A, Araie M. Effects of topical phenylephrine and tafluprost on optic nerve head circulation in monkeys with unilateral experimental glaucoma. Invest Ophthalmol Vis Sci. 2010;51(8):4117–24.
• We accept pre-submission inquiries
• Our selector tool helps you to find the most relevant journal • We provide round the clock customer support
• Convenient online submission • Thorough peer review
• Inclusion in PubMed and all major indexing services • Maximum visibility for your research
Submit your manuscript at www.biomedcentral.com/submit