Biogeosciences, 10, 5571–5588, 2013 www.biogeosciences.net/10/5571/2013/ doi:10.5194/bg-10-5571-2013
© Author(s) 2013. CC Attribution 3.0 License.
EGU Journal Logos (RGB)
Advances in
Geosciences
Open Access
Natural Hazards
and Earth System
Sciences
Open AccessAnnales
Geophysicae
Open AccessNonlinear Processes
in Geophysics
Open AccessAtmospheric
Chemistry
and Physics
Open AccessAtmospheric
Chemistry
and Physics
Open Access DiscussionsAtmospheric
Measurement
Techniques
Open AccessAtmospheric
Measurement
Techniques
Open Access DiscussionsBiogeosciences
Open Access Open Access
Biogeosciences
DiscussionsClimate
of the Past
Open Access Open Access
Climate
of the Past
Discussions
Earth System
Dynamics
Open Access Open Access
Earth System
Dynamics
DiscussionsGeoscientific
Instrumentation
Methods and
Data Systems
Open Access
Geoscientific
Instrumentation
Methods and
Data Systems
Open Access DiscussionsGeoscientific
Model Development
Open Access Open Access
Geoscientific
Model Development
DiscussionsHydrology and
Earth System
Sciences
Open AccessHydrology and
Earth System
Sciences
Open Access DiscussionsOcean Science
Open Access Open Access
Ocean Science
DiscussionsSolid Earth
Open Access Open Access
Solid Earth
DiscussionsThe Cryosphere
Open Access Open Access
The Cryosphere
DiscussionsNatural Hazards
and Earth System
Sciences
Open Access
Discussions
Microphytobenthos and benthic macroalgae determine sediment
organic matter composition in shallow photic sediments
A. K. Hardison1,*, E. A. Canuel1, I. C. Anderson1, C. R. Tobias2, B. Veuger3, and M. N. Waters4
1Virginia Institute of Marine Science, College of William & Mary, P.O. Box 1346, Gloucester Point, VA 23062, USA 2Department of Marine Sciences, University of Connecticut, Groton, CT 06340, USA
3The Royal Netherlands Institute for Sea Research (NIOZ), Yerseke, the Netherlands 4Valdosta State University, Valdosta, GA 31698, USA
*current address: University of Texas Marine Science Institute, 750 Channel View Dr., Port Aransas, TX 78373, USA
Correspondence to: A. K. Hardison ([email protected])
Received: 7 January 2013 – Published in Biogeosciences Discuss.: 15 February 2013 Revised: 30 May 2013 – Accepted: 19 June 2013 – Published: 20 August 2013
Abstract. Microphytobenthos and benthic macroalgae play an important role in system metabolism within shallow coastal bays. However, their independent and interactive in-fluences on sediment organic matter (SOM) are not well understood. We investigated the influence of macroalgae and microphytobenthos on SOM quantity and quality in an experimental mesocosm system using bulk and molecular level (total hydrolyzable amino acids, THAA; phospholipid linked fatty acids, PLFA; pigment) analyses. Our experiment used an incomplete factorial design made up of two fac-tors, each with two levels: (1) light (ambient vs. dark) and (2) macroalgae (presence vs. absence of live macroalgae). Over the course of the 42-day experiment, total organic car-bon (TOC) and total nitrogen (TN) increased under ambi-ent light by 173±14 and 141±7 %, respectively, compared to in the dark (78±29 and 39±22 %). THAA comprised a substantial fraction of SOM (∼16 % of TOC, 35 % of TN) and followed TOC and TN accumulation patterns. Mole per-cent composition of the THAA pool indicated that SOM was composed of more labile organic material (e.g., L-glutamic acid, phenylalanine) under ambient light conditions while SOM in dark treatments was more degraded, with higher proportions of glycine and D-alanine. PLFA content, which represents viable biomass, made up∼1 % of TOC and con-tained high levels of algal fatty acids in the light, particu-larly PLFA derived from diatoms. In the presence of micro-phytobenthos (i.e., light and macroalgae treatments), SOM lability increased, resulting in the observed increases in bac-terial PLFA concentrations. Macroalgae, which were added
to half of the light treatments, decreased SOM accumula-tion compared to light treatments without macroalgae, with TOC and TN increasing by only 130±32 and 94±24 %, respectively. This decrease likely resulted from shading by macroalgae, which reduced production of microphytoben-thos. The presence of macroalgae decreased SOM lability as well, which resulted in diminished buildup of bacterial biomass. By the final day of the experiment, principal com-ponent analysis revealed that sediment composition in treat-ments with macroalgae was more similar to dark treattreat-ments and less similar to light treatments without macroalgae. Overall, microphytobenthos and benthic macroalgae funda-mentally altered SOM quality and quantity, which may have notable ecological consequences for shallow-water systems such as increased hypoxia/anoxia, sulfide accumulation, en-hanced mineralization and/or stimulated denitrification.
1 Introduction
benthic autotrophs often are the dominant primary produc-ers. Observations from a number of systems have shown that as nutrient loading increases, ephemeral macroalgae, phytoplankton, and epiphytes increase, while slow-growing perennial macrophytes such as seagrasses decrease (Valiela et al., 1992; Hauxwell et al., 2001; Duarte, 1995; Sand-Jensen and Borum, 1991). In Waquoit Bay, MA, for exam-ple, ephemeral populations of green (Cladophora) and red (Gracilaria) macroalgae replaced Zostera marina seagrass when nutrient loadings increased six-fold (Hauxwell et al., 2003). The mechanisms underlying this shift in community structure relate to differences among plant types in nutrient uptake and growth strategies (Sand-Jensen and Borum, 1991; Nielsen et al., 1996). Microphytobenthos, including ben-thic microalgae (e.g., diatoms) and cyanobacteria, often con-tribute significantly to primary production within these shal-low systems; however, their response as the autotrophic com-munity structure shifts in the face of nutrient over-enrichment is not well understood.
The dominant plants in a community greatly affect both the physical and biological conditions of a system, includ-ing overall community structure (Orth et al., 1984; Heck et al., 2003; Norkko, 1998), ecosystem processes such as nu-trient cycling (Tyler et al., 2001; Risgaard-Petersen, 2003), and hydrodynamic conditions (Fonseca and Calahan, 1992; Jumars et al., 2001; Paterson and Black, 1999). For exam-ple, the presence of ephemeral macroalgae often leads to episodic anoxia and increased sulfide concentrations (Sfriso et al., 1992; Krause-Jensen et al., 1999), which negatively affect fish and benthic fauna (Norkko et al., 2000; Raf-faelli et al., 1998; Gray et al., 2002) as well as other au-totrophs (Hauxwell et al., 2003; Sundback and McGlath-ery, 2005). Macroalgae also affect other primary producers directly through shading and/or competition for nutrients. Because of their location at the sediment surface or float-ing just above the sediments, macroalgae may reduce the amount of light available for microphytobenthos, thereby de-creasing or inhibiting microphytobenthic production (Sund-back and McGlathery, 2005; Tyler et al., 2003; Valiela et al., 1997). However, some microphytobenthic communities show evidence of photo-acclimation to low-light environ-ments and are not affected by shading by overlying macroal-gal mats (Sundback and McGlathery, 2005; Sundback et al., 1996). In addition to their effects on light, macroalgae may out-compete microphytobenthos for water column nutrients, particularly when microphytobenthos are nutrient limited, which may occur in sandy sediments during warm months (Nilsson et al., 1991; Sundback and McGlathery, 2005).
Shifts in plant community structure have also been linked to changes in sediment composition (Benoy and Kalff, 1999; Kenworthy et al., 1982), which in turn affect ecosystem ser-vices like nutrient cycling and secondary production. Macro-phyte canopies, for example, enhance accumulation of fine, organic-rich particles compared with unvegetated sediments (Benoy and Kalff, 1999; Gacia et al., 2002). Sediment
or-ganic matter (SOM) consists of material from a variety of living and non-living sources and performs important ecosys-tem functions such as providing food for infauna and epi-fauna, aiding in sediment stability (e.g., extracellular poly-meric substances produced by benthic microalgae; Wolfstein et al., 2002), and providing temporary or permanent storage for carbon (C) and nutrients (Hardison et al., 2011b; Middel-burg et al., 2000). While sources contributing to SOM vary by system, microbial biomass often contributes a significant fraction of SOM in shallow systems (Volkman et al., 2008; Canuel and Martens, 1993; Bouillon and Boschker, 2006). Specifically, microphytobenthos may be a particularly good source of labile organic matter, which may support bacte-rial production (Volkman et al., 2008; Hardison et al., 2011b; Middelburg et al., 2000).
The objectives of this study were to examine the influ-ence of microphytobenthos on SOM quality and quantity, and to investigate how the microphytobenthic contribution to SOM changes in the presence of a macroalgal bloom. Be-cause gross measurements of SOM (e.g., total organic C, to-tal nitrogen (N)) do not provide information on source and/or lability, we combined bulk and molecular-level analyses to more accurately characterize the SOM of a shallow coastal bay. Specific organic compounds (biomarkers) were used to attribute organic matter to different sources.
2 Methods
2.1 Site description
Sediments and macroalgae were collected from Hog Island Bay, Virginia (HIB), which is located along the Delmarva Peninsula and part of the Virginia Coast Reserve, a Long-Term Ecological Research (LTER) site. HIB is a shallow coastal lagoon (<2 m deep at mean low water), typical of temperate lagoons along the US east coast, and is dominated by benthic autotrophs (McGlathery et al., 2001; Thomsen et al., 2006). We collected sediments and macroalgae from mid-lagoon sites where localized blooms of macroalgae have previously developed during warmer months (McGlathery et al., 2001; Thomsen et al., 2006). Throughout the rest of the year when macroalgae are less abundant, microphytobenthos dominate (McGlathery et al., 2001; Anderson et al., 2003). Additional details about the study system and complemen-tary data from a companion stable isotope tracer study can be found in Hardison et al. (2011b).
2.2 Experimental design
atmospheric deposition) and/or PW (e.g., groundwater and sediment remineralization), it was important for our study, which focused on the community living at the sediment– water interface, to include nutrients from both sources. Dis-cussion of the design and testing of the perfusionator can be found in Hardison et al. (2011a). The perfusionator consisted of a 60 cm I.D.×60 cm height translucent fiberglass cylinder that included a reservoir for PW at the base of the sediment column. Twelve mesocosms were filled to a depth of∼15 cm with intact sediments extruded from cores collected from a mid-lagoon field site in May 2007. At the ESL, the meso-cosms were placed in shallow water baths under shade cloth (30 % light attenuation) to control temperature and light. The water column above the sediments was stirred continuously with a mini-jet pump to keep the water column well mixed.
Nutrient-amended feed water was delivered to each per-fusionator simultaneously via the SW and PW. We continu-ously added N throughout the experiment so that N would not limit primary production, but concentrations remained within ambient N levels since this was not meant to be a N addition study. Feed water was drawn from a creek adjacent to the ESL, pumped through a series of sand, bag (10 µm), cartridge (5 and 1 µm), and ultraviolet filters, and amended using a high-precision metering pump with (NH4)2SO4in a
mixing chamber before delivery to each perfusionator. NH+4 was added at a rate to achieve a concentration of 25 µM above background levels (2–4 µM) in mesocosm SW and with mini-mal change to PW background levels (200–300 µM). SW ad-ditions were delivered gravimetrically directly to the perfu-sionator water column at a rate of∼43 L day−1, or a SW residence time of ∼2 days. PW additions were delivered gravimetrically through a standpipe into the perfusionator reservoir located below the sediment column at a rate of ∼15 L day−1, or a porewater residence time of∼1.8 days. Fine scale control of the SW and PW flow rates into each perfusionator was achieved using intravenous (IV) drippers, which were calibrated daily.
The experiment consisted of an incomplete factorial de-sign made up of two factors, each with two levels: (1) light (ambient vs. dark) and (2) macroalgae (presence vs. ab-sence of live macroalgae). All factors were crossed with the exception of the dark + macroalgae treatment; in order to maintain living (and growing) macroalgae, macroalgae were only added to light treatments. Each treatment was repli-cated (n=4). Once connected to the experimental system, the mesocosms equilibrated for two weeks before beginning the experiment. During this period, the dark and light treat-ments were established, but macroalgae and nutrients were not added until the experiment began.
Macroalgae (Gracilaria vermiculophylla) were collected live from HIB in May 2007 and returned to the laboratory where they were cleaned of epiphytes and epifauna, rinsed with 0.7 µm filtered seawater, and placed in aquaria inside a greenhouse until needed. Live macroalgae were added to half of the light treatments in densities observed naturally
(124.8±1.6 gdw m−2; McGlathery et al., 2001; Hardison et
al., 2010; Thomsen et al., 2006).
2.3 Sampling
Nutrient and macroalgal additions began on Day 0. The mesocosms were sampled prior to the additions to capture baseline conditions, and on Days 1, 3, 7, 14, 16, 21, 29 and 42. At each sampling, surface sediments (0–1 cm) were col-lected using two acrylic cores (5.7 cm I.D.) and reserved for bulk (total organic C (TOC), total N (TN)), amino acid, and fatty acid analyses. Sediments from both cores were com-bined in pre-combusted glass jars, immediately frozen at −20◦C, and frozen at −80◦C within 3 days. The remain-ing sediment in the cores was placed carefully back into the holes in the mesocosm sediments. Sediments (0–1 cm) were also collected for chlorophylla concentrations using a cut-off syringe (1.1 cm I.D.), placed into 15 mL centrifuge tubes, immediately frozen at−20◦C, and analyzed within 1 month. Additional sediments (0–0.3 cm) were also collected for de-tailed pigment analysis using a cut-off syringe (1.1 cm I.D.) on a subset of the sampling days. A different region of the sediment surface was sampled each day to avoid artifacts as-sociated with re-sampling.
Macroalgae were removed from each mesocosm, patted dry, and weighed for determination of biomass on Days 7, 14, 21, 29, and 42. Wet mass was converted to dry mass us-ing percent water estimates (72 %) from G. vermiculophylla collected in the field, and dry mass values were normalized to the mesocosm sediment surface area (0.29 m2).
2.4 Bulk analyses
For bulk sediment TOC and TN measurements, sediments were freeze-dried, ground and homogenized, acidified to re-move inorganic C (Hedges and Stern, 1984) and analyzed using a Costech ECS 4010 elemental analyzer. Samples were analyzed for benthic chlorophyllaconcentrations according to a modification of the method of Lorenzen (1967; Pinck-ney et al., 1994). The sediment pellet was sonicated in 90 % acetone, vortexed and extracted for 24 h at−20◦C. The su-pernatant was passed through a 0.45 µm CR-PTFE syringe filter and read on a Shimadzu UV-1601 UV Visible spec-trophotometer (λ= 665, 750 nm). Chlorophylla concentra-tions (mg m−2)were calculated according to the equations in Lorenzen (1967). An additional set of samples was later used for detailed pigment analyses (see Sect. 2.7, below).
2.5 Total hydrolyzable amino acids
cation exchange chromatography, amino acids were deriva-tized with isopropanol and pentafluoropropionic anhydride and further purified by solvent extraction. Concentrations of the derivatized D- and L-amino acids were measured by gas chromatography combustion isotope ratio mass spectrometry (IRMS) on a HP 6890 GC with a Thermo type III combustion interface and a Thermo Delta Plus IRMS. The sum of con-centrations of all amino acids analyzed will be referred to as total hydrolyzable amino acids (THAA). The HAAs ana-lyzed and their major organic matter sources are presented in Table 1.
2.6 Phospholipid linked fatty acids
Total fatty acids were analyzed on a subset of the sediment samples according to a modified Bligh and Dyer (1959) method (Canuel et al., 2007; Poerschmann and Carlson, 2006). Wet sediments (∼12 g) were extracted using an accel-erated solvent extractor system (Dionex ASE 200) adapted for in-cell silica gel chromatography. Each sample was ex-tracted twice on the ASE: neutral lipids were collected fol-lowing extraction with a 9:1 (v:v) hexane : acetone mix-ture at 50◦C, then polar lipids were collected following ex-traction with a 8:2 (v:v) methanol : chloroform solution at 80◦C. Polar lipid fractions were saponified using KOH-CH3OH for 2 h at 110◦C. Saponified samples were then
ex-tracted under basic and acidic conditions. The acid-exex-tracted fractions were methylated with BF3-CH3OH to form fatty
acid methyl esters (FAMEs). The polar FAMEs represented the phospholipid-linked fatty acids (PLFAs). FAME concen-trations were measured by gas chromatography with flame ionization detection (GC-FID, DB-5 column, HP 5890) and quantified using methyl heneicosanoate as an internal stan-dard. Peak identities were verified using reference standards as well as coupled gas chromatography mass spectrome-try using a mass selective detector operated in electron im-pact mode (HP 6890, GC-MSD). Fatty acids are designated A:BωC, where A is the total number of carbon atoms, B is the number of double bonds, and C is the position of the first double bond from the aliphatic “ω” end of the molecule. The prefixes “i” and “a” refer to iso- and anteiso-methyl branched fatty acids (see Canuel et al., 1997 and references therein). The PLFAs analyzed and their major organic matter sources are presented in Table 1.
2.7 Pigments
Additional photosynthetic pigments (chlorophylls and carotenoids) were measured on a subset of the samples us-ing a high performance liquid chromatography (HPLC) sys-tem following the methods of Leavitt and Hodgson (2001) designed specifically for sedimentary pigments. Surface sed-iment samples were extracted with a solvent mixture of ace-tone, methanol and water mixed in an 80:15:5 ratio, which contained an internal standard (Sudan II; Sigma Chemical
Corp., St. Louis, MO) and allowed to extract 16–24 h in a−20◦C freezer. Following extraction, samples were cen-trifuged and filtered through a 0.22 µm nylon syringe filters (Millex) to remove particulate matter. Samples were placed in an autosampler tray where they were mixed with an ion-pairing agent (0.75 g tetrabutyl ammonium acetate and 7.7 g ammonium acetate in 100 mL HPLC-grade water) prior to injection. 150 µL of sample extract and 50 µL of ion-pairing agent were injected into a Shimadzu HPLC system following the mobile phase and time sequence of Leavitt and Hodg-son (2001). Chlorophyll and carotenoid pigments were sep-arated chromatographically using a Rainin Model 200 Mi-crosorb C18 column and measured using a photodiode
ar-ray detector. Pigment identification was made using reten-tion times of known standards (DHI Lab Products, Denmark) and pigment-specific spectra recorded by the detector. Pig-ment concentrations are expressed as nmol pigPig-ment gdw−1
and calculated by comparing peak areas against standards of known concentration. The pigments analyzed and their major algal sources are presented in Table 1.
2.8 Data analysis
We applied repeated measures analysis of variance (ANOVA) to examine the effects of light (ambient vs. dark), macroalgae (presence vs. absence) and time (day) on the sediment parameters using the Mixed procedure in SAS 9.1 (SAS Institute Inc., Cary, NC). In all models, a compound symmetry error structure was used to model the within-subject covariance structure. Individual HAA were analyzed on a mole percent abundance basis while individual PLFA and pigments were analyzed using concentration data. Re-sults presented here use Type III sum of squares from the ANOVA model. Unless otherwise noted, values presented are means±1 SE for 4 replicates.
Table 1. Specific biomarkers, abbreviations, and major organic matter sources used in this study. “Abbrev.” = abbreviation.
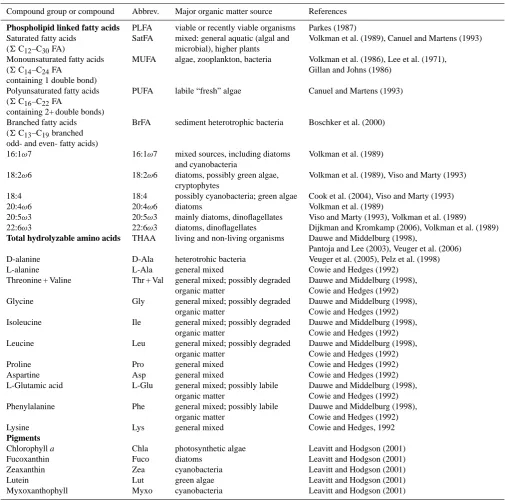
Compound group or compound Abbrev. Major organic matter source References
Phospholipid linked fatty acids PLFA viable or recently viable organisms Parkes (1987)
Saturated fatty acids SatFA mixed: general aquatic (algal and Volkman et al. (1989), Canuel and Martens (1993) (6C12–C30FA) microbial), higher plants
Monounsaturated fatty acids MUFA algae, zooplankton, bacteria Volkman et al. (1986), Lee et al. (1971),
(6C14–C24FA Gillan and Johns (1986)
containing 1 double bond)
Polyunsaturated fatty acids PUFA labile “fresh” algae Canuel and Martens (1993) (6C16–C22FA
containing 2+ double bonds)
Branched fatty acids BrFA sediment heterotrophic bacteria Boschker et al. (2000) (6C13–C19branched
odd- and even- fatty acids)
16:1ω7 16:1ω7 mixed sources, including diatoms Volkman et al. (1989) and cyanobacteria
18:2ω6 18:2ω6 diatoms, possibly green algae, Volkman et al. (1989), Viso and Marty (1993) cryptophytes
18:4 18:4 possibly cyanobacteria; green algae Cook et al. (2004), Viso and Marty (1993)
20:4ω6 20:4ω6 diatoms Volkman et al. (1989)
20:5ω3 20:5ω3 mainly diatoms, dinoflagellates Viso and Marty (1993), Volkman et al. (1989) 22:6ω3 22:6ω3 diatoms, dinoflagellates Dijkman and Kromkamp (2006), Volkman et al. (1989) Total hydrolyzable amino acids THAA living and non-living organisms Dauwe and Middelburg (1998),
Pantoja and Lee (2003), Veuger et al. (2006) D-alanine D-Ala heterotrohic bacteria Veuger et al. (2005), Pelz et al. (1998)
L-alanine L-Ala general mixed Cowie and Hedges (1992)
Threonine + Valine Thr + Val general mixed; possibly degraded Dauwe and Middelburg (1998), organic matter Cowie and Hedges (1992) Glycine Gly general mixed; possibly degraded Dauwe and Middelburg (1998),
organic matter Cowie and Hedges (1992) Isoleucine Ile general mixed; possibly degraded Dauwe and Middelburg (1998),
organic matter Cowie and Hedges (1992) Leucine Leu general mixed; possibly degraded Dauwe and Middelburg (1998),
organic matter Cowie and Hedges (1992)
Proline Pro general mixed Cowie and Hedges (1992)
Aspartine Asp general mixed Cowie and Hedges (1992)
L-Glutamic acid L-Glu general mixed; possibly labile Dauwe and Middelburg (1998), organic matter Cowie and Hedges (1992) Phenylalanine Phe general mixed; possibly labile Dauwe and Middelburg (1998),
organic matter Cowie and Hedges (1992)
Lysine Lys general mixed Cowie and Hedges, 1992
Pigments
Chlorophylla Chla photosynthetic algae Leavitt and Hodgson (2001)
Fucoxanthin Fuco diatoms Leavitt and Hodgson (2001)
Zeaxanthin Zea cyanobacteria Leavitt and Hodgson (2001)
Lutein Lut green algae Leavitt and Hodgson (2001)
Myxoxanthophyll Myxo cyanobacteria Leavitt and Hodgson (2001)
PCA scores describe the relationships between the PC and the treatments.
3 Results
3.1 Experimental conditions
Temperature and salinity in the mesocosm water columns were similar among treatments and to the field site (Table 2).
Macroalgae in the mesocosms grew steadily from 125±1 to 410±102 gdw m−2, which was within the range observed
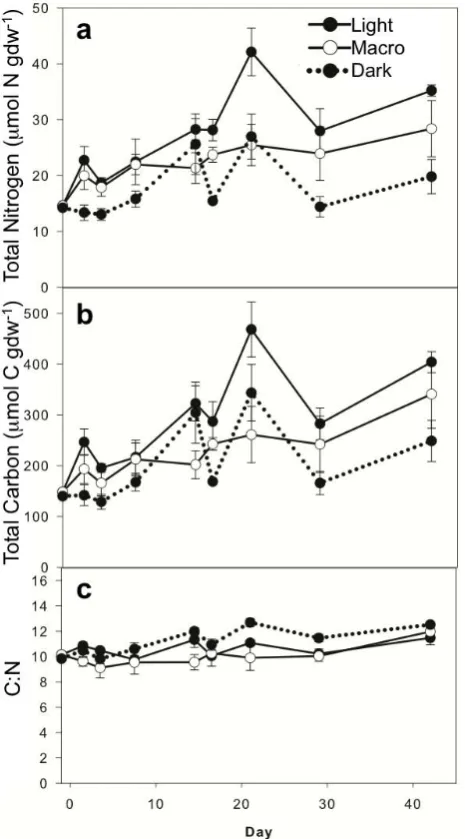
Fig. 1. Macroalgal biomass (a) and benthic chlorophylla concen-trations for surface (0–1 cm) sediments (b). Treatments shown are light with macroalgae (“Macro”; solid lines, filled symbols), light without macroalgae (“Light”; solid lines, open symbols), and dark without macroalgae (“Dark”; dotted lines with filled symbols). Val-ues are mean±SE (n=4).
3.2 Bulk sediments
Surface sediment TN and TOC concentrations followed similar patterns throughout the experiment (Fig. 2a and b; Supplement Table 1) and were highly correlated with one another (r=0.96, 0.95 and 0.98 for Light, Macro, and Dark treatments, respectively). TN for all samples be-gan at ∼14 µmol N gdw−1 and increased throughout the
experiment, reaching levels (mean±SE) of 35.2±1.0, 28.4±5.0, and 19.8±3.1 µmol N gdw−1 on Day 42 for Light, Macro, and Dark treatments, respectively. TOC in-creased from∼144 µmol C gdw−1on Day 0 to 404.0±20.6, 340.7±67.0, and 248.6±40.2 µmol C gdw−1 for Light, Macro, and Dark treatments, respectively, on Day 42. For the Light and Dark treatments, the increases for TN and TOC
Fig. 2. Total nitrogen (a) and total organic carbon (b) concentrations and C : N (c) in surface (0–1 cm) sediments. Values are mean±SE (n=4).
were not monotonic, and both peaked on Day 21 (Fig. 2a and b). Both TN and TOC showed significant light, macroalgae, and time effects (Table 3). Light treatments had the highest TN and TOC concentrations; Dark had the lowest concentra-tions, and concentrations in Macro were intermediate. C : N ratios remained relatively constant over time (10.7±0.2) and displayed no significant light or macroalgae effects (Fig. 2c; Table 3).
[image:6.595.313.546.64.484.2]Table 2. Parameters measured concurrently at Hog Island Bay field sites and in mesocosms. Field samples were collected from a mid-lagoon site on three dates while the mesocosm experiment was being conducted. Mesocosm values are means of daily means across all time steps. Values are presented as the mean (SE) for field (n=5) and mesocosm treatments (n=9).
Parameter Field Light Macro Dark
Temperature (◦C) 24.1 (1.6) 23.6 (2.9) 23.9 (2.9) 23.7 (2.8) Salinity (psu) 31.4 (0.6) 31.6 (1.3) 31.5 (1.3) 31.0 (1.0) Macroalgal density (gdw m−2) 59.2 (30.7) n/a 278.6 (31.4) n/a
range (gdw m−2) 0–355 n/a 124–513 n/a
Benthic chlorophylla(mg m−2) 24.9 (7.1) 74.1 (9.7) 59.5 (7.2) 11.9 (1.6) Sediment TOC (µmol C gdw−1) 185.4 (32.3) 302.9 (23.3) 232.6 (15.3) 208.6 (21.1) Sediment TN (µmol N gdw−1) 22.3 (3.1) 28.2 (1.9) 22.8 (1.0) 18.1 (1.5)
remained unchanged, with a mean across all samples of 11.9±4.1 mg m−2. Light was significantly higher than Dark (Table 3). We were unable to detect statistically significant differences between Macro and Light treatments due to high variability between mesocosms within a treatment.
3.3 Total Hydrolyzable Amino Acids (THAA)
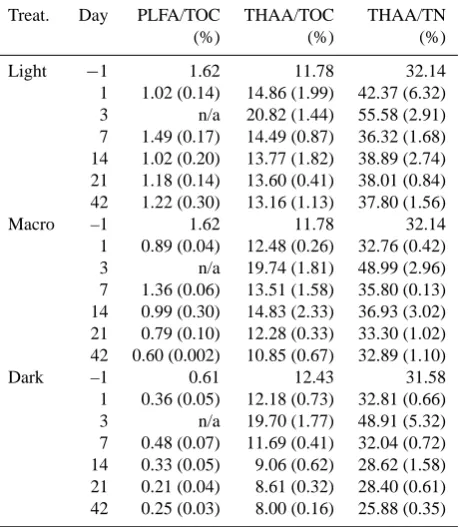
THAA concentrations (Fig. 3a) showed similar patterns to sediment TOC and TN content (Fig. 2a and b; Supplement Table 1). Concentrations for all treatments increased from ∼4 µmol AA gdw−1 on Day 0 to 14±1.3, 8.4±1.1, and 6.8±1.1 µmol AA gdw−1on Day 21 for Light, Macro, and Dark treatments, respectively, and then concentrations re-mained steady through Day 42. Light treatment had the high-est concentrations, Dark had the lowhigh-est, and concentrations in Macro were intermediate (Fig. 3a). THAA-C made up ap-proximately∼14 % of TOC for both light (Light and Macro) treatments and 12 % of TOC for Dark treatment, and THAA-N made up approximately 39 and 33 % of TTHAA-N for Light and Dark treatments, respectively (Table 4).
[image:7.595.312.546.222.548.2]Concentrations of four selected individual amino acids are presented as mole percentages in Fig. 4; however, data for all 11 amino acids analyzed are presented in Supplemental Table 2, and abbreviations are provided in Table 1. Across all treatments, Gly was the most abundant amino acid, making up approximately 25 % of THAA, followed by L-Ala and Asp, L-Glu, Pro, Thr + Val, Leu, Lys, Ile and Phe, and D-Ala. Most amino acids showed a significant light effect, with the exception of L-Glu, Pro, and Phe (Table 3). Mole percentages of Leu, L-Ala, Thr + Val, Ile, and Lys were higher for Light than Dark, while Gly, D-Ala and Asp were higher in the Dark (Fig. 4a–d; Supplemental Table 2). The only amino acid to display a significant macroalgae effect was Lys, for which mole percentages were higher in Light treatments (Fig. 4b; Table 3).
3.4 Phospholipid linked fatty acids (PLFA)
PLFA concentrations (Fig. 3b) followed patterns similar to those of sediment TOC, TN, and THAA content (Figs. 2a, b
Fig. 3. THAA (a) and total PLFA (b) concentrations in surface (0– 1 cm) sediments. Values are mean±SE (n=4).
Table 3. Results of two-factor repeated measures ANOVA, which was used to test for differences in light and macroalgae over time for various sediment organic matter variables. Significantpvalues (<0.05) are indicated in bold.
Light Macroalgae Time
df F p df F p df F p
TN 9 31.97 0.0003 9 8.73 0.0161 61 9.24 <0.0001
TOC 9 13.5 0.0051 9 7.61 0.0222 61 12.39 <0.0001
C : N 9 2.35 0.1598 9 2.77 0.1302 61 6.02 <0.0001
Chla 9 27.65 0.0005 9 0.83 0.3849 61 0.43 0.8325
THAA 8 29.94 0.0006 8 6.25 0.0369 38 4.57 0.0020
% THAA/TN 8 21.59 0.0017 8 4.62 0.0638 38 20.45 <0.0001
% THAA/TOC 8 12.83 0.0072 8 0.71 0.4249 38 24.76 <0.0001
% GLY 8 13.31 0.0065 8 0.07 0.7947 38 2.19 0.0759
% LGLU 8 0.05 0.8316 8 0.04 0.8561 38 1.95 0.1093
% LEU 8 113.11 <0.0001 8 0.08 0.7868 38 4.48 0.0026
% DALA 8 41.44 0.0002 8 0.3 0.6000 38 2.45 0.0508
% LALA 8 6.45 0.0347 8 0.19 0.6736 38 5.03 0.0012
% THR + VAL 8 8.4 0.0199 8 0.33 0.579 38 2.55 0.0438
% ILE 8 36.36 0.0003 8 0.71 0.425 38 8.29 <0.0001
% PRO 8 0.37 0.5583 8 2.64 0.1428 38 2.02 0.0975
% ASP 8 7.94 0.0226 8 3.13 0.1148 38 5.67 0.0005
% PHE 8 0.01 0.9235 8 0.06 0.8177 38 0.58 0.7173
% LYS 8 12 0.0085 8 10.17 0.0128 38 1.83 0.1312
PLFA 9 209.95 <0.0001 9 54.28 <0.0001 34 1.85 0.1424
% PLFA/TOC 9 65.84 <0.0001 9 5.18 0.0489 34 3.98 0.0094
SatFA 9 98.43 <0.0001 9 23.01 0.001 34 1.15 0.3552
MUFA 9 202.87 <0.0001 9 46.09 <0.0001 34 1.72 0.1559
PUFA 9 59.19 <0.0001 9 19.17 0.0018 34 1.24 0.3121
BrFA 9 17.01 0.0026 9 3.75 0.0848 34 5.37 0.0010
16:1ω7 9 36.25 0.0002 9 6.07 0.0359 34 1.59 0.1882
18:2ω6 9 19.03 0.0018 9 3.02 0.1162 34 3.11 0.0204
18:4 9 23.47 0.0009 9 7.66 0.0218 34 0.73 0.6094
20:4ω6 9 14.34 0.0043 9 6.32 0.0331 34 1.33 0.2753
20:5ω3 9 109.42 <0.0001 9 27.53 0.0005 34 1.97 0.1088
22:6ω3 9 47.14 <0.0001 9 12.12 0.0069 34 2.25 0.072
20:5/18:2 9 27.52 0.0005 9 1.99 0.1916 34 7.35 <0.0001
fuco 9 22.44 0.0011 9 1.05 0.3318 25 1.01 0.4052
zea + lut 9 2.07 0.1843 9 0.41 0.5361 25 2.18 0.1161
myxo 9 4.79 0.0564 9 0.01 0.9174 25 4.53 0.0114
fuco/(zea + lut) 9 13.85 0.0048 9 0.59 0.4622 25 4.42 0.0126
over time. By Day 42, Light had the highest PLFA-C levels, at 1.2±0.3 % of TOC, while Macro ended with PLFA-C lev-els of 0.6±0.002 % of TOC.
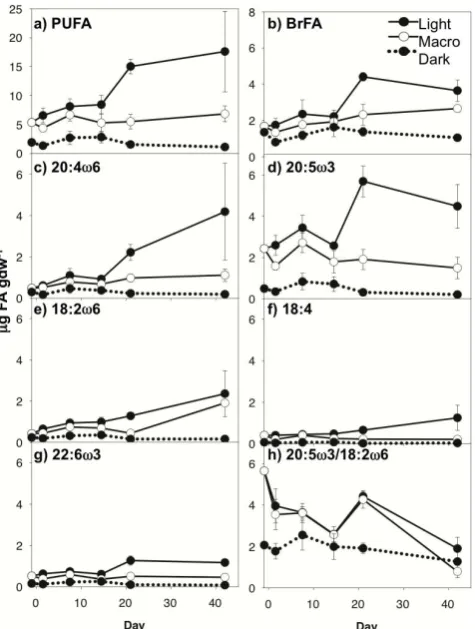
Concentrations of two selected groups and five individual PLFA are presented in Fig. 5; however, data for all PLFA analyzed are presented in Supplement Table 3. Abbrevia-tions and sources are provided in Table 1, and treatment ef-fects are shown in Table 3. Groups of PLFA representing al-gal and heterotrophic bacteria sources showed the same con-centration patterns over time as total PLFA (Figs. 5a, b and 3b). Saturated fatty acids (SatFA; non-specific source) were the most abundant group, making up∼50 % of total PLFA, followed generally by monounsaturated fatty acids (MUFA;
non-specific source; ∼30 %), polyunsaturated fatty acids (PUFA; algal; 15 %), and branched fatty acids (BrFA; het-erotrophic bacteria;∼5 %). PUFA and BrFA are displayed (Fig. 5a and b); however, SatFA and MUFA followed simi-lar patterns (Supplement Table 3). All PLFA groups showed a significant light effect, with concentrations in Light treat-ments exceeding Dark treattreat-ments (Table 3). In addition, all groups except BrFA showed a significant macroalgae ef-fect, with higher concentrations in the Light treatment than Macro.
Fig. 4. Composition as mole percent of THAA for select HAA in surface (0–1 cm) sediments: (a) glycine, (b) lysine, (c) D-alanine, and (d) leucine. Note scale differences between graphs. Values are mean±SE (n=4).
Table 4. The proportion (%) of PLFA/TOC, THAA/TOC and THAA/TN in sediments. Values are mean (SE).n=4 for all except Day−1 (n=1). “Treat.” = treatment.
Treat. Day PLFA/TOC THAA/TOC THAA/TN
(%) (%) (%)
Light −1 1.62 11.78 32.14
1 1.02 (0.14) 14.86 (1.99) 42.37 (6.32) 3 n/a 20.82 (1.44) 55.58 (2.91) 7 1.49 (0.17) 14.49 (0.87) 36.32 (1.68) 14 1.02 (0.20) 13.77 (1.82) 38.89 (2.74) 21 1.18 (0.14) 13.60 (0.41) 38.01 (0.84) 42 1.22 (0.30) 13.16 (1.13) 37.80 (1.56)
Macro –1 1.62 11.78 32.14
1 0.89 (0.04) 12.48 (0.26) 32.76 (0.42) 3 n/a 19.74 (1.81) 48.99 (2.96) 7 1.36 (0.06) 13.51 (1.58) 35.80 (0.13) 14 0.99 (0.30) 14.83 (2.33) 36.93 (3.02) 21 0.79 (0.10) 12.28 (0.33) 33.30 (1.02) 42 0.60 (0.002) 10.85 (0.67) 32.89 (1.10)
Dark –1 0.61 12.43 31.58
1 0.36 (0.05) 12.18 (0.73) 32.81 (0.66) 3 n/a 19.70 (1.77) 48.91 (5.32) 7 0.48 (0.07) 11.69 (0.41) 32.04 (0.72) 14 0.33 (0.05) 9.06 (0.62) 28.62 (1.58) 21 0.21 (0.04) 8.61 (0.32) 28.40 (0.61) 42 0.25 (0.03) 8.00 (0.16) 25.88 (0.35)
(diatoms, possibly green algae, cryptophytes; Fig. 5e), 18:4 (possibly cyanobacteria; Fig. 5f), and 22:6ω3 (diatoms, pos-sibly dinoflagellates; Fig. 5g) followed similar patterns. All were significantly higher in the Light treatment than Dark. Among light treatments, all except 18:2ω6 were higher in the Light than in the Macro treatment. 18:2ω6 showed no significant macroalgae effect. Generally, C20 PUFA were
more abundant than C18PUFA, although their relative
abun-dances, as demonstrated by the ratios of 20:5ω3 / 18:2ω6, shifted over time (Fig. 5h). For light treatments, this ratio de-creased from 5.7 to 1.9±0.5 (Light) and 0.8±0.3 (Macro) from Day 0 to 42. BrFA, representing bacterial-specific fatty acids (Table 1), were also more concentrated in Light and Macro treatments, but showed no significant macroalgae ef-fect (Fig. 5b; Table 3).
3.5 Accessory pigments
[image:9.595.314.544.105.369.2]Fig. 5. Concentrations of select algal and bacterial PLFA in sur-face (0–1 cm) sediments. (a–g) are in units of µg FA gdw−1. (h) is unitless since it is a ratio of concentrations. Values are mean±SE (n=4).
myxoxanthophyll (myxo, cyanobacteria; Fig. 6b) were neg-ligible and showed no significant treatment effects. Zea + lut (green algae and cyanobacteria; Fig. 6c) were moderately abundant but showed no significant treatment effects. Al-though our HPLC system cannot resolve the isomers zea and lut, our analyses suggest that the peak is dominated by lut and therefore represents green algae (Leavitt and Hodgson, 2001). This is supported by a purity analysis of the peak on the HPLC chromatograms and low concen-trations of other cyanobacterial pigments (myxo). None of the pigments showed a significant macroalgae effect (Ta-ble 3). Although fuco was more abundant than zea + lut, their relative abundances, as demonstrated by the ratios of fuco/(zea + lut), shifted over time (Fig. 6d). This ratio de-creased from Day 0 to Day 42 from 21.1±3.7 to 4.2±2.1 (Light), from 21.1±7.2 to 1.5±0.2 (Macro) and from 21.1±0.6 to 0.6±0.1 (Dark).
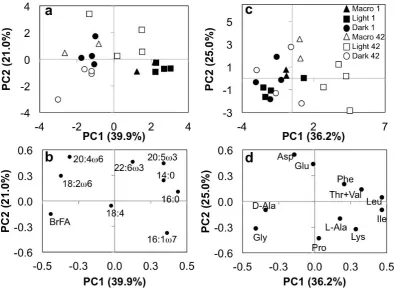
3.6 Principal components analysis (PCA)
[image:10.595.332.524.63.494.2]PCA provided a summary of changes in sediment composi-tion between treatments and over time (Day 1 vs. Day 42).
Fig. 6. Concentrations of select accessory pigments in surface (0– 0.3 cm) sediments. (a–c) are in units of nmol pigment gdw−1. (d) is unitless since it is a ratio of concentrations. Values are mean±SE (n=4).
PC1 and PC2 explained 39.9 and 21.0 % of the variance in PLFA composition, respectively (Fig. 7a and b). PLFA such as 14:0, 16:0, 20:5ω3, and 16:1ω7, which derive from a vari-ety of aquatic microbes (Table 1), had the most positive load-ings on PC1. In contrast, BrFA (bacterial sources), 18:2ω6 (microalgae), and 20:4ω6 (diatoms and other microalgae) had the most negative loadings on PC1 (Fig. 7b). BrFA and 16:1ω7 had negative loadings on PC2, while polyunsaturated FA (PUFA), typically ascribed to algal sources, had positive loadings on PC2.
Fig. 7. Score and loading results for PC1 and PC2 from PCA analyses. Scores (a) and loadings (b) for PLFA data and scores (c) and loadings (d) for HAA data are shown. Filled symbols in the score plots represent Day 1 observations and open symbols represent Day 42. Treatments are Macro (triangles), Light (squares) and Dark (circles). In (b), PLFA such as 14:0, 20:5ω3, and 16:1ω7, which derive from a variety of aquatic microbes, had the most positive loadings on PC1, while BrFA (bacterial sources) had the most negative loadings on PC1. PUFA had the most positive loadings on PC2. In (d), Leu and Ile had the most positive loadings on PC1 while loadings for Gly and D-Ala (bacteria) were the most negative. Asp and Glu had positive loadings on PC2 while Pro, Gly, and Lys had negative loadings on PC2.
(Fig. 7a). All treatments had similar scores close to the ori-gin along PC2 on Day 1. Over time (Day 42), the treatments diverged from one another and were separated to a greater extent along both PC axes. On Day 42, the light treatments (Light and Macro) had lower scores on PC1 than on Day 1. On Day 42, the treatments were also distributed along PC2, with the Dark treatment having the lowest PC2 scores and Light having the highest.
In a separate analysis of HAA, PC1 and PC2 explained 36.2 and 25.0 % of the variance in HAA composition, re-spectively (Fig. 7c and d). Mole percentages of Leu and Ile had the most positive loadings on PC1 while loadings for Gly and D-Ala (bacteria) were the most negative (Fig. 7d). Mole percentages of Asp and Glu had positive loadings on PC2 while Pro, Gly and Lys had negative loadings on PC2. Like PLFA, scores along both PC were similar among treatments on Day 1, but diverged by Day 42 (Fig. 7c). While scores for the Dark treatment remained near Day 1 values, both light treatments (Light and Macro) shifted towards more positive scores along PC1 on Day 42. The Light treatments were also separated along PC2 on Day 42: Macro scores for PC2 were higher than Light scores.
4 Discussion
Microphytobenthos and benthic macroalgae play an impor-tant role in system metabolism within shallow coastal bays. However, their independent and interactive influences on SOM are not well understood. In this study, we demonstrated that changes in autotrophic community structure (e.g., mi-crophytobenthos, ephemeral blooms of macroalgae) that of-ten result from excess nutrient loading can strongly influence SOM quality and quantity, which will ultimately affect its la-bility and turnover in the system.
4.1 Role of microphytobenthos
4.1.1 Amount and sources of SOM
SOM (TOC, TN) accumulated in the Light treatment com-pared with the Dark treatment (Fig. 2a and b). By Day 42, TOC and TN in the Light increased from baseline values by 173 and 141 %, respectively, compared to only 77 and 39 % in the Dark. These light–dark differences were clearly related to microphytobenthic biomass. Chlorophyll a con-centrations, which can be considered a proxy for microphy-tobenthic biomass, were higher in the Light treatment than in the Dark, indicating that microphytobenthic biomass was substantially higher in the Light treatments (Fig. 1b).
Similarly, light–dark differences in THAA and PLFA con-centrations also indicated that the presence of microphy-tobenthos altered SOM composition (Fig. 3a and b). By Day 42, THAA increased by 180 % relative to background levels in Light treatments compared to a 14 % increase in the Dark. Similarly, PLFA increased by 200 % from back-ground values in Light treatments and actually decreased by 27% in the Dark. Across treatments, THAA made up a sub-stantial fraction of SOM (∼30–40 % of TN and 12–20 % of TOC; Table 4), similar to the concentration range found during other studies in shallow marine systems (Veuger et al., 2006; Cook et al., 2007). THAA included both living and non-living (detrital) material because HAA have been shown to remain in sediments after cell death (Veuger et al., 2006; Dauwe and Middelburg, 1998; Pantoja and Lee, 2003). PLFA, on the other hand, made up a smaller frac-tion of TOC (∼1 %; Table 4), but represent only viable mi-crobial organic matter because PLFA turnover rapidly after cell death (Parkes, 1987). Therefore, buildup of THAA resented living biomass and detrital buildup while PLFA rep-resented living biomass buildup alone.
Analysis of the PLFA composition lent insight into the composition of the microbial community that developed in the Light and Dark treatments. Not only did PUFA, a gen-eral indicator for algal sources of organic matter, increase over time in the Light (Fig. 5a), but PLFA specific to differ-ent microalgal communities also showed differdiffer-ent patterns over time. For example, 20:5ω3, which is specific to diatoms (Table 1), was the most abundant PUFA (Fig. 5d; Supple-ment Table 3), suggesting that diatoms were the dominant algal class within the surface sediments, which is consis-tent with surveys of microalgal community composition in temperate systems (Welker et al., 2002; MacIntyre et al., 1996) as well as the pigment data from this experiment, showing fuco to be the most abundant (discussed below). 22:6ω3, which was present in lower concentrations than 20:5ω3 (Fig. 5g; Supplement Table 3), is also found in di-atoms, as well as dinoflagellates. Dinoflagellates, however, do not often contribute significantly to sediment microalgal communities (Barranguet et al., 1997). Other algae that may have been present based on PLFA abundance were green algae (18:2ω6, Fig. 5e) and possibly cyanobacteria (18:4, Fig. 5f), both of which have been shown to seasonally domi-nate microphytobenthic communities in intertidal sediments (Barranguet et al., 1997; Pinckney et al., 1995). However,
both of these C18PUFA can also be present in diatoms,
cryp-tophytes, and dinoflagellates (at trace levels). Based on PLFA data alone, we cannot determine whether green algae and/or cyanobacteria were present; however, the accessory pigment data lend additional insight into the microalgal community within the sediments. The dominant accessory pigment in the 0–0.3 cm section in the light was fuco (Fig. 6a; Supplemen-tal Table 4), which is specific to diatoms (Table 1). Myxo, the pigment specific to cyanobacteria, was present in low quantities across all treatments, suggesting that cyanobac-teria were negligible components of this system (Fig. 6b). Zea + lut, which was dominated by lutein, a pigment found in green algae, were significantly higher in the Light treat-ments, supporting the conclusion from the PLFA results that green algae were likely present in this system (Fig. 6c).
Over the course of the experiment, there may have been shifts in the algal community structure, as demonstrated by changes in the ratios of 20:5ω3 / 18:2ω6 (Fig. 5h) and fuco/(zea + lut) (Fig. 6d). Decreases in these ratios over time suggest that green algae increased relative to diatoms dur-ing the experiment. Previous work has linked changes in algal community structure with changes in nutrient limita-tion (Sommer, 1996; Pinckney et al., 1995) and temperature (Tilman et al., 1986). Neither temperature, nor N or phos-phorous availability varied over the experiment; however, changes in other nutrients (e.g., silica) may have resulted in the observed shifts in algal composition. Algal species com-positions can also change in response to top-down forces such as the feeding preferences of grazers (Duffy and Harvil-icz, 2001; Canuel et al., 2007). These shifts were not dras-tic, however. At the end of the experiment, when concentra-tions of C18 PUFA and green algal pigments were highest,
C20 PUFA and diatom pigments were still more abundant
(Figs. 5c–d and 6c–g), suggesting that diatoms remained the dominant algal class in this study.
In this experiment, we were able to quantify the contribu-tion of microphytobenthic produccontribu-tion to SOM and to char-acterize the changes in SOM quality that result from mi-crophytobenthic production. Our results are consistent with previous studies, which have investigated the influence of the amount of light, rather than the presence or absence of light, on SOM. For example, Spivak and colleagues (2007) observed increased sediment TOC and TN concentrations in an experimental seagrass system in treatments that received 69 % more light than their shaded treatments. They also ob-served increased contributions of fatty acids derived from plant and algal sources with increased light, consistent with our PLFA results.
4.1.2 Lability of SOM and response of the sediment microbial community
treatment than the Dark treatment (Fig. 2a). Since N is gen-erally the limiting element in temperate marine system, this suggests that the SOM in the light was more labile (available for decomposition) than in the dark. This may have been due to lower levels of THAA in the Dark (Fig. 3a) where THAA contributed a smaller proportion of N to TN compared with the Light treatments. On the molecular level, changes in THAA composition also indicated changes in organic mat-ter lability. The mole percentages of Leu and Ile were higher in Light whereas Gly was lower (Fig. 4a and c; Supplement Table 4). Dauwe and Middelburg (1998) developed a degra-dation index (DI) based on amino acid composition, and found that mole percentages of Gly increased and Leu and Ile decreased with increasing degradation. They suggested that selective preservation of structural compounds versus preferential breakdown of cytoplasmic (i.e., not structural) material explained the contrasting behavior of the individ-ual molecules, although more recent studies have presented alternative explanations for similar findings (e.g., Veuger et al., 2012). It was not possible in the present study to calcu-late the DI because the THAA analyzed in this study (from GC analysis) does not overlap completely with those ana-lyzed in most other studies, which are HPLC based. The fact that the Dark treatment followed the patterns predicted by the DI suggests that detrital material rather than newly pro-duced biomass (e.g., by microphytobenthos and bacteria in the Light treatment) was the dominant source of SOM in the Dark treatment. Increases in total THAA and PLFA concen-trations are also consistent with increased organic matter la-bility in the Light. The general susceptila-bility of N-containing amino acids to microbial mineralization and high contribu-tions of THAA to SOM make remineralization of THAA a potentially major source of inorganic N in sediments (Pantoja and Lee, 2003). Similarly, fatty acids, particularly PUFA, are considered labile and make up an important component of energy flow in benthic food webs (Sun et al., 1997; Canuel et al., 1995; Canuel and Martens, 1996).
These changes in SOM quantity and quality in turn further shaped the sediment microbial community. The presence of labile SOM increased bacterial biomass in the Light treat-ment compared to the Dark treattreat-ment by providing more sub-strate for bacteria. Bacterial-specific PLFA concentrations were higher in the Light (Fig. 5b), suggesting buildup of het-erotrophic bacterial biomass within the sediments. Bacterial PLFA increased in the Dark treatments for the first two weeks of the experiment, but then decreased for the remainder of the experiment, ending on Day 42 with PLFA concentrations be-low initial values. This suggests that bacteria used up avail-able labile organic matter in the Dark treatments by Day 14. This may have been exacerbated by the fact that the Dark treatment was maintained in the dark for two weeks prior to the start of the experiment. Previous studies have sug-gested that bacterial and microphytobenthic activities may be coupled in a number of ways. First, bacteria can directly decompose detrital microphytobenthic material, as has been
observed in numerous studies (Cook et al., 2007; Hardison et al., 2011b; Veuger et al., 2007). Thus, microphytobenthic detritus may serve both as a substrate for heterotrophy and as a source of remineralized N and phosphorus, which may be limited. Second, benthic microalgae, particularly diatoms, excrete extracellular polymeric substances (EPS) that aid in sediment stability and/or motility (Smith and Underwood, 1998; Welker et al., 2002; Taylor and Paterson, 1998), and may also serve as a substrate for bacteria (Middelburg et al., 2000; Hardison et al., 2011b; Evrard et al., 2008; Goto et al., 2001). Lack of bacterial biomass buildup in the Dark treat-ments, in the absence of photosynthesizing microphytoben-thos, suggests that organic matter substrate became limiting after the initial pool of labile organic matter in the sediments was exhausted.
We have additional evidence from a companion benthic flux study suggesting that the autotrophic process of nitri-fication may have occurred in the Dark (Anderson, unpub-lished). Results from our flux study showed strong uptake of NH+4 into the sediments with almost equal release of NO−3, with an estimated C fixation that was comparable to the mea-sured increased sediment TOC in the Dark (data not shown). It is also possible that the increased TOC and TN in the Dark was driven by bacterial use of water column DOC and DON, as has been observed in the literature (e.g., Maher and Eyre, 2010, 2011). Although there may have been buildup of TOC and TN in the Dark as a result of any of these mechanisms, overall, TOC and TN in the Light increased relative to base-line values by a much larger percentage compared to in the Dark.
Overall, microphytobenthos fundamentally altered SOM composition in our mesocosm experiment. They produced labile organic matter that supported an active heterotrophic bacterial community and increased the TOC and TN content of the sediments. We likely observed higher microphytoben-thic and bacterial abundances in the mesocosms relative to the field because the mesocosm system removed some pdation pressure and reduced physical processes such as re-suspension and advection. However, the mesocosm experi-mental system also provided a tremendous opportunity since it is impossible to separate the effects of microphytobenthos from other processes in the field. Since our objective was to compare treatments and assess the differences due to the presence of microphytobenthos, we present these changes as estimates of the potential influence of microphytobenthos on SOM in the environment.
4.2 Role of benthic macroalgae
macroalgae reduce light available to benthic autotrophs, and increases in the occurrence and size of blooms of macroalgae have been hypothesized as a factor contributing to global sea-grass declines (Hauxwell et al., 2001). Macroalgae have also been shown to “self shade” when light is attenuated within the layers of an algal mat (Peckol and Rivers, 1996; Krause-Jensen et al., 1996), and self-shading has been suggested as a possible cause for “crashes” of mid-summer macroal-gal blooms that have been observed in numerous systems (Sfriso et al., 1992; McGlathery et al., 2001). Macroalgae were added to the mesocosms at densities observed in HIB and other shallow coastal bays, and their final densities (4-fold increase) were within the range of more eutrophied la-goons (McGlathery et al., 2001; Hauxwell et al., 2001; Sfriso et al., 1992; Pregnall and Rudy, 1985). Our intensive sam-pling throughout the experiment allowed us to track changes between the light treatments with and without macroalgae as the macroalgal bloom developed. We were able to not only detect changes in many of the sediment parameters that sug-gested that the presence of macroalgae influenced SOM, but were also able to detect the timing of those changes as the macroalgal bloom developed, as discussed below.
Changes in numerous sediment parameters suggested that macroalgae affected SOM quantity. TOC, TN, THAA, and PLFA concentrations were all lower in Macro treatments compared to Light treatments (Figs. 2a, b and 3a, b). By Day 42, SOM accumulation in Macro treatments was inter-mediate between the Light and Dark treatments. TOC, TN, and THAA increased in Macro treatments from background values by 130, 94, and 97 %, respectively. PLFA, on the other hand, increased until∼Day 14 and then decreased 15 % from initial values by Day 42, similar to the Dark treatments.
Molecular-level analyses also indicated that the macroal-gae treatment affected the composition of SOM. PLFA and pigment data in the Macro treatment showed similar pat-terns in microalgal community composition as the Light treatments. For example, in both treatments, diatoms (as in-dicated by 20:5ω3, fuco; Figs. 5d and 6a) dominated the microalgal community, but there was likely an increase in green algae relative to diatoms over time (20:5ω3 / 18:2ω6, fuco/(zea + lut); Figs. 5h and 6d), and cyanobacteria (18:4, myxo; Figs. 5f and 6b) were negligible in these sediments. However, the concentrations of total PUFA and individual algal PLFA concentrations were lower in Macro treatments, indicating that macroalgae limited microphytobenthic pro-duction (Fig. 5). Changes in PLFA over time in the Macro treatment were likely related to the amount of gal biomass within the mesocosms. By Day 14, macroal-gal biomass was ∼300 gdw m−2 (Fig. 1). According to a study by Krause-Jensen and colleagues (1996), this is the estimated value above which macroalgae completely block light reaching microphytobenthos. After this critical den-sity in our experiment, microphytobenthic production de-creased and SOM built up more slowly in Macro treat-ments. Even if macroalgal biomass had remained below
300 gdw m−2, chronic shading by macroalgae would likely
have decreased microphytobenthic metabolism, as has been observed in studies investigating the effects of shading on mi-crophytobenthos metabolism (Stutes et al., 2006; Sundback and McGlathery, 2005). It is not uncommon for macroalgal blooms to reach densities above 300 gdw m−2in eutrophied systems and persist for days to weeks (see Sundback and McGlathery, 2005 and references therein). Based on results from this present study, it is likely that blooms of this mag-nitude negatively affect microphytobenthic biomass.
As in our light–dark comparison, the presence of macroal-gae also changed the quality of SOM. Concentrations of PLFA in Macro treatments remained level after Day 14 (Fig. 3b), and the fraction of TOC from PLFA-C actually de-creased, suggesting that production of labile organic matter slowed down compared to the Light treatment (Table 4). As a result of changes in SOM quantity and composition, the het-erotrophic bacterial community differed in treatments with macroalgae. The mole fraction of Lys was lower in the Macro treatment with values that were similar to the Dark treat-ment (Fig. 4b). Lys makes up a notable fraction of THAA in bacteria (5–15 %) (Cowie and Hedges, 1992), so a lower concentration in sediment THAA likely indicated decreased bacterial activity. Additional studies suggest that Lys is selec-tively degraded due to its simple structure and high N con-tent (Cowie and Hedges, 1992). Bacterial PLFA concentra-tions were also lower in Macro treatments throughout most of the experiment (Fig. 5b). However, due to high variability between mesocosms, we were unable to detect a significant effect of macroalgae across treatments (Table 3).
(e.g., BrFA, Fig. 5b) between the Macro and Light treatments beginning∼Day 14. If macroalgal DOM was of equal im-portance to sediment microbes as microphytobenthic DOM, we do not believe the observed divergence in these parame-ters would have occurred.
4.3 Synthesis
PCA results provide a summary of the changes in the dom-inant controls on SOM on Day 1 versus Day 42. On Day 1, PLFA composition in Light and Macro treatments differed from the Dark, which likely reflects the fact that the Dark treatments were incubated in the dark for two weeks prior to the start of the experiment. PLFA composition reflected the contribution of algal fatty acids to SOM in both the Light and Macro treatments relative to the Dark treatment; however, since macroalgae were only present for 1 day, there were no significant effects from macroalgae. On Day 1 HAA compo-sition did not yet differ between any treatments. By Day 42, after macroalgal biomass had increased by fourfold, all treat-ments displayed a gradient of PLFA and HAA composition. Sediment composition in the Macro treatment shifted away from the Light treatment towards the Dark treatment, with less influence from algal PLFA and the more labile amino acids (e.g., Leu, Ile), and more influence from bacterial PLFA and less labile amino acids (e.g., Gly, D-Ala). In both Light and Macro treatments, we also observed shifts in microphy-tobenthic community composition by Day 42. On Day 1, 20:5ω3 was the most prominent algal PUFA, while algae pro-ducing 18:2ω6 contributed relatively more to algal PLFA by Day 42.
Overall, microphytobenthos fundamentally altered SOM quality and quantity; however, the role of microphytoben-thos as a source of labile SOM was significantly diminished likely due to shading by macroalgae. Although microphyto-benthos may compete with macroalgae for nutrients, in our experiment, neither N nor phosphorous availability varied over the experiment, which suggests competition for nutri-ents was not the driver of our observed changes. The poten-tial ecological consequences of decreased microphytoben-thic production are numerous. For example, biogeochemi-cal processes such as nitrification and denitrification are af-fected by diel variations in oxygen related to microphyto-benthic metabolism as well as competition with microphy-tobenthos for dissolved N (An and Joye, 2001; Rysgaard et al., 1995). In addition, microphytobenthos are a nutrient-rich food source for numerous faunal grazers (Miller et al., 1996) and to heterotrophic bacteria (Banta et al., 2004). Sediment stability is also enhanced by the presence of benthic diatoms that produce EPS (Tolhurst et al., 2002).
Moreover, the shift from a community dominated by mi-crophytobenthos to macroalgae will change the role of sed-iments in nutrient cycling. Benthic-pelagic coupling is par-ticularly important in shallow systems, since much of the C and nutrient cycling occurs at the sediment–water
inter-face. Previous studies suggest that tight coupling between microphytobenthos and sediment bacteria serves as a mech-anism for retaining C and N in the sediments (Hardison et al., 2011b; Evrard et al., 2008). If microphytobenthic pro-duction is decreased due to macroalgae, this will in turn de-crease this sink, allowing a greater flux of C and N from the sediments to the overlying water. Macroalgae take up large amounts of C and N while growing. Indeed, our companion flux study showed increased benthic gross primary produc-tion in the Macro treatment (sediments + macroalgae) rela-tive to the Light treatment (sediments alone; Anderson, un-published data). However, retention of C and N within the sediments would likely be a more stable sink than retention as bloom-forming macroalgal tissue. Once these ephemeral macroalgae die, nutrients are re-released to the water column, which may fuel phytoplankton and bacterial metabolisms (McGlathery et al. 2001; Tyler et al., 2003). Thus, cycling of C and N through macroalgae rather than microphytobenthos may create a positive feedback to eutrophication, whereas sediment microbes may play a key buffering role against the effects of increased nutrient loading. Our results demonstrate that macroalgae significantly altered SOM properties that in-fluence ecosystem processes, and chronic shading by dense macroalgal blooms, characteristic of some eutrophied sys-tems, will likely result in surface sediments that more closely resemble sediments in regions unaffected by light.
Supplementary material related to this article is available online at: http://www.biogeosciences.net/10/ 5571/2013/bg-10-5571-2013-supplement.pdf.
Acknowledgements. This work would not have been possible without the help of M. Luckenbach, S. Fate, and R. Bonniwell at the Virginia Institute of Marine Science (VIMS) Eastern Shore Lab as well as R. Bushnell, J. Cope, E. Ferer, E. Lerberg, D. Maxey, L. Palomo, S. Salisbury, C. Smith, J. Stanhope, and H. Walker at VIMS. We are also grateful to J. Middelburg and M. Houtekamer at the Netherlands Institute for Sea Research (NIOZ). This research was supported by the National Science Foundation (Virginia Coast Reserve Long-Term Ecological Research project 0080381 and 0621014; Division of Environmental Biology (DEB) Ecosystems Program 0542645 to I. C. Anderson and E. A. Canuel and 0542635 to C. R. Tobias), the European Association of Organic Geochemists (Shell Travel Award to A. K. Hardison), the Environmental Protection Agency (EPA FP916722010 to A. K. Hardison), the Netherlands Organization for Scientific Research (Pionier 833.02.2002 to B. Veuger), and the Darwin Center for Biogeology (project 142.16.1052 to B. Veuger). The EPA has not officially endorsed this publication and the views expressed herein may not reflect the views of the EPA. This paper is Contribution No. 3298 of VIMS, The College of Willliam & Mary.
References
An, S. and Joye, S. B.: Enhancement of coupled nitrification-denitrification by benthic photosynthesis in shallow estuarine sediments, Limnol. Oceanogr., 46, 62–74, 2001.
Anderson, I. C., McGlathery, K. J., and Tyler, A. C.: Microbial me-diation of “reactive” nitrogen transformations in a temperate la-goon, Mar. Ecol.-Prog. Ser., 246, 73–84, 2003.
Banta, G. T., Pedersen, M. F., and Nielsen, S. L.: Decomposition of marine primary producers: Consequences for nutrient recycling and retention in coastal ecosystems, in: Estuarine Nutrient Cy-cling: The Influence of Primary Producers, edited by: Nielsen, S. L., Banta, G. T., and Pedersen, M. F., Kluwer Academic Publish-ers, Netherlands, 187–216, 2004.
Barranguet, C., Herman, P. M. J., and Sinke, J. J.: Microphytoben-thos biomass and community somposition studied by pigment biomarkers: importance and fate in the carbon cycle of a tidal flat, J. Sea Res., 38, 59–70, 1997.
Benoy, G. A. and Kalff, J.: Sediment accumulation and Pb burdens in submerged macrophyte beds, Limnol. Oceanogr., 44, 1081– 1090, 1999.
Bligh, E. G. and Dyer, W. J.: A Rapid Method of Total Lipid Ex-traction and Purification, Can. J. Biochem. Phys., 37, 911–917, 1959.
Boschker, H. T. S., Wielemaker, A., Schaub, B. E. M., and Holmer, M.: Limited coupling of macrophyte production and bacterial carbon cycling in the sediments of Zostera spp. meadows, Mar. Ecol.-Prog. Ser., 203, 181–189, 2000.
Bouillon, S. and Boschker, H. T. S.: Bacterial carbon sources in coastal sediments: a cross-system analysis based on sta-ble isotope data of biomarkers, Biogeosciences, 3, 175–185, doi:10.5194/bg-3-175-2006, 2006.
Canuel, E. A. and Martens, C. S.: Seasonal-Variations in the Sources and Alteration of Organic-Matter Associated with Recently-Deposited Sediments, Org. Geochem., 20, 563–577, 1993.
Canuel, E. A. and Martens, C. S.: Reactivity of recently de-posited organic matter: Degradation of lipid compounds near the sediment-water interface, Geochim. Cosmochim. Ac., 60, 1793– 1806, 1996.
Canuel, E. A., Cloern, J. E., Ringelberg, D. B., Guckert, J. B., and Rau, G. H.: Molecular and isotopic tracers used to exam-ine sources of organic matter and its incorporation into the food webs of San Francisco Bay, Limnol. Oceanogr., 40, 67–81, 1995. Canuel, E. A., Freeman, K. H., and Wakeham, S. G.: Isotopic com-positions of lipid biomarker compounds in estuarine plants and surface sediments, Limnol. Oceanogr., 42, 1570–1583, 1997. Canuel, E. A., Spivak, A. C., Waterson, E. J., and Duffy, J. E.:
Biodi-versity and food web structure influence short-term accumulation of sediment organic matter in an experimental seagrass system, Limnol. Oceanogr., 52, 590–602, 2007.
Cook, P. L. M., Butler, E. C. V., and Eyre, B. D.: Carbon and ni-trogen cycling on intertidal mudflats of a temperate Australian estuary. I. Benthic metabolism, Mar. Ecol.-Prog. Ser., 280, 25– 38, 2004.
Cook, P. L. M., Veuger, B., Boer, S., and Middelburg, J. J.: Effect of nutrient availability on carbon and nitrogen incorporation and flows through benthic algae and bacteria in near-shore sandy sed-iment, Aquat. Microb. Ecol., 49, 165–180, 2007.
Cowie, G. L. and Hedges, J. I.: Sources and Reactivities of Amino-Acids in a Coastal Marine-Environment, Limnol. Oceanogr., 37, 703–724, 1992.
Dauwe, B. and Middelburg, J. J.: Amino acids and hexosamines as indicators of organic matter degradation state in North Sea sediments, Limnol. Oceanogr., 43, 782–798, 1998.
Dijkman, N. A. and Kromkamp, J. C.: Phospholipid-derived fatty acids as chemotaxonomic markers for phytoplankton: applica-tion for inferring phytoplankton composiapplica-tion, Mar. Ecol.-Prog. Ser., 324, 113–125, 2006.
Duarte, C. M.: Submerged Aquatic Vegetation in Relation to Dif-ferent Nutrient Regimes, Ophelia, 41, 87–112, 1995.
Duffy, J. E. and Harvilicz, A. M.: Species-specific impacts of graz-ing, amphipods in an eelgrass-bed community, Mar. Ecol.-Prog. Ser., 223, 201–211, 2001.
Evrard, V., Cook, P. L. M., Veuger, B., Huettel, M., and Middelburg, J. J.: Tracing carbon and nitrogen incorporation and pathways in the microbial community of a photic subtidal sand, Aquat. Mi-crob. Ecol., 53, 257–269, 2008.
Fonseca, M. S. and Calahan, J. A.: A preliminary evaluation of wave attenuation by four species of seagrass, Estuar. Coast. Shelf S., 25, 565–576, 1992.
Gacia, E., Duarte, C. M., and Middelburg, J. J.: Carbon and nutri-ent deposition in a Mediterranean seagrass (Posidonia oceanica) meadow, Limnol. Oceanogr., 47, 23–32, 2002.
Gillan, F. T. and Johns, R. B.: Chemical biomarkers for marine bac-teria: fatty acids and pigments, in: Biological Markers in the Sed-imentary Record, edited by: Johns, R. B., Elsevier, Amsterdam, 364, 1986.
Goto, N., Mitamura, O., and Terai, H.: Biodegradation of photosyn-thetically produced extracellular organic carbon from intertidal benthic algae, J. Exp. Mar. Biol. Ecol., 257, 73–86, 2001. Gray, J. S., Wu, R. S., and Or, Y. Y.: Effects of hypoxia and organic
enrichment on the coastal marine environment, Mar. Ecol.-Prog. Ser., 238, 249–279, 2002.
Hardison, A. K., Canuel, E. A., Anderson, I. C., and Veuger, B.: Fate of macroalgae in benthic systems: carbon and nitrogen cycling within the microbial community, Mar. Ecol.-Prog. Ser., 414, 41– 55, 2010.
Hardison, A. K., Tobias, C., Stanhope, J., Canuel, E., and Anderson, I.: An Experimental Apparatus for Laboratory and Field-Based Perfusion of Sediment Porewater with Dissolved Tracers, Estuar. Coast., 34, 243–255, 2011a.
Hardison, A. K., Anderson, I. C., Canuel, E. A., Tobias, C. R., and Veuger, B.: Carbon and nitrogen dynamics in shallow photic sys-tems: Interactions between macroalgae, microalgae, and bacte-ria, Limnol. Oceanogr., 56, 1489–1503, 2011b.
Hauxwell, J., Cebrian, J., Furlong, C., and Valiela, I.: Macroalgal canopies contribute to eelgrass (Zostera marina) decline in tem-perate estuarine ecosystems, Ecology, 82, 1007–1022, 2001. Hauxwell, J., Cebrian, J., and Valiela, I.: Eelgrass Zostera marina
loss in temperate estuaries: relationship to land-derived nitrogen loads and effect of light limiataion imposed by algae, Mar. Ecol.-Prog. Ser., 247, 59–73, 2003.
Heck, K. L., Hays, G., and Orth, R. J.: Critical evaluation of the nursery role hypothesis for seagrass meadows, Mar. Ecol.-Prog. Ser., 253, 123–136, 2003.