www.biogeosciences.net/13/3387/2016/ doi:10.5194/bg-13-3387-2016
© Author(s) 2016. CC Attribution 3.0 License.
Climate impacts on multidecadal
p
CO
2
variability in the
North Atlantic: 1948–2009
Melissa L. Breeden and Galen A. McKinley
Department of Atmospheric and Oceanic Sciences, University of Wisconsin, Madison, Wisconsin, USA
Correspondence to:Melissa L. Breeden ([email protected])
Received: 6 August 2015 – Published in Biogeosciences Discuss.: 15 September 2015 Revised: 19 April 2016 – Accepted: 13 May 2016 – Published: 9 June 2016
Abstract. The North Atlantic is the most intense region of
ocean CO2uptake in term of units per area. Here, we inves-tigate multidecadal timescale variability of the partial pres-sure of CO2 (pCO2) that is due to the natural carbon cy-cle, using a regional model forced with realistic climate and preindustrial atmosphericpCO2for 1948–2009. Large-scale patterns of naturalpCO2variability are primarily associated with basin-averaged sea surface temperature (SST) that, in turn, is composed of two parts: the Atlantic Multidecadal Oscillation (AMO) and a long-term positive SST trend. The North Atlantic Oscillation (NAO) drives a secondary mode of variability. For the primary mode, positive AMO and the SST trend modifypCO2with different mechanisms and spa-tial patterns. Positive AMO is also associated with a signif-icant reduction in dissolved inorganic carbon (DIC) in the subpolar gyre, due primarily to reduced vertical mixing; the net impact of positive AMO is to reduce pCO2in the sub-polar gyre. Through direct impacts on SST, the net effect of positive AMO is to increasepCO2in the subtropical gyre. From 1980 to present, long-term SST warming has amplified AMO impacts onpCO2.
1 Introduction
To date, the ocean has removed approximately one-third of all anthropogenic carbon emitted to the atmosphere and has, thus, substantially damped climate warming (Khatiwala et al., 2009; Sabine et al., 2004). As carbon dioxide emissions continue to increase due to fossil fuel emissions and cement production, there is significant interest in better understand-ing the ocean carbon cycle. Due to the limited instrumental record and sparse data, multidecadal variability of the ocean
carbon sink remains poorly constrained. The North Atlantic, in particular, is a region of highly concentrated carbon up-take (Takahashi et al., 2009) and of significant carbon cy-cle variability related to variations in the climate, with mul-tiple studies finding an association with the North Atlantic Oscillation (NAO; Fay and McKinley, 2013; Schuster et al., 2013; Terry, 2012; Levine et al., 2011; McKinley et al., 2011; Löptien and Eden, 2010; Ullman et al., 2009; Thomas et al., 2008). However, data are sparse, processes are complex, and the timescales for studies have differed, and this has compli-cated a clear elucidation of the mechanisms of North Atlantic carbon cycle variations.
in-sights into the mechanisms of variability of North Atlantic pCO2.
As shown by Ullman et al. (2009) in a 15-year simulation (1992–2006), internal variability in the North Atlantic is par-tially obscured by the large, quasilinear trend of CO2 flux into the ocean that is driven by increasing CO2emissions. To examine the carbon sink variability that is partially masked by this large carbon influx, we use a hindcast model from 1948 to 2009 forced with the preindustrial atmospheric CO2 concentration and realistic climate. As described below, we find that the basin-average SST is associated with the leading mode of surface oceanpCO2variability. This SST signal, in turn, includes an upward trend due to greenhouse gas emis-sions and a signal of internal variability characterized by the Atlantic Multidecadal Oscillation (AMO; Kerr, 2000).
2 Methodology
2.1 Physical–biogeochemical–ecosystem model
The MIT Ocean General Circulation Model (Marshall et al., 1997a, b) has been regionally configured for the North At-lantic between 20◦S and 81.5◦N (Bennington et al., 2009; Ullman et al., 2009). The model has a horizontal resolu-tion of 0.5◦latitude and 0.5◦longitude and 23 vertical lev-els beginning with a resolution of 10 m thickness at the surface and increasing to 500 m thickness at depths greater than 2200 m. The Gent–McWilliams (Gent and McWilliams, 1990) eddy parameterization and the K-profile parameteri-zation (KPP) boundary layer mixing scheme (Large et al., 1994) were employed to model sub-grid-scale processes. Daily fields from NCEP/NCAR Reanalysis I force the model from 1948 to 2009 (Kalnay et al., 1996). SST and SSS (sea surface salinity) are relaxed to monthly historical SST (Had1SSTv1.0, Rayner et al., 2003) and climatological SSS (Antonov et al., 2006) observations, on the timescale of 2 and 4 weeks, respectively. Glacier melt and/or river discharge are not included in the model forcing; instead the SSS relaxation approximates these impacts. Freshwater (evaporation−precipitation) forcing and SSS relaxation im-pact both salinity and tracer concentrations. In lieu of an ac-tive sea ice simulation, observed fractional ice from NCEP Reanalysis 1 is applied with interpolation to daily resolution. For open boundary conditions, a sponge layer exists at 20◦S, and over the first 5◦of latitude to the north there is restoration to climatological temperature, salinity, dissolved inorganic carbon (DIC), and phosphate fields. For temper-ature and salinity, there is also a sponge layer at Gibraltar. More discussion of the sponge layer can be found in Ullman et al. (2009).
The pelagic ecosystem is parameterized using one zoo-plankton class and two phytozoo-plankton classes (diatoms and “small” phytoplankton) as described previously (Dutkiewicz et al., 2005; Bennington et al., 2009; Ullman et al., 2009).
Carbon (inorganic and dissolved, and particulate organic), alkalinity (ALK), phosphorus, silica, and iron cycling are explicitly included in the biogeochemical model. Carbonate chemistry is modeled as in Follows et al. (2006). The objec-tive of this simulation is to identify climate impacts on the natural carbon cycle without the complication of the large CO2flux into the ocean that is observed. Thus, atmospheric pCO2is fixed at a constant, preindustrial level of 278 ppmv. The physical model was spun up for 100 years. The ob-served meteorological forcing for 1948–1978 was cycled three times (90 years), and then 1948 was repeated 10 years prior to beginning the simulation analyzed here. Following the physical spin-up, the biogeochemical model was initial-ized using preindustrial estimates for DIC and ALK clima-tology from the Global Data Analysis Project (GLODAP) database (Key et al., 2004). The biogeochemical model was then spun up for an additional 100 years, long enough to eliminate drift in the biogeochemical parameters. The per-cent change over the last 5 years of spin-up in the basin-averaged surface DIC field is 0.00046 % per year. For com-parison, the percent change in DIC from a high AMO (1955) to low AMO (1975) is 0.012 % per year, two orders of mag-nitude greater than drift at the end of the spup. This in-dicates that a 100-year biogeochemical spin-up is sufficient to eliminate model drift that would impact our upper-ocean analysis. Following spin-up, the model was then run with NCEP/NCAR daily forcing fields for 1948–2009.
Model physics across the North Atlantic as well aspCO2, DIC, and ALK at the Bermuda Atlantic Time Series (Bates, 2007) and in the subpolar North Atlantic have been compared to results from a previous simulation using the same model forced with observed atmospheric pCO2 for 1992–2006 (Ullman et al., 2009). Comparison of this simulation to es-timates of the preindustrial vertical profile of DIC in the sub-polar gyre indicates good performance by the model (Sup-plement Fig. S1 and text). Mikaloff-Fletcher et al. (2007) es-timated the preindustrial, or “natural”, air-to-sea CO2flux in the North Atlantic with an ocean inversion that incorporated climatological circulations estimated from 10 ocean circula-tion models. For the North Atlantic from 0 to 75◦N, they find an uptake of 0.27±0.07 PgC yr−1. The mean natural CO2 flux averaged over the same spatial domain in our simula-tion is consistent, 0.23 PgC yr−1. In total, our comparison to available data indicates that the model is capable of robustly simulating the carbon biogeochemistry of the North Atlantic and its response to climate variability.
2.2 Post-processing
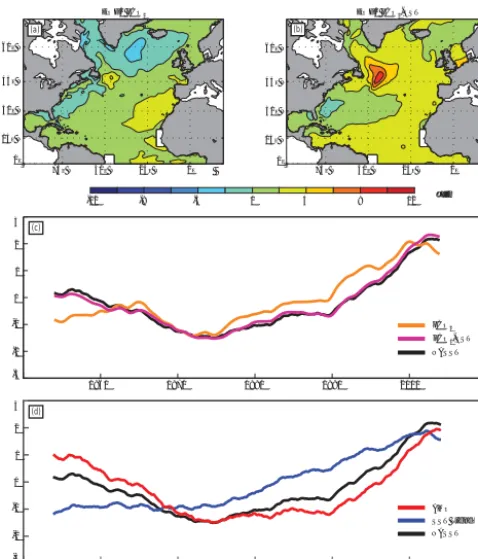
EOF1 pCO2
(a)
EOF1 pCO2-SST
60º N 0º 15º N 30º N 45º N 25º W 50º W
75º W 0º
3 -3 -2 -1 0 1 2 2000 1990 1980 1970 1960 pCO2 pCO2-SST NASST 60º N 0º 15º N 30º N 45º N 25º W 50º W
75º W 0º
(c)
(b)
µatm
-12 -8 -4 0 4 8 12
2000 1990 1980 1970 1960 3 -3 -2 -1 0 1 2 (d) SST Trend NASST AMO
Figure 1. (a)EOF1 of totalpCO2(µatm) and(b)EOF1 ofpCO2 -SST (µatm), explaining 18 and 38 % of total variance, respec-tively.(c)PC1-pCO2(orange); PC1-pCO2-SST (pink); and area-weighted, basin-averaged standardized North Atlantic SST time se-ries (black).(d)Area-weighted, basin-averaged (0–70◦N, 98◦W– 19.5◦E) North Atlantic SST from Had1SST (black); global area-weighted SST regressed onto North Atlantic SST (blue); and AMO index created by subtracting the global regression from the North Atlantic SST (red). All indices are standardized by 1σ. Time series smoothed with a 121-month box smoother. Two small coastal areas off Africa and South America were excluded in(a)and(b)due to the presence of localized, anomalously strong upwelling in the early 1960s that precluded elucidation of the large-scale pattern.
nual timescales (Takahashi et al., 2009; Watson et al., 2009, Le Quéré et al., 2010).pCO2is decomposed into contribu-tions from temperature and chemical effects using model out-put and the full carbonate equations (Follows et al., 2006). As in Ullman et al. (2009),pCO2-SST is found by allowing only SST to vary in the full carbonate equations for pCO2; i.e., all other variables (DIC, ALK, SSS, phosphate, silica) are held constant at their long-term mean values.pCO2-chem is found by holding SST constant and allowing the rest of the input variables to vary; forpCO2-DIC, only DIC varies.
Model diagnostics for DIC are the monthly mean tendency terms (in mmol m−3yr−1) due to individual modeled pro-cesses and are calculated at each time step during the model simulation (Ullman et al., 2009). Monthly mean diagnostics for the surface layer DIC change due to horizontal and ver-tical advection and diffusion, net biological processes
(pri-mary production and respiration), freshwater input/removal, and air–sea CO2flux are used.
The AMO index for the model is calculated using modeled SST and observed global Had1SSTv1.0 (Rayner et al., 2003) using the approach of Wang and Dong (2010). This approach regresses the area-weighted global mean Had1SST time se-ries onto area-weighted basin-wide mean North Atlantic SST time series (NASST). This regressed index is subtracted from the total NASST to define the AMO. The combined SST sig-nal is, thus, decomposed into contributions from globally in-creasing SST (SST trend) and the internal variability of the AMO (Fig. 1d). In order to focus on the decadal timescale variability, all time series are smoothed with a standardized 121-month box smoother.
3 Results
3.1 Multidecadal variability
To determine the leading mode of variability in surface ocean pCO2, principle component analysis is employed. The first empirical orthogonal function (EOF1) patterns and smoothed principle components (PCs) for monthly, 13-month smoothed total pCO2, and the SST contribution to pCO2(pCO2-SST) are shown in Figure 1a–c. To determine the change inpCO2anomalies described by EOF1 at a spe-cific point in time, the value of the PC1 at that time can be multiplied by the EOF1 pattern. The percent of variance in the total field explained by the EOF1 pattern is 18 and 38 % forpCO2andpCO2-SST, respectively. In both cases, the EOF1 patterns are statistically distinct from their EOF2 patterns, which are discussed in Sect. 4. This EOF analy-sis unveils the basin-scale coherent variability. There is re-maining variability in coherent secondary large-scale modes (e.g., EOF2) or at scales smaller than the whole basin. That large-scale modes of climatic variability tend to capture 10– 40 % of variance has been documented across many cli-mate variables, including global SST and tropospheric winds (von Storch and Zwiers, 1999), Southern Ocean geopotential heights (Thompson and Wallace, 2000), andpCO2 through-out the Pacific (McKinley et al., 2004, 2006). That EOF1 of pCO2 captures the patterns of multidecadal large-scale change is further evidenced by plots of 20-year anomalies ofpCO2(Fig. S2).
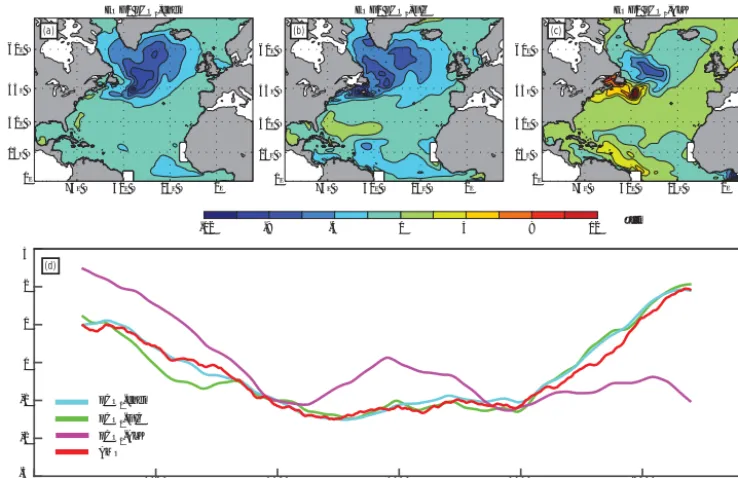
[image:3.612.50.289.65.344.2]pCO2-chem pCO2-DIC
AMO
(d)
3
-3 -2 -1 0 1 2
2000 1990
1980 1970
1960 pCO2-ALK
µatm
-12 -8 -4 0 4 8 12
60º N
0º 15º N 30º N 45º N
25º W 50º W
75º W 0º 75º W 50º W 25º W 0º 75º W 50º W 25º W 0º
EOF1 pCO2-ALK EOF1 pCO2-chem EOF1 pCO2-DIC
(c) (b)
(a)
60º N
0º 15º N 30º N 45º N
60º N
0º 15º N 30º N 45º N
Figure 2. (a) EOF1pCO2-chem (µatm),(b)EOF1pCO2-DIC (µatm), and(c)EOF1pCO2-ALK explaining 32, 25, and 19 % of total variance, respectively;(d)PC1-pCO2-chem (cyan), PC1-pCO2-DIC (green), PC1-pCO2-ALK (magenta), and AMO index (red), all stan-dardized. Time series smoothed with a 121-month box smoother.
andpCO2-DIC explain 32 and 25 % of the variance, respec-tively (Fig. 2a, b), and these PC1s are highly correlated with the AMO:r=0.99 and 0.96, respectively (Fig. 2d, Table S1). Alkalinity can also affect pCO2-chem since increased alkalinity reduces pCO2. PC1 for EOF1 of pCO2-ALK (Fig. 2c) does not correlate highly to PC1s of total pCO2 orpCO2-chem (r= −0.25;r=0.44, respectively), or to the AMO (see Table S1). Though alkalinity does contribute to the spatial pattern shown in the EOF1 of pCO2-chem, the temporal evolution of this pattern differs substantially and is not strongly connected to the AMO or to EOF1 of pCO2. Therefore, we focus on the more direct relationship between pCO2-DIC andpCO2-chem for the rest of the paper, and re-serve the alkalinity relationships for future in-depth analysis. The AMO, an index of internal North Atlantic SST variability, declines (cools) until 1975 and rises thereafter (Fig. 1d). Taking the last half of the time series as an ex-ample, increasingly positive AMO corresponds to a decrease inpCO2-chem, with the strongest declines in the subpolar gyre and driven by reducedpCO2-DIC (Fig. 2). This occurs in opposition to the direct effect onpCO2of warmer NASST (Fig. 1b, c), driven jointly by the increasingly positive AMO and the warming trend (Fig. 1d). SST and chemical terms vary inversely because higher SST (AMO+)enhances strati-fication, leading to a shoaling of mixed-layer depths (MLDs) over most of the gyre (discussed in Sect. 4). This shoaling in turn limits the amount of deep, carbon-rich water that is mixed to the surface, reducingpCO2-DIC andpCO2-chem (Ullman et al., 2009). The correlation of PC1-pCO2-chem
and PC1-pCO2-DIC with PC1-pCO2-SST is 0.90 and 0.91, respectively (Table S1). Mechanisms of AMO impacts on pCO2-chem in the subpolar gyre will be explored further be-low.
3.2 Regression analysis
[image:4.612.113.482.66.305.2]Figure 3.121-month box-smoothed AMO regressed onto unsmoothed monthly(a)pCO2,(b)pCO2-SST, and(c)pCO2-chem. SST trend regressed onto(d)pCO2,(e)pCO2-SST, and(f)pCO2-chem. NASST (AMO+SST trend) regressed onto(g)pCO2,(h)pCO2-SST, and(i)
pCO2-chem. Regressions calculated from 1953 through 2005. Values < 0.5 and >−0.5 µatm are whited out to highlight regions experiencing the most substantial changes.
pCO2 north of 45◦N and a slight increase inpCO2 in the eastern subtropical gyre (Fig. 3a).
When responding to the global SST trend, pCO2-SST more heavily controls the response of the total pCO2field (Fig. 3d, e). ThepCO2-SST response is strongest along the Gulf Stream and east of Newfoundland, and it also increases somewhat off the coast of Europe and Africa. pCO2-chem exhibits some decline in the Gulf Stream region and has a small response elsewhere (Fig. 3f).
Regression with the total NASST time series (Fig. 1) il-lustrates the combined effects of the AMO and trend sig-nals (Fig. 3g–i). A positive anomaly of NASST depresses totalpCO2in the subpolar gyre, consistent with the AMO impact found above. Positive NASST also increases total pCO2off north Africa, consistent with the impact of the SST trend.pCO2-SST both increases off Africa and has a strong maximum in the Gulf Stream region east of Newfoundland with positive NASST anomalies. ThepCO2-chem response is slightly weaker in the subpolar gyre than for the AMO alone (Fig. 3a, i).
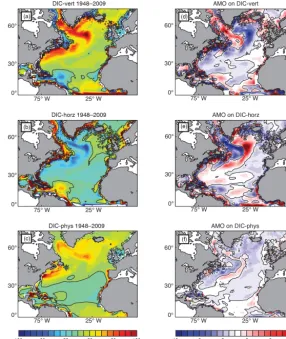
3.3 DIC diagnostics
To further investigate the chemical term response to the AMO, model diagnostics for the DIC field are regressed upon the AMO index. Diagnostics are modeled rates of change in DIC due to one of five processes that have been saved at ev-ery model time step. Physical processes are separated into horizontal advection and diffusion (DIC-horz) and vertical advection and diffusion (DIC-vert). DIC-phys is the sum of vertical and horizontal transport, showing the net effect of physical transport on DIC (Fig. 4). The rate of DIC sup-ply is also affected by biological processes involving DIC incorporation into organic matter and remineralization back to inorganic (DIC-bio), net precipitation/evaporation that di-lutes or concentrates DIC (DIC-fresh), and the air–sea flux of CO2(DIC-flx) (Fig. 5). The focus on DIC is justified by the fact thatpCO2-chem change has the same pattern and is highly correlated withpCO2-DIC change (Fig. 2). The fo-cus on the AMO is justified by its strong imprint onpCO2 throughpCO2-chem (Figs. 2, 3).
Figure 4.DIC diagnostics. Left column: 1948–2009 mean(a)DIC-vertical;(b)DIC-horizontal; and(c)DIC-physical, where DIC-physical is the sum of DIC-vertical and DIC-horizontal. Right column: AMO regressed onto(d)DIC-vertical,(e)DIC-horizontal, and(f)DIC-physical. Units: mmol m−3yr−1.
from below (Fig. 4a). Horizontal DIC advection and mixing removes this vertically supplied DIC along the Gulf Stream and in the western subpolar gyre (Fig. 4b). While the vertical and horizontal components tend to have opposing influences, the net effect is a positive DIC supply to the subpolar gyre, as shown by mean DIC-phys (Fig. 4c). With positive AMO, vertical advective and diffusive fluxes of DIC decrease in the Irminger Sea and Iceland Basin, while they increase in the Labrador Sea and east of Newfoundland (Fig. 4d). These changes are consistent with AMO-related MLD changes out-side of the Labrador Sea (Fig. 6) and changes in the basin-scale barotropic stream function indicating a weakened sub-polar gyre (Fig. 7). The effect of this is to shift the central DIC-vert maximum to the west. With positive AMO, hori-zontal advection and diffusion largely respond to changes in vertical advection and diffusion, with less horizontal diver-gence (a positive change) in regions where the vertical sup-ply is reduced (Fig. 4e). The net effect shown by DIC-phys reveals an overall reduction in DIC supply (Fig. 4f), consis-tent with a weaker subpolar gyre circulation and shallower
MLDs that reduce the vertical supply of DIC. Hakkinen and Rhines (2009) illustrate and increased penetration of subtrop-ical waters into the subpolar region from the 1990s to the 2000s, consistent with a weaker subpolar gyre circulation. The changes in MLD and stream function are also in agree-ment with results from Zhang (2008), who links the observed spin-down of the subpolar gyre in the 1990s to an enhanced Meridional Overturning Circulation (MOC), using a combi-nation of satellite altimeter observations and results from a 1000-year coupled ocean–atmosphere model simulation.
Mean DIC impacts from physics, biological processes, freshwater, and air–sea flux are shown in Fig. 5a–e. The net impact of biology is to remove DIC from the surface of most of the region, with the most intense removal along the Gulf Stream (Fig. 5a). The smaller impact of evaporation and pre-cipitation is to concentrate DIC in the subtropics and to di-lute it in the subpolar gyre (Fig. 5b). The air–sea CO2 flux term is also small, positive north of about 35◦N and negative
Figure 5. DIC diagnostics. Left column: 1948–2009 mean(a)DIC-physical,(b) DIC-bio,(c)DIC-fresh, and(d) DIC-CO2flux. Right column: AMO regressed onto(e)DIC-physical,(f)DIC-bio,(g)DIC-fresh, and(h)DIC-CO2flux. Units: mmol m−3yr−1.
anomaly) occurring in the same region where horizontal flux increases, consistent with biological stimulation through an increased supply of nutrients from the subtropical subsurface along the “nutrient stream” (Williams et al., 2006). There is reduced biological productivity, and thus a reduction of DIC loss (a positive DIC anomaly), in other parts of the basin, which is consistent with satellite observations from the late 1990s to the mid-2000s (Behrenfeld et al., 2006). Changes in surface ocean DIC content due to freshwater fluxes and air–sea CO2flux with the AMO are small. Across the basin, the net DIC change associated with AMO is negative, with
the strongest negative changes occurring in the subpolar gyre (Figs. 2b, 3c)
4 Discussion and conclusions
advec-AMO on MLD
60°
0° 30°
25° W 75° W
-100 0 100
[image:8.612.96.238.66.195.2]Meters
Figure 6.Regression of AMO on mixed-layer depth (MLD). Neg-ative values denote a shoaling of MLD.
Sverdrups Sverdrups
Mean barotropic streamfunction 1948–2009 AMO on barotropic streamfunction
-50 -30 -10 10 30 50 60°
0° 30°
-5 -3 -1 1 3 5 25° W
75° W 60°
0° 30°
25 °W 75° W
(b) (a)
Figure 7. (a) 1948–2009 mean barotropic stream function and
(b) AMO regressed onto barotropic stream function anoma-lies. Positive values denote clockwise motion. Units: sverdrups (1 Sv=106m3×s−1).
tion and mixing. Changing biology has the most important secondary effect and largely damps the anomalies caused by advection and mixing. Freshwater and CO2 fluxes changes are slight.
Our findings linking the AMO to natural carbon cycle vari-ability in the North Atlantic are consistent with the study of Séférian et al. (2013), who also found an AMO-like signal dominated North Atlantic pCO2variability in a 1000-year Earth system model simulation with constantpCO2. Other studies have focused on the relationship between the North Atlantic Oscillation and CO2flux using models and observa-tions (Löptien and Eden, 2010; Ullman et al., 2009; Schuster et al., 2009; Thomas et al., 2008). Consistent with these pre-vious studies, the NAO is the second mode of variability in this simulation (Figs. S4, S5), and the corresponding prin-ciple components are highly correlated with the NAO (Ta-ble S2). The shorter time frame for most previous studies explains, in part, the difference in attribution to the AMO as opposed to NAO. Our results are broadly consistent with previous studies in the finding that physical variability is the dominant driver of variability in the North Atlantic surface ocean carbon cycle.
The NAO and AMO may, in fact, be linked through the MOC, with a positive NAO enhancing MOC, which over time warms SSTs and leads to a positive AMO. Stronger overturning (enhanced MOC) may result in positive SST anomalies and thus a positive AMO phase over time, with some lag between the peak MOC and peak AMO response. Latif et al. (2004) used a model to show that oceanic heat transport related to the MOC leads the SST response (po-tentially the AMO) by about 10 years, while Delworth and Mann (2000) found a 10-year lag between subsurface tem-perature anomalies and MOC but less of a lag with SST. The precise mechanisms remain in debate due to different model findings and a lack of observational constraints (Delworth and Mann, 2000; Knight et al., 2005; Dima and Lohmann, 2007; Latif et al., 2006; Kavvada et al., 2013, and references therein). In our simulation, the NAO and MOC are signifi-cantly correlated (r=0.57, Table S1) and there is also a high correlation (r=0.86) between the NAO (Fig. S3) and the 15-year-lagged AMO. These correlations are broadly consis-tent with the above-postulated NAO–MOC–AMO relation-ship. On the other hand, Booth et al. (2012) suggest that the AMO may be driven, in fact, by atmospheric aerosol vari-ability, so it is possible that there is no such AMO–MOC relationship at all. Future modeling and observations should further elucidate these connections, which reach beyond the scope of this study.
We find multidecadal variability in the natural carbon cy-cle of the surface North Atlantic to be dominated by an SST trend and multidecadal SST variations captured by the AMO index. Variability linked to the AMO influences bothpCO2 -SST andpCO2-chem. In the subpolar gyre, the positive SST influence on pCO2 is overwhelmed by reduced supply of DIC to the surface ocean through mixing and advection, the net impact being reduced pCO2. The reduction in mixing is associated with shoaling of MLDs and a weaker subpolar gyre circulation, both associated with warmer SSTs (positive AMO). In the subtropics, the SST impact is stronger, and thus pCO2is increased under the influence of positive AMO and positive SST trend.
[image:8.612.47.287.249.375.2]com-bined effect of the AMO and a positive SST trend due to anthropogenic climate change.
The Supplement related to this article is available online at doi:10.5194/bg-13-3387-2016-supplement.
Acknowledgements. The authors are grateful for support from NASA grants (NNX/11AF53G and NNX/13AC53G). Model code is freely available at http://MITgcm.org; model fields analyzed here can be acquired by contacting G. A. McKinley.
Edited by: L. Cotrim da Cunha
References
Antonov, J. I., Locarnini, R. A., Boyer, T. P., Mishonov, A. V., and Garcia, H. E.: World Ocean Atlas 2005, vol. 2, Salinity, NOAA Atlas NESDIS 62, edited by: Levitus, S., US Govt. Print. Off., Washington, D. C., 182 pp., 2006.
Bates, N. R.: Interannual variability of the oceanic CO2 sink in the subtropical gyre of the North Atlantic Ocean over the last 2 decades, J. Geophys. Res., 112, C09013, doi:10.1029/2006JC003759, 2007.
Behrenfeld, M. J., O’Malley, R. T., Siegel, D. A., McClain, C. R., Sarmiento, J. L., Feldman, G. C., Milligan, A. J., Falkowski, P. G., Letelier, R. M., and Boss, E. S.: Climate-driven trends in con-temporary ocean productivity, Nature, 444, 752–755, 2006. Bennington, V., McKinley, G. A., Dutkiewicz, S., and Ullman, D.:
What does chlorophyll variability tell us about export and CO2 flux variability in the North Atlantic?, Global Biogeochem. Cy., 23, GB3002, doi:10.1029/2008GB003241, 2009.
Booth, B. B. B., Dunstone, N. J., Halloran, P. R., Andrews, T., and Bellouin, N.: Aerosols implicated as a prime driver of twentieth-century North Atlantic climate variability, Nature, 484, 228–232, doi:10.1038/nature10946, 2012.
Delworth, T. L. and Mann, M. E.: Observed and simulated multi-decadal variability in the Northern Hemisphere, Clim. Dynam., 16, 661–676, doi:10.1007/s003820000075, 2000.
Dima, M. and Lohmann, G.: A Hemispheric Mechanism for the Atlantic Multidecadal Oscillation, J. Climate, 20, 2706–2718, doi:10.1175/JCLI4174.1, 2007.
Dutkiewicz, S., Follows, M. J., and Parekh, P.: Interactions of the iron and phosphorus cycles: A three-dimensional model study, Global Biogeochem. Cy., 19, GB1021, doi:10.1029/2004GB002342, 2005.
Fay, A. R. and McKinley, G. A.: Global trends in surface ocean
pCO2from in situ data, Global Biogeochem. Cy., 27, 541–557, doi:10.1002/gbc.20051, 2013.
Follows, M. J., Dutkiewicz, S., and Ito, T.: On the solution of the carbonate system in ocean biogeochemistry models, Ocean Mod-ell., 12, 290–301, doi:10.1016/j.ocemod.2005.05.004, 2006. Gent, P. R. and McWilliams, J. C.: Isopycnal mixing in ocean
gen-eral circulation models, J. Phys. Oceanogr., 20, 150–155, 1990.
Hakkinen, S. and Rhines, P. B.: Shifting surface currents in the northern North Atlantic Ocean, J. Geophys. Res., 114, C04005, doi:10.1029/2008JC004883, 2009.
Kalnay, E., Kanamitsu, M., Kistler, R., Collins, W., Deaven, D., Gandin, L., Iredell, M., Saha, S., White, G., Woollen, J., Zhu, Y., Leetmaa, A., Reynolds, R., Chelliah, M., Ebisuzaki, W., Hig-gins, W., Janowiak, J., Mo, K. C., Ropelewski, C., Wang, J., Jenne, R., and Joseph, D.: The NCEP/NCAR 40-Year Reanalysis Project, B. Am. Meteorol. Soc., 77, 437–471, doi:10.1175/1520-0477(1996)077<0437:TNYRP>2.0.CO;2, 1996.
Kavvada, A. A., Ruiz-Barradas, A., and Nigam, S.: AMO’s struc-ture and climate footprint in observations and IPCC AR5 climate simulations, Clim. Dynam., 41–45, 1345–1364, 2013.
Kerr, R. A.: A North Atlantic Climate Pacemaker for the Centuries, Science, 288, 1984–1985, doi:10.1126/science.288.5473.1984, 2000.
Key, R. M., Key, R. M., Kozyr, A., Sabine, C. L., Lee, K., Wan-ninkhof, R., Bullister, J. L., Feely, R. A., Millero, F. J., Mordy, C., and Peng, T.-H.: A global ocean carbon climatology: Re-sults from Global Data Analysis Project (GLODAP), Global Bio-geochem. Cy., 18, GB4031, doi:10.1029/2004GB002247, 2004. Khatiwala, S., Primeau, F., and Hall, T.: Reconstruction of the his-tory of anthropogenic CO2concentrations in the ocean, Letters to Nature, 462, 346–349, doi:10.1038/nature08526, 2009. Knight, J. R., Allan, R. J., Folland, C. K., Vellinga, M., and Mann,
M. E.: A signature of persistent natural thermohaline circula-tion cycles in observed climate, Geophys. Res. Lett., 32, L20708, doi:10.1029/2005GL024233, 2005.
Körtzinger, A., Send, U., Lampitt, R. S., Hartman, S., Wal-lace, D. W. R., Karstensen, J., Villagarcia, M. G., Llinás, O., and DeGrandpre, M. D.: The seasonal pCO2 cycle at 49◦N/16.5◦W in the northeastern Atlantic Ocean and what it tells us about biological productivity, J. Geophys. Res., 113, C04020, doi:10.1029/2007JC004347, 2008.
Large, W. G., McWilliams, J. C., and Doney, S. C.: Oceanic vertical mixing: A review and a model with a nonlocal boundary layer parameterization, Rev. Geophys., 32, 363–403, 1994.
Latif, M., Roeckner, E., Botzet, B., Esch, M., Haak, H., Hagemann, S., Jungclaus, J., Legutke, S., Marsland, S., and Mikolajewicz, U.: Reconstructing, Monitoring, and Predicting Multidecadal-Scale Changes in the North Atlantic Thermohaline Circula-tion with Sea Surface Temperature, J. Climate, 17, 1605–1614, doi:10.1175/1520-0442(2004)017<1605:RMAPMC> 2.0.CO;2, 2004.
Latif, M., Böning, C., Willebrand, J., Biastoch, A., Dengg, J., Keenlyside, N., Schweckendiek, U., and Madec, G.: Is the Ther-mohaline Circulation Changing?, J. Climate, 19, 4631–4637, doi:10.1175/JCLI3876.1, 2006.
Le Quéré, C., Takahashi, T., Buitenhuis, E. T., Rödenbeck, C., and Sutherland, S. C.: Impact of climate change and variability on the global oceanic sink of CO2, Global Biogeochem. Cy., 24, GB4007, doi:10.1029/2009GB003599, 2010.
Löptien, U. and Eden, C.: Multidecadal CO2 uptake variabil-ity of the North Atlantic, J. Geophys. Res., 115, D12113, doi:10.1029/2009JD012431, 2010.
Marshall, J. C., Adcroft, A., Hill, C., Perelman, L., and Heisey, C.: A finite volume, incompressible Navier-Stokes model for studies of the ocean on parallel computers, J. Geophys. Res., 102, 5753– 5766, 1997a.
Marshall, J. C., Hill, C., Perelman, L., and Adcroft, A.: Hydrostatic, quasi-hydrostatic and non-hydrostatic ocean modeling, J. Geo-phys. Res., 102, 5733–5752, 1997b.
McKinley, G. A., Follows, M. J., and Marshall, J.: Mechanisms of air-sea CO2 flux variability in the equatorial Pacific and the North Atlantic, Global Biogeochem. Cy., 18, GB2011, doi:10.1029/2003GB002179, 2004.
McKinley, G. A., Takahashi, T., Buitenhuis, E., Chai, F., Chris-tian, J. R., Doney, S. C., Jiang, M.-S., Lindsay, K., Moore, J. K., Le Quéré, C., Lima, I., Murtugudde, R., Shi, L., and Wetzel, P.: North Pacific carbon cycle response to climate variability on seasonal to decadal timescales, J. Geophys. Res.-Oceans, 111, C07S06, doi:10.1029/2005JC003173, 2006.
McKinley, G. A., Fay, A. R., Takahashi, T., and Metzl, N.: Con-vergence of atmospheric and North Atlantic carbon dioxide trends on multidecadal timescales, Nat. Geosci., 4, 606–610, doi:10.1038/Ngeo1193, 2011.
Metzl, N., Corbière, A., Reverdin, G., Lenton, A., Takahashi, T., Olsen, A., Johannessen, T., Pierrot, D., Wanninkhof, R., Ólafs-dóttir, S. R., Olafsson, J., and Ramonet, M.: Recent acceleration of the sea surfacefCO2growth rate in the North Atlantic sub-polar gyre (1993–2008) revealed by winter observations, Global Biogeochem. Cy., 24, GB4004, doi:10.1029/2009GB003658, 2010.
Mikaloff-Fletcher, S. E., Gruber, N., Jacobson,A. R., Gloor, M., Doney, S. C., Dutkiewicz, S., Gerber, M., Follows, M., Joos, F., Lindsay, K., Menemenlis, D., Mouchet, A., Müller, S. A., and Sarmiento, J. L.: Inverse estimates of the oceanic sources and sinks of natural CO2 and the implied oceanic carbon transport, Global Biogeochem. Cy., 21, GB1010, doi:10.1029/2006GB002751, 2007.
Rayner, N. A., Parker, D. E., Horton, E. B., Folland, C. K., Alexan-der, L. V., Rowell, D. P., Kent, E. C., and Kaplan, A.: Global analyses of sea surface temperature, sea ice, and night marine air temperature since the late nineteenth century, J. Geophys. Res., 108, 4407, doi:10.1029/2002JD002670, 2003.
Sabine, C. L., Feely, R. A., Gruber, N., Key, R. M., Lee, K., Bullis-ter, J. L., Wanninkhof, R., Wong, C. S., Wallace, D. W. R., Tilbrook, B., Millero, F. J., Peng, T., Kozyr, A., Ono, T., and Rios, A. F.: The oceanic sink for anthropogenic CO2, Science, 305, 367–371, doi:10.1126/science.1097403, 2004.
Schuster, U., Watson, A. J., Bates, N., Corbière, A., González-Davila, M., Metzl, N., Pierrot, D., and Santana-Casiano, J. M.: Trends in North Atlantic sea-surface fCO2 from 1990 to 2006, Deep-Sea Res. Pt. II, 56, 620–629, doi:10.1016/j.dsr2.2008.12.011, 2009.
Schuster, U., McKinley, G. A., Bates, N., Chevallier, F., Doney, S. C., Fay, A. R., González-Dávila, M., Gruber, N., Jones, S., Krijnen, J., Landschützer, P., Lefèvre, N., Manizza, M., Mathis, J., Metzl, N., Olsen, A., Rios, A. F., Rödenbeck, C., Santana-Casiano, J. M., Takahashi, T., Wanninkhof, R., and Watson, A. J.: An assessment of the Atlantic and Arctic sea–air CO2fluxes,
1990–2009, Biogeosciences, 10, 607–627, doi:10.5194/bg-10-607-2013, 2013.
Séférian, R., Bopp, L., Swingedouw, D., and Servonnat, J.: Dy-namical and biogeochemical control on the decadal variabil-ity of ocean carbon fluxes, Earth Syst. Dynam., 4, 109–127, doi:10.5194/esd-4-109-2013, 2013.
Takahashi, T., Sutherland, S. C., Sweeney, C., Poisson, A., Metzl, N., Tilbrook, B., Bates, N., Wanninkhof, R., Feely, R. F., Sabine, C., Olafsson, J., and Nojiri, Y.: Global sea-air CO2flux based on climatological surface oceanpCO2, and seasonal biological and temperature effects, Deep-Sea Res. Pt. II, 49, 1601–1622, 2002. Takahashi, T., Sutherland, S. C., Wanninkhof, R., Sweeney, C., Feely, R. A., Chipman, D. W., Hales, B., Friederich, G., Chavez, F., Sabine, C., Watson, A., Bakker, D. C. E., Schuster, U., Metzl, N., Yoshikawa-Inoue, H., Ishii, M., Midorikawa, T., Nojiri, Y., Körtzinger, A., Steinhoff, T., Hoppema, M., Olafsson, J., Arnar-son, T. S., Tilbrook, B., Johannessen, T., Olsen, A., Bellerby, R., Wong, C. S., Delille, B., Bates, N. R., and de Baar, H. J. W.: Cli-matological mean and decadal change in surface oceanpCO2, and net sea-air CO2flux over the global oceans, Deep-Sea Res. Pt. II, 56, 554–577, doi:10.1016/j.dsr2.2008.12.009, 2009. Terry, L.: Evidence for multiple drivers of North Atlantic
multi-decadal climate variability, Geophys. Res. Lett., 39, L19712, doi:10.1029/2012GL053046, 2012.
Thomas, H., Friederike Prowe, A. E., Lima, I. D., Doney, S. C., Wanninkhof, R., Greatbatch, R. J., Schuster, U., and Corbière, A.: Changes in the North Atlantic Oscillation influence CO2 up-take in the North Atlantic over the past 2 decades, Global Bio-geochem. Cy., 22, doi:10.1029/2007GB003167, 2008.
Thompson, D. and Wallace, J. M.: Annular modes in the extratropi-cal circulation. Part I: Month-to-month variability, J. Climate, 13, 1000–1016, 2000.
Ullman, D. J., McKinley, G. A., Bennington, V., and Dutkiewicz, S.: Trends in the North Atlantic carbon sink: 1992–2006, Global Biogeochem. Cy., 23, GB4011, doi:10.1029/2008GB003383, 2009.
Von Storch, H. and Zwiers, F. W.: Statistical Analysis in Climate Research, Cambridge University Press, 484 pp., 1999.
Wang, C. and Dong, S.: Is the basin-wide warming in the North Atlantic Ocean related to atmospheric carbon diox-ide and global warming?, Geophys. Res. Lett., 37, L08707, doi:10.1029/2010GL042743, 2010.
Watson, A. J., Schuster, U., Bakker, D. C. E., Bates, N. R., Cor-bière, A., González-Dávila, M., Friedrich, T., Hauck, J., Heinze, C., Johannessen, T., Körtziner, A., Metzl, N., Olafsson, J., Olsen, A., Oschlies, A., Padin, X. A., Pfeil, B., Santana-Casiano, J. M., Steinhoff, T., Telszewski, M., Rios, A. F., Wallace, D. W. R., and Wanninkhof, R.: Tracking the Variable North At-lantic Sink for Atmospheric CO2, Science, 326, 1391–1393, doi:10.1126/science.1177394, 2009.