www.biogeosciences.net/12/6503/2015/ doi:10.5194/bg-12-6503-2015
© Author(s) 2015. CC Attribution 3.0 License.
Optimizing the impact of temperature on bio-hydrogen production
from food waste and its derivatives under no pH
control using statistical modelling
C. Arslan1,2,*, A. Sattar1,*, C. Ji1, S. Sattar3, K. Yousaf1, and S. Hashim4
1College of Engineering, Nanjing Agricultural University, Nanjing, China
2Department of Structures and Environmental Engineering, University of Agriculture, Faisalabad, Pakistan 3Environmental Sciences and Engineering, GC University Faisalabad, Pakistan
4Department of Hydrology and Water Resources, Hohai University, Nanjing, China *These authors contributed equally to this work.
Correspondence to: C. Ji ([email protected], [email protected])
Received: 6 July 2015 – Published in Biogeosciences Discuss.: 11 August 2015
Revised: 12 October 2015 – Accepted: 27 October 2015 – Published: 13 November 2015
Abstract. The effect of temperature on bio-hydrogen pro-duction by co-digestion of sewerage sludge with food waste and its two derivatives, i.e. noodle waste and rice waste, was investigated by statistical modelling. Experimental re-sults showed that increasing temperature from mesophilic (37◦C) to thermophilic (55◦C) was an effective mean for in-creasing bio-hydrogen production from food waste and noo-dle waste, but it caused a negative impact on bio-hydrogen production from rice waste. The maximum cumulative bio-hydrogen production of 650 mL was obtained from noodle waste under thermophilic temperature condition. Most of the production was observed during the first 48 h of incubation, which continued until 72 h of incubation. The decline in pH during this interval was 4.3 and 4.4 from a starting value of 7 under mesophilic and thermophilic conditions, respec-tively. Most of the glucose consumption was also observed during 72 h of incubation and the maximum consumption was observed during the first 24 h, which was the same dura-tion where the maximum pH drop occurred. The maximum hydrogen yields of 82.47 mL VS−1, 131.38 mL COD−1, and 44.90 mL glucose−1 were obtained from thermophilic food
waste, thermophilic noodle waste and mesophilic rice waste, respectively. The production of volatile fatty acids increased with an increase in time and temperature in food waste and noodle waste reactors whereas they decreased with tempera-ture in rice waste reactors. The statistical modelling returned good results with high values of coefficient of determination
(R2)for each waste type and 3-D response surface plots de-veloped by using models dede-veloped. These plots dede-veloped a better understanding regarding the impact of temperature and incubation time on bio-hydrogen production trend, glu-cose consumption during incubation and volatile fatty acids production.
1 Introduction
addition can maintain a specific pH and nutrimental required for optimum bio-hydrogen production, but it also increases the cost of production (Nielsen et al., 2001; Han, 2004). The cost of production can be reduced by adding sewage sludge as a source of Clostridium mix culture (Fang et al., 2006). Nutritional deficiency in food waste was also bal-anced by adding sewage sludge that made food waste more suitable for bio-hydrogen production (Shin et al., 2004). It means that integrated waste management can be done at a wastewater treatment plant by co-digestion of sewage sludge and food waste. Although sewerage sludge is a good source of Clostridium mix culture, it also contains hydrogen con-sumers like methanogens. Heat treatment is mostly opted to deactivate hydrogen consumers. The traditional method of placing sewage sludge in boiling water is now no longer in practice and is replaced by microwave heating that pro-vide more uniform heating as compared to the boiling water method (Luo et al., 2010; Wang et al., 2011; Duangmanee et al., 2007). The temperature and time for heat treatment var-ied from 75 to 121◦C for 15 min to 2 h, but 100◦C for 15 min was mostly reported (Li and Fang, 2007; Fang et al., 2006).
Carbohydrate-rich wastes like food waste are suitable for Clostridium species as stoichiometrically it can produce two moles of hydrogen from one mole of hexose (Payot, 1998). Theoretically, 553 mL hydrogen can be produced by 1 g of polysaccharides if it is totally converted into acetate. The highest practical yield of 346 mL g−1carbohydrate was achieved by Fang et al. (2006) by using rice as a source of carbohydrate (78 %), pre-treated sewage sludge as a source of Clostridium and adding a variety of nutrients. Rice waste and noodle waste has 40 % share in the total food waste pro-duced in China (Shiwei, 2005). The noodle waste is also rich in carbohydrates, but still there is no research reported on bio-hydrogen production from noodle waste.
Temperature and pH have a great impact on the smooth running of AD (Saraphirom and Reungsang, 2010). Most of the studies reported bio-hydrogen production under mesophilic as well as thermophilic conditions and few were reported under psychrophilic conditions. Lu et al. (2011) developed microbial electrolysis cells (MECs) that could be operated at 9◦C by using Geobacter psychrophilus as dominating population and achieved a hydrogen yield of 0.62 m3H2m−3d−1. Heidrich et al. (2013) further modified
MECs to a pilot-scale MEC and achieved bio-hydrogen pro-duction of 0.015 LH2L−1d−1at 25◦C. On the other end,
un-der mesophilic and thermophilic conditions, there is no need for such sophisticated technology and a better bio-hydrogen yield can be achieved by simple reactors or by lab scale batch experiments. The temperature shift from mesophilic to ther-mophilic conditions can change the rate of hydrogen pro-duction during anaerobic digestion (Li and Liu, 2012; Sari-pan and Reungsang, 2014). Whereas hyper-thermophilic pro-vide better pathogenic destruction but it also decreased the bio-hydrogen production (Sahlström, 2003; Yokoyama et al., 2007). Keeping the same temperature but changing the initial
pH from 7 to 8, the bio-hydrogen yield was changed from 64.48 to 55 mL VS−1 under no pH control conditions (Lin
et al., 2013b; Nathao et al., 2013). The same yield was in-creased to 70 mL VS−1 when pH was manually controlled for food waste under thermophilic conditions, which repre-sents the impact of pH management (Shin et al., 2004). The hydrogen production by anaerobic digestion will be further improved if pH lies in the range of 5 to 6 (Radjaram and Sar-avanane, 2011). The pH of food waste lies in the range of 4 to 5, which further decreases by the production of volatile fatty acids (VFA) to such a level that can inhibit the bacte-rial growth. The pH can be controlled by automatic pH con-trollers, addition of nutrients and buffers, manual monitor-ing and control (Yasin et al., 2011; Zhu et al., 2008; Kim et al., 2004). But all these methods increased the cost of opera-tion. Along with cost, maintaining pH at specific point is not suitable especially when mix culture is used as the response of different microbial stream could be different to same pH level. So, by co-digestion, the pH of the anaerobic digestion process can be improved and it can be further adjusted to a desired initial value by adding HCl or NaOH. After adjusting the desired initial pH under co-digested conditions, the bio-hydrogen production can be achieved under no pH control conditions, which can reduce the cost of operation (Fang et al., 2006).
The yield of bio-hydrogen is calculated by dividing the cumulative hydrogen produced by VS, chemical oxygen de-mand (COD) or glucose (Chen et al., 2006; Dong et al., 2009; Fang et al., 2006). The yields are misleading if calculated in terms of added or start up values of VS, COD and glucose as it seems quite impossible that the whole of added material is converted into hydrogen. In this regard the removal quan-tities of such parameters are the best option to calculate the yield.
The optimization played an important role in bio-hydrogen production and its application with respect to incubation time in combination with temperature is an important factor to get the maximum output with minimum intake of energy. In or-der to achieve this purpose, statistical modelling is an impor-tant tool to study the impact within the experimental range and can be further used for the development of response sur-face plots (Jo et al., 2008).
2 Material and methods
2.1 Batch experiment for bio-hydrogen production The waste was collected from student dining at the Nan-jing Agricultural University. The food left on the plates after lunch/dinner consisted of rice, noodles, meat, bones, potato and other vegetables. At first, bones and other foreign mate-rials were removed and left over waste was treated as food waste. The food waste was then ground in a meat grinder with an equal amount of water and a resultant slurry was used for bio-hydrogen production (Reungsang et al., 2013). Rice and noodles were removed from collected waste and converted into slurry in the same way opted for food waste. The sludge was obtained from a settling channel and it was washed with tap water and sieved to remove foreign mate-rials (Nathao et al., 2013). The sludge was placed in a pre-heated oven at 100◦C for 15 min, so that hydrogenotrophic methanogens could be deactivated (Li and Fang, 2007). Some important properties of feed stock and sewerage sludge are enlisted in Table 1.
Two series of experiments were conducted in duplicate in 550 mL digesters with working volume of 400 mL (Hu et al., 2014). In order to achieve 10 % initial TS concentration, wa-ter was added along with feedstock and sewerage sludge in the digesters. The feedstock and sewerage sludge were added in equal proportion. As the pH of food waste was not so high even after co-digestion with sewage sludge, the initial pH within reactor was less than 7 which was carefully raised to 7 with the help of 3M NaOH solution (Zhu et al., 2008). Series I was to observe the bio-hydrogen production under mesophilic temperature (37◦C) and series II was to investi-gate the impact of thermophilic temperature (55◦C) on bio-hydrogen production potential of feed stock in comparison with that produced under mesophilic conditions.
2.2 Chemical analysis
The volume of bio-hydrogen produced was measured by displacement of 3 % NaOH solution. This concentration of NaOH can remove other gases and water vapours (Fang et al., 2006; Lin et al., 2013a; Saraphirom and Reungsang, 2010). Other parameters like TS, VS, COD, VFA and alka-linity were measured according to standard methods (APHA, 2005). For glucose detection, phenol sulphuric acid method was used (Lay and Fan, 2003).
2.3 Assay methods
Modelling of hydrogen production was done by Modified Gompertz equation (MGE), which was used for cumulative bio-hydrogen measurement (Ramos et al., 2012)
H=Pexp
−exp
R
me
P (λ−t )+1
, (1)
where H, t, P, Rm, λ and e represent cumulative
hydrogen production (mL), incubation time (h), bio-hydrogen production potential, maximum bio-bio-hydrogen pro-duction rate (mL h−1), lag phase duration (h) and 2.71828 respectively. The values ofH,t,P,Rmwere solved by using
curve fitting tool in (ver. 2010a).
In this study, the effects of different types of food waste, temperature and incubation time on bio-hydrogen and VFA production as well as on glucose consumption, were analysed by full quadratic model as shown below (Kim et al., 2008; Jo et al., 2008)
Y=a0+
Xn
i=1aiXi+
Xn
i=1aiiX 2
i
+Xn
i=1
Xn
i<j=2aijXiXj, (2)
whereXi andXj are the controlled parameters, which in-fluence Y and a0, aii, aij, are the offset term, linear and
quadratic coefficients respectively. As the waste types are different, so the above model is used, including waste type (n=3) and excluding waste type (n=2).
3 Results and discussion
3.1 Effect of temperature and time on bio-hydrogen production
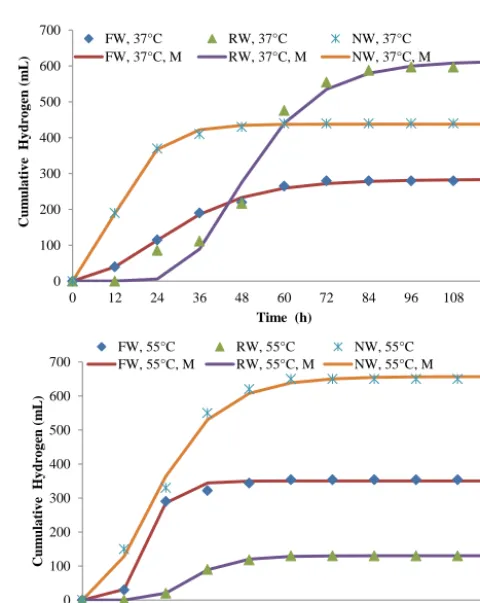
A comparison of actual and MGE modelled bio-hydrogen production under mesophilic and thermophilic conditions is shown in Fig. 1, which shows an early start of bio-hydrogen production in food waste and noodle waste as compared to rice waste. This early production was quantified with the help of MGE asλshown in Table 2, which clearly shows that the highest lag phase belongs to rice waste under both tempera-tures. The bio-hydrogen production in food waste continued until 72 h of incubation and this time period for food waste was higher than that observed for noodle waste, but still the cumulative bio-hydrogen production of food waste was the lowest as compared to the other two waste types. Looking at theRm values, it is clear that food waste has the lowest
mesophilicRmvalue of 6.688 mL h−1among all three wastes
that ultimately caused the cumulative bio-hydrogen produc-tion to decrease. Only theRm value is not responsible for
higher yield as the highest mesophilicRm of 21.05 mL h−1
belongs to noodle waste, but the cumulative bio-hydrogen production of noodle waste was found to be smaller than rice waste havingRmvalue of 16.52 mL h−1. The rice waste
Table 1. Properties of test materials.
Parameter Unit Sludge Food waste Rice waste Noodles waste
TS % 58.59 30.32 39.88 31.54
VS % 2.87 26.9 39.30 28.51
Glucose g L−1 2.49 65.77 79.65 63.73
COD g L−1 50 147.5 105 132
Total Alkalinity mg L−1 3700 550 500 450
VFA (mg L−1) mg L−1 13 950 2475 9000 1500
pH – 7.1 4.5 5.3 4.3
close to each other. It can be seen in Fig. 2 that the differ-ence in active duration was due to pH as it was dropped from 7 to 4.6 in the noodle waste reactor during the first 12 h un-der mesophilic temperature and it was further dropped to 4.4 whereas a pH drop in thermophilic reactor was 5.3 to 4.9 in the same duration. On the other end, pH drop in rice waste re-actor under thermophilic conditions was higher as compared to mesophilic temperature, which ultimately reduced the cu-mulative bio-hydrogen production that was found in agree-ment with the finding of Fang et al. (2006). The reduction in bio-hydrogen production with low pH is due to homoaceto-genic bacteria, which are more active at low pH (Ramos et al., 2012; Schiel-Bengelsdorf and Dürre, 2012). The trend for pH drop with temperature in food waste reactors was opposite to other reactors and Rm increased to a value of
26.42 mL h−1when temperature was shifted from mesophilic to thermophilic. This increase is due to Thermoanaerobac-terium thermosaccharolyticum that grow at higher tempera-ture in food waste and produce more hydrogen (Shin et al., 2004). As a whole,Rmvalues found in the present study were
higher than those reported in previous studies (Fang et al., 2006; Ramos et al., 2012).
The volume of bio-hydrogen production with time was used to fit in a quadratic model by using solver function MS Excel and the resultant equation obtained was
Y =202.83+56.86x1+73.38x2+8.5x3−22.5x12 +243.25x22−113.8x32−23.75x1x2−1.86x1x3
−30.38a9x2x3(R2=0.5576, F =19.921), (3)
where Y is the predicted bio-hydrogen production; x1, x2
andx3are the coded values of incubation time, waste type
and temperature respectively. There is a poor relationship be-tween actual and predicted value as the coefficient of deter-mination (R2)was calculated to be 0.5576, which can ex-plain only 55.76 % variability of the response. The diversity among waste type is the main reason for such a low value and this value could be at a higher level if the same waste was used in different proportions as reported in other studies (Kim et al., 2008; Jo et al., 2008). To overcome this problem, quadratic model was again developed for each waste type and the following equations were obtained:
0 100 200 300 400 500 600 700
0 12 24 36 48 60 72 84 96 108 120
Cum
ula
tiv
e
H
y
dro
g
en
(m
L
)
Time (h)
FW, 37°C RW, 37°C NW, 37°C
FW, 37°C, M RW, 37°C, M NW, 37°C, M
0 100 200 300 400 500 600 700
0 12 24 36 48 60 72 84 96 108 120
Cum
ula
tiv
e
H
y
dro
g
en
(m
L
)
Time (h)
FW, 55°C RW, 55°C NW, 55°C
FW, 55°C, M RW, 55°C, M NW, 55°C, M
Figure 1. Mesophilic and thermophilic bio-hydrogen production
with time.
Food waste:Y=281.75+57.25x1+62.25x2
−22x12−25.25x1x2(R2=0.9858F =278.06) (4a)
Noodle waste:Y =472.5+97.5x1+42.5x2
−25x12+62.5x1x2(R2=0.9011F=36.44) (4b)
Rice waste: Y =167.5+71.5x1−49.5x2
−43x12−16.5x1x2(R2=0.7922F=15.26), (4c)
wherex1andx2are the coded values of time and
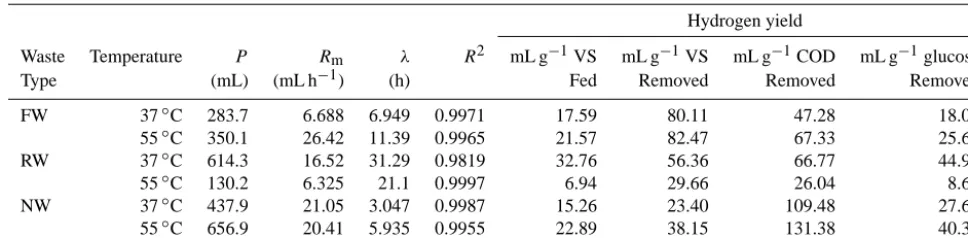
[image:4.612.308.548.209.510.2]Table 2. Kinetic parameters and bio-hydrogen yield.
Hydrogen yield
Waste Temperature P Rm λ R2 mL g−1VS mL g−1VS mL g−1COD mL g−1glucose
Type (mL) (mL h−1) (h) Fed Removed Removed Removed
FW 37◦C 283.7 6.688 6.949 0.9971 17.59 80.11 47.28 18.02
55◦C 350.1 26.42 11.39 0.9965 21.57 82.47 67.33 25.63
RW 37◦C 614.3 16.52 31.29 0.9819 32.76 56.36 66.77 44.90
55◦C 130.2 6.325 21.1 0.9997 6.94 29.66 26.04 8.68
NW 37◦C 437.9 21.05 3.047 0.9987 15.26 23.40 109.48 27.65
[image:5.612.57.539.240.421.2]55◦C 656.9 20.41 5.935 0.9955 22.89 38.15 131.38 40.33
Table 3. Comparison of bio-hydrogen yield.
Feed Inoculum Yield Initial Optimum pH Temperature References
stock pH pH Management (◦C)
Food waste Sludge 64.48 mL H2/VSfed 7 4.8–6.4 Not controlled 37 Lin et al. (2013b)
Food waste Sludge 250 ml H2/VSremoved 6.5 6.5–5.2 Not controlled 26 Tawfik et al. (2011)
Food waste Kitchen 148±42 mL H2/CODremoved 5±03 5±0.3 Manually Controlled 40 Tawfik and El-Qelish (2014)
wastewater
Food waste Sludge 70 mL H2/VS 5.5 5.5 Manually Controlled 55 Shin et al. (2004)
Rice waste Sludge 71 mL H2/VS 7 7 Not controlled 37 Okamoto et al. (2000)
Rice waste Sludge 134 mL H2/VS 5.5 5.5 Manually Controlled 37 Dong et al. (2009)
Food waste Sludge 55 mL H2/VS 7 6 Not controlled 55 Nathao et al. (2013)
Rice waste Sludge 346 mL H2g−1carbohydrates 4.5 4.5 Manually Controlled 37 Fang et al. (2006)
Noodle Industry Anaerobic 1.47 mol H2mol−1hexose 4.5–8.5 5.2 Controlled 35 Mizuno (2000)
wastewater microflora
Food waste Sludge 44.83 mL H2g−1COD 8 8–4.5 Not Controlled 55 Wongthanate and
Chinnacotpong (2015)
OFMSW Sludge 205 ml H2g−1VS added 5.5 5.5 Automatic pH controller 55 Chu et al. (2008)
Food waste Sludge 82.47 mL g−1VSremoved 7 7–4.4 Not Controlled 55 This study
Noodle waste Sludge 131.38 mL g−1CODremoved 7 7–4.4 Not Controlled 55 This study
Rice waste Sludge 44.90 mL g−1glucoseremoved 7 7–4.3 Not Controlled 37 This study
3.5 4 4.5 5 5.5 6 6.5 7 7.5
0 12 24 36 48 60 72 84 96 108 120
p
H
Dr
o
p
(
g
/L
)
Time (h)
FW, 37°C RW, 37°C NW, 37°C FW, 55°C RW, 55°C NW, 55°C
Figure 2. Effect of temperature on pH drop during incubation.
is much higher as compared to other values; this is because of the coefficient of determination that explained 98.58 % vari-ability. The quadratic model obtained from rice waste was not perfectly fit, but it can better explain results as compared to the model developed for all waste types as a whole.
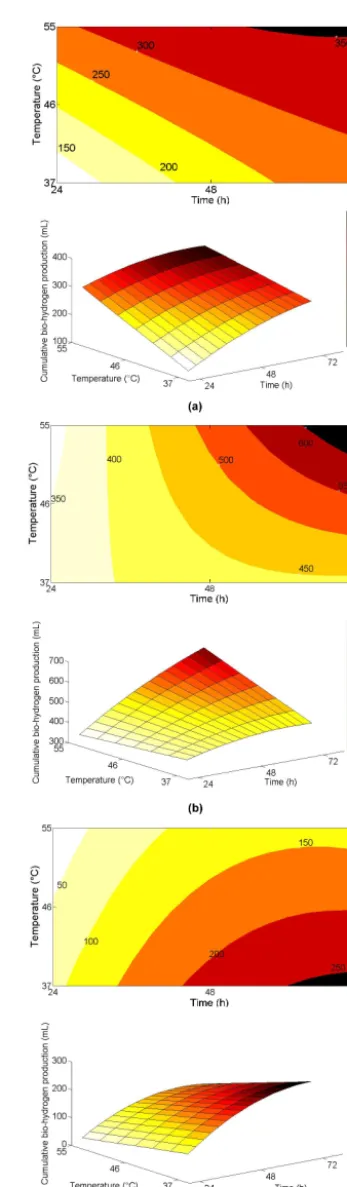
The three-dimensional (3-D) response surfaces and two-dimensional (2-D) contours were developed within the ex-perimental range for each waste type by taking bio-hydrogen
production as a response by using the above-mentioned equa-tions. The 3-D and 2-D curves of the calculated response showed the interaction of incubation time and temperature in Fig. 3a–c. For food waste, it is clear that the gas produc-tion increases with time and temperature from 115 mL at the starting end to 354 mL at the extreme modelled conditions. Between 0 and 24 h of incubation, bio-hydrogen production increased with an increase in temperature for food waste, i.e. 115 mL of bio-hydrogen was produced at 37◦C that
are important for production under mesophilic temperature, which is in agreement with findings of Shin et al. (2004). Although noodle waste also produced more bio-hydrogen at elevated temperature, the time effect was opposite to that ob-served for food waste. The bio-hydrogen production in noo-dle waste during 0–24 h was 350 mL at 37◦C that was 5.4 and 10.81 % decreased at 46 and 55◦C, respectively. But in the next 24–72 h, there was an increase of 178.57 and 357.14 % at 46 and 55◦C, respectively .
As far as rice waste was concerned, temperature has a neg-ative impact on bio-hydrogen production. Between 24 to 48 h, the bio-hydrogen production in rice waste was 131 mL at 37◦C, 114.5 mL at 46◦C and 98 mL at 55◦C. In next 24h, the bio-hydrogen production was reduced to 65.65 %, 75.11 % and 87.76 % at 37◦C, 46◦C and 55◦C, respectively. The reduction in bio-hydrogen production for rice waste was in agreement with previous findings (Fang et al., 2006). The 2-D contours in Fig. 3b and c differentiate the impact of tem-perature with time on bio-hydrogen production for noodle waste and rice waste as the contour patterns are quite oppo-site to each other.
3.2 Effect of temperature on bio-hydrogen yield The bio-hydrogen yield was calculated by dividing the P value on Table 2 with VSfed, VSremoved, CODremoved and
glucoseremoved. The bio-hydrogen yield calculated on the
ba-sis of VSfedlay in the range achieved by Lin et al. (2013b)
and temperature impact on yield was the same as observed forP. The yield on the basis of VSconsumed represented
up-take efficiency of VS during anaerobic digestion. The in-crease in P with temperature for food waste was 23.41 % whereas the yield increased by 2.86 % only that indicated the efficient removal of VS at higher temperature. The bio-hydrogen yield calculated for FW on the basis of VSremoved
lay in the range used by Kim et al. (2004). Using the same scale of VSremoved, bio-hydrogen yield for rice waste
de-creased 47.37 % with an increase in temperature, whereas the decrease inP was 78.81 % that represented a decrease in re-moval of VS at elevated temperature which was in agreement with the findings of Fang et al. (2006). As compared to food waste and noodle waste, the increase in P and yield calcu-lated by VSremovedwas close, but it revealed the fact that VS
removal efficiency slightly decreased at an elevated temper-ature.
When the yield measuring scale was shifted from VSremovedto CODremoved, the results represented quite a
dif-ferent picture of temperature impact. The increase in temper-ature from 37 to 55◦C increased 42.41 % bio-hydrogen yield calculated on the basis of CODremoved for food waste. The
[image:6.612.339.513.59.653.2]increase in bio-hydrogen production due to same increase in temperature from 37 to 55◦C was 23.37 %. Such a difference in yield and production increment represented a decrease in COD removal efficiency at an elevated temperature for food waste. For rice waste, the decrease in yield was 61 %, which
Figure 3. Three-dimensional response plots for bio-hydrogen
0 10 20 30 40 50 60
0 24 48 72 96 120
Glu
co
se
(g
/L
)
Time (h)
[image:7.612.49.289.70.189.2]FW, 37°C RW, 37°C NW, 37°C FW, 55°C RW, 55°C NW, 55°C
Figure 4. Glucose consumption during incubation under mesophilic
and thermophilic temperature.
was close to a 78 % decrease inP. Increasing temperature also increased the yield for noodle waste to 20 %, which was smaller than the increase inP, representing a higher rate of COD removal at elevated temperature. All the bio-hydrogen yields calculated on the basis of CODremovedlay in the range
calculated by Tawfik and El-Qelish (2014).
Glucose removal efficiency for food waste decreased with an increase in temperature as the increase in P was 23.41 against 42.19 % when bio-hydrogen yield was calculated on the basis of glucoseremoved. Whereas the change in yield for
noodle waste and rice waste was close to the change observed for P. The decrease in glucose concentration was close to that observed in previous studies (Abdeshahian et al., 2014; Kapdan and Kargi, 2006). The yield calculated on a glu-cose basis was further studied on a daily basis and it was observed that the highest yield of 33 mL glucose−removed1 for 0–24 h duration belonged to noodle waste under mesophilic condition. During the next 24 h period, the highest yield of 400 mL glucose−removed1 was achieved by noodle waste un-der thermophilic temperature, which was close to the find-ing of Fang et al. (2006) but still smaller than the theo-retical yield of 553 mL g−1carbohydrate. The yield for rice waste also increased under both temperatures but it was much higher at mesophilic as 184.37 mL glucose−removed1 against 24.99 mL glucose−removed1 at thermophilic temperature. During 24 to 72 h of incubation, the yield in all reactors reduced ex-cept noodle waste under mesophilic conditions. As a whole, 24–48 h duration of incubation was found to be more impor-tant for bio-hydrogen production from glucose. The produc-tion of glucose modelled by quadratic equaproduc-tion using
previ-ously defined notation as
Y=13.504−0.604x1+0.095x2−0.831x3+0.066x21 −5.469x22+0.609x1x2+0.238x1x3−1.131x2x3
(R2=0.6959F =64.07). (5)
As the coefficient of determination is not so high so quadratic modelling was done for each waste type as
Food waste: Y =7.820−3.561x1+0.412x2
+1.554x12+1.094x1x2(R2=0.9713F =270.81) (6a)
Noodle waste: Y =8.697−1.601x1+0.055x2
+0.439x12−0.307x1x2(R2=0.7994F =31.89) (6b)
Rice Waste: Y =21.817−3.1x1−0.938x2
−0.323x12−0.354x1x2(R2=0.715F =20.07). (6c)
The 3-D response plots and contours for glucose removal were developed by the above models (Fig. 5). It was ob-served that in the first 24 h of incubation, the rate of utiliza-tion of glucose increased, with an increase in temperature up to 55◦C for food waste, decreased for noodle waste, and
re-mained almost unaffected for rice waste. The sequence for glucose utilization rate was in the rank of NW > FW > RW. Between 24 and 48 h, glucose utilization rate decreased for food waste and increased for noodle and rice waste under mesophilic and thermophilic conditions. Between 48 and 72 h, rate of utilization remained the same as previous one but rank was slightly changed as FW > RW > NW. With an increase in temperature, between 24 and 72 h, the rate of glu-cose utilization decreased for food waste but increased for noodle and rice waste. As a whole, the glucose consumption at the end of incubation was higher at 37◦C as compared to 55◦C for food waste. At the end of incubation, noodle waste and rice waste represented quite opposite picture of glucose consumption with temperature as observed for food waste. The contours represented a better understanding for glucose consumption and the contour varied in different manners for each waste type as shown in Fig. 5.
3.3 Effect of temperature on VFA production
The VFA revealed an increase with time as reported by Lin et al. (2013b), which is shown in Fig. 6. In the present study, it is observed that VFA in food waste and noodle waste increased with an increase in temperature from 37 to 55◦C but decreased for rice waste that lay in the range
Figure 5. Three-dimensional response plots for glucose
consump-tion (a) Food waste, (b) Noodle waste, (c) Rice waste.
0 1000 2000 3000 4000 5000 6000 7000 8000 9000
0 24 48 72 96 120
VFA
(
g
/L
)
Time (h)
[image:8.612.308.548.67.192.2]FW, 37°C RW, 37°C NW, 37°C FW, 55°C RW, 55°C NW, 55°C
Figure 6. Increase in VFA concentration with time under
mesophilic and thermophilic temperatures.
this stage by homoacetogenic bacteria that reached up to such a level where bio-hydrogen production was not feasible under thermophilic conditions, whereas the VFA production in the mesophilic FW reactor was much smaller than that observed under thermophilic reactor, because of which production continued in the mesophilic reactor (Zhang et al., 2014). The higher concentration of VFA together with low pH can be inhibitory to bacteria that can cause unfavourable physical changes in the cell. By such physical changes, excessive energy is required to pump ions and that energy can be available at a higher temperature. So it increased the yield at elevated temperatures, as observed in the case of food waste and noodle waste (Gottschalk, 1986; Zoetemeyer, 1982; Switzenbaum, 1990). The higher concentration of VFA can also be used as an indicator for higher production of bio-hydrogen as observed by Dong et al. (2009). In the present study, the order to VFA production and cumulative bio-hydrogen production was the same i.e. NW55◦C> RW37◦C> NW37◦C> FW55◦C> FW37◦C> RW37◦C.
The quadratic model was tried to fit for VFA production data in the same way as opted for glucose and the resultant equation was as follows:
Y=1795.82+686.16x1−300.51x2+641.13x3 +4.94x12+658.51x22+127.30x1x2+33.26x1x3
−319.25x2x3(R2=0.5975F =41.56). (7)
Food waste: Y =2362.67+458.15x1+545.05x2 −12.88x21+2.76x22−22.42x1x2
(R2=0.8654F =51.44) (8a)
Noodle waste: Y=4196.48+1464.56x1 +772.876x2−163.19x21+224.98x1x2
(R2=0.8415F =42.48) (8b)
Rice waste: Y =3258.94+756.62x1−1147.22x2 −303.1x21−390.28x1x2
(R2=0.9430F =132.37). (8c)
The 3-D response plots and contours for VFA production on the basis of the above models are shown in Fig. 7. The 3-D contours for food waste and noodle waste seem almost same but the contour lines for both varied in a different man-ner. Although the production of VFA increased with time and temperature in all reactors but the intensity of change is different for each waste type as observed in Fig. 7. It can be observed from Fig. 7 that the production of VFA has in-creased for food waste and noodle waste when temperature was increased from 37 to 55◦C. Although with time, the VFA concentration increased, but the rate by which VFAs produced was decreased with time, i.e. VFA production be-tween 24 and 48 h was greater than that produced bebe-tween 48 and 72 h and this trend continued until 120 h for food waste and noodle waste. As a whole, more VFA was pro-duced between 24 and 120 h under mesophilic temperature as compared to thermophilic temperature in food waste re-actor, but as a whole, mesophilic VFA production was found to be less than that of thermophilic as reported by Gadow et al. (2012). It is because of the fact that between 0 and 24 h du-ration, thermophilic VFA production was much higher than that produced under mesophilic conditions in food waste. By controlling the VFA production during this interval, the yield of bio-hydrogen can be increased for FW as it stopped too early in thermophilic food waste reactor as compared to mesophilic food waste reactor. Thermophilic VFA produc-tion was higher than mesophilic VFA producproduc-tion in noodle waste reactor. On the other end, mesophilic VFA production was higher than that produced under thermophilic conditions for RW and VFA increased with time in the same manner as observed for food waste under 40◦C. Between 40 and 55,◦C, the VFA trend for rice waste remained the same as of food waste until 96 h after which it started to decrease until 120 h.
4 Conclusion
[image:9.612.341.511.81.676.2]Food waste and its two major derivatives, i.e. noodle waste and rice waste, were co-digested with sewerage sludge to produce bio-hydrogen with an initial pH of 7 under mesophilic and thermophilic conditions. The pH was not
Figure 7. Three-dimensional response plots for VFA production (a)
controlled throughout the incubation. The most effective VS removal was observed in noodle waste reactor that pro-duced the highest experimental cumulative bio-hydrogen of 656.5 mL under thermophilic conditions. The food waste possessed the highest bio-hydrogen yield calculated on the basis of VSremoved that represents an efficient conversion of
VS into bio-hydrogen. The increase in temperature within the studied range increased the bio-hydrogen production in food waste and noodle waste reactors. The rice waste re-actor represented the negative impact of increasing temper-ature on bio-hydrogen and VFA production. Thermophilic conditions should be preferred for bio-hydrogen production as most of the time food waste is used as feed stock. The quadratic modelling returned good results that were close to experimental ones, when it was done for each waste type of bio-hydrogen, VFA production and glucose removal. The response surface plots and contour plots within the experi-mental range adequately explained the effect of temperature and time on studying parameters and helped to develop better understanding regarding the variation among the studied pa-rameters especially when the different treatments represented similar trends. VFA production in rice waste reactor changes the trend after 40◦C that was identified only due to quadratic modelling. The lowest limit of pH for bio-hydrogen produc-tion was identified as 4.3 and 4.4 for mesophilic and ther-mophilic temperatures respectively.
Author contributions. C. Arslan and A. Sattar, designed the re-search and performed all the lab works. C. Ji provided the financial and technical support for designing and conducting research as well as supervised the whole research process. S. Sattar developed and customized 3-D surface plots and assisted in manuscript prepara-tion. K. Yousaf assisted the lab works and analysis. S. Hashim per-formed the statistical analysis. C. Arslan wrote the manuscript with comments from all authors and A. Sattar finalized the manuscript under the supervision and guidelines of C. Ji.
Acknowledgements. We thank K. Chen for providing lab facilities; H. Fang, Y. P. Huang and J. B. Kang for their help during lab work; I. A. Mari for field work and technical assistance; F. A. Chandio and F. Ahmad for helpful discussion and critical review. We extend our thank to Higher Education Commission, Pakistan, China Scholarship council and the College of Engineering, Nanjing Agricultural University, Nanjing for supporting and providing research facilities for this study.
Edited by: T. Treude
References
Abdeshahian, P., Al-Shorgani, N. K. N., Salih, N. K., Shukor, H., Kadier, A., Hamid, A. A., and Kalil, M. S.: The production of
biohydrogen by a novel strain Clostridium sp. YM1 in dark fer-mentation process, Int. J. Hydrogen Energ., 39, 12524–12531, 2014.
APHA: Standard Methods for the Examination of Water and Wastewater., 25 Edn., American Public Health Association, Washington, D.C., 94–100, 2005.
Chen, W.-H., Chen, S.-Y., Kumar Khanal, S., and Sung, S.: Kinetic study of biological hydrogen production by anaerobic fermenta-tion, Int. J. Hydrogen Energ., 31, 2170–2178, 2006.
Chu, C.-F., Li, Y.-Y., Xu, K.-Q., Ebie, Y., Inamori, Y., and Kong, H.-N.: A pH-and temperature-phased two-stage process for hydro-gen and methane production from food waste, Int. J. Hydrohydro-gen Energ., 33, 4739–4746, 2008.
Dong, L., Zhenhong, Y., Yongming, S., Xiaoying, K., and Yu, Z.: Hydrogen production characteristics of the organic fraction of municipal solid wastes by anaerobic mixed culture fermentation, Int. J. Hydrogen Energ., 34, 812–820, 2009.
Duangmanee, T., Padmasiri, S., Simmons, J., Raskin, L., and Sung, S.: Hydrogen production by anaerobic microbial communities exposed to repeated heat treatments, Water Environ. Res., 79, 975–983, 2007.
Fang, H. H., Li, C., and Zhang, T.: Acidophilic biohydrogen pro-duction from rice slurry, Int. J. Hydrogen Energ., 31, 683–692, 2006.
Gadow, S., Li, Y.-Y., and Liu, Y.: Effect of temperature on contin-uous hydrogen production of cellulose, Int. J. Hydrogen Energ., 37, 15465–15472, 2012.
Gottschalk, G.: Bacterial metabolism, 2nd Edn., Springer, New York, 1986.
Han, H. K. and Shin, S. H.: Performance of an innovative two-stage process converting food waste to hydrogen and methane, J. Air Waste Manage., 54, 242–249, 2004.
Heidrich, E., Dolfing, J., Scott, K., Edwards, S., Jones, C., and Cur-tis, T.: Production of hydrogen from domestic wastewater in a pilot-scale microbial electrolysis cell, Appl. Microbiol. Biot., 97, 6979–6989, 2013.
Hu, C. C., Giannis, A., Chen, C.-L., and Wang, J.-Y.: Evaluation of hydrogen producing cultures using pretreated food waste, Int. J. Hydrogen Energ., 39, 19337–19342, 2014.
Jo, J. H., Lee, D. S., Park, D., Choe, W.-S., and Park, J. M.: Opti-mization of key process variables for enhanced hydrogen produc-tion by Enterobacter aerogenes using statistical methods, Biore-source Technol., 99, 2061–2066, 2008.
Kapdan, I. K. and Kargi, F.: Bio-hydrogen production from waste materials, Enzyme Microb. Tech., 38, 569–582, 2006.
Kim, S.-H., Han, S.-K., and Shin, H.-S.: Feasibility of biohydrogen production by anaerobic co-digestion of food waste and sewage sludge, Int. J. Hydrogen Energ., 29, 1607–1616, 2004.
Kim, S.-H., Han, S.-K., and Shin, H.-S.: Optimization of continu-ous hydrogen fermentation of food waste as a function of solids retention time independent of hydraulic retention time, Process Biochem., 43, 213–218, 2008.
Lay, J.-J. and Fan, K.-S.: Influence of chemical nature of organic wastes on their conversion to hydrogen by heat-shock digested sludge, Int. J. Hydrogen Energ., 28, 1361–1367, 2003.
Li, Q. and Liu, C.-Z.: Co-culture of Clostridium thermocellum and Clostridium thermosaccharolyticum for enhancing hydrogen production via thermophilic fermentation of cornstalk waste, Int. J. Hydrogen Energ., 37, 10648–10654, 2012.
Lin, Y., Wang, D., Li, Q., and Xiao, M.: Mesophilic batch anaero-bic co-digestion of pulp and paper sludge and monosodium glu-tamate waste liquor for methane production in a bench-scale di-gester, Bioresource Technol., 102, 3673–3678, 2011.
Lin, Y., Liang, J., Wu, S., and Wang, B.: Was pretreatment beneficial for more biogas in any process? Chemical pretreatment effect on hydrogen–methane co-production in a two-stage process, J. Ind. Eng. Chem., 19, 316–321, 2013a.
Lin, Y., Wu, S., and Wang, D.: Hydrogen-methane production from pulp & paper sludge and food waste by mesophilic–thermophilic anaerobic co-digestion, Int. J. Hydrogen Energ., 38, 15055– 15062, 2013b.
Lu, L., Ren, N., Zhao, X., Wang, H., Wu, D., and Xing, D.: Hydro-gen production, methanoHydro-gen inhibition and microbial commu-nity structures in psychrophilic single-chamber microbial elec-trolysis cells, Energ. Environ. Sci., 4, 1329–1336, 2011. Luo, G., Xie, L., Zou, Z., Wang, W., Zhou, Q., and Shim, H.:
Anaer-obic treatment of cassava stillage for hydrogen and methane pro-duction in continuously stirred tank reactor (CSTR) under high organic loading rate (OLR), Int. J. Hydrogen Energ., 35, 11733– 11737, 2010.
McCarty, P. L.: One hundred years of anaerobic treatment, Anaero-bic Digestion, 3–22, 1981.
Mizuno, O., Shinya, M., Suzuki, K., Yaguchi, J., and Noike, T. E: Effect of pH on Hydrogen Production from Noodle Manu-facturing Wastewater, Environ. Eng. Res., 37, 97–106, 2000 (in Japanese).
Nathao, C., Sirisukpoka, U., and Pisutpaisal, N.: Production of hy-drogen and methane by one and two stage fermentation of food waste, Int. J. Hydrogen Energ., 38, 15764–15769, 2013. Nielsen, A. T., Amandusson, H., Bjorklund, R., Dannetun, H.,
Ejlertsson, J., and Ekedahl, L. G.: Hydrogen production from or-ganic waste, Int. J. Hydrogen Energ., 26, 547–550, 2001. Okamoto, M., Miyahara, T., Mizuno, O., and Noike, T.: Biological
hydrogen potential of materials characteristic of the organic frac-tion of municipal solid wastes, Water Sci. Technol., 41, 25–32, 2000.
Payot, R., Guedon, E., Cailliez, C., Gelhage, E., and Petitdemange, H.: Metabolism of cellobiose by Clostridium cellulolyticum growing in continuous culture: evidence for decreased NADH reoxidation as a factor limiting growth, Microbiology, 144, 375– 384, 1998.
Radjaram, B. and Saravanane, R.: Assessment of optimum dilution ratio for biohydrogen production by anaerobic co-digestion of press mud with sewage and water, Bioresource Technol., 102, 2773–2780, 2011.
Ramos, C., Buitrón, G., Moreno-Andrade, I., and Chamy, R.: Effect of the initial total solids concentration and initial pH on the bio-hydrogen production from cafeteria food waste, Int. J. Hydrogen Energ., 37, 13288–13295, 2012.
Reungsang, A., Sreela-or, C., and Plangklang, P.: Non-sterile bio-hydrogen fermentation from food waste in a continuous stirred tank reactor (CSTR): Performance and population analysis, Int. J. Hydrogen Energ., 38, 15630–15637, 2013.
Sahlström, L.: A review of survival of pathogenic bacteria in or-ganic waste used in biogas plants, Bioresource Technol., 87, 161–166, 2003.
Saraphirom, P. and Reungsang, A.: Optimization of biohydrogen production from sweet sorghum syrup using statistical methods, Int. J. Hydrogen Energ., 35, 13435–13444, 2010.
Saripan, A. F. and Reungsang, A.: Simultaneous saccharification and fermentation of cellulose for bio-hydrogen production by anaerobic mixed cultures in elephant dung, Int. J. Hydrogen En-erg., 39, 9028–9035, 2014.
Schiel-Bengelsdorf, B. and Dürre, P.: Pathway engineering and syn-thetic biology using acetogens, FEBS Lett., 586, 2191–2198, 2012.
Shin, H.-S., Youn, J.-H., and Kim, S.-H.: Hydrogen production from food waste in anaerobic mesophilic and thermophilic acidogene-sis, Int. J. Hydrogen Energ., 29, 1355–1363, 2004.
Shiwei, X.: Analysis of China food consumption and waste, food and nutrition in China, China Food and Nutrition, 11, 4–8, 2005. Switzenbaum, M. S., Giraldo-Gomez, E., and Hickey, R. F.: Moni-toring of the anaerobic methane fermentation process. Enzyme Microbial Technology, Enzyme Microb. Techn., 12, 722–730, 1990.
Tai, J., Zhang, W., Che, Y., and Feng, D.: Municipal solid waste source-separated collection in China: A comparative analysis, Waste Manage., 31, 1673–1682, 2011.
Tawfik, A., Salem, A., and El-Qelish, M.: Two stage anaerobic baf-fled reactors for bio-hydrogen production from municipal food waste, Bioresource Technol., 102, 8723–8726, 2011.
Tawfik, A. and El-Qelish, M.: Key factors affecting on bio-hydrogen production from co-digestion of organic fraction of municipal solid waste and kitchen wastewater, Bioresource Technol., 168, 106–111, 2014.
Wang, L., Cheng, S., Li, Q., and Zengrang, X.: Tourist Dining Be-havior in Lhasa City, Resources Science, 35, 848–857, 2013 (in Chinese).
Wang, Y.-Y., Ai, P., Hu, C.-X., and Zhang, Y.-L.: Effects of various pretreatment methods of anaerobic mixed microflora on biohy-drogen production and the fermentation pathway of glucose, Int. J. Hydrogen Energ., 36, 390–396, 2011.
Wongthanate, J. and Chinnacotpong, K.: Optimal Conditons for Bi-ological Hydrogen Production from Food Waste, Environ. Eng. Res., 20, 121–125, 2015.
Yasin, N. H. M., Man, H. C., Yusoff, M. Z. M., and Hassan, M. A.: Microbial characterization of hydrogen-producing bacteria in fermented food waste at different pH values, Int. J. Hydrogen Energ., 36, 9571–9580, 2011.
Yokoyama, H., Waki, M., Moriya, N., Yasuda, T., Tanaka, Y., and Haga, K.: Effect of fermentation temperature on hydrogen pro-duction from cow waste slurry by using anaerobic microflora within the slurry, Appl. Microbiol. Biot., 74, 474–483, 2007. Zhang, L., Ban, Q., Li, J., and Xu, Y.: Assessment of Effects of
Yeast Extract on Bio-hydrogen Production from Anaerobic Acti-vated Sludge, Int. J. Agric. Biol, 16, 1189–1193, 2014.
Zhu, H., Parker, W., Basnar, R., Proracki, A., Falletta, P., Bé-land, M., and Seto, P.: Biohydrogen production by anaerobic co-digestion of municipal food waste and sewage sludges, Int. J. Hydrogen Energ., 33, 3651–3659, 2008.