The Thirty-Third AAAI Conference on Artificial Intelligence (AAAI-19)
Understanding Dropouts in MOOCs
Wenzheng Feng,
†Jie Tang,
†Tracy Xiao Liu
‡*†Department of Computer Science and Technology, Tsinghua University
‡Department of Economics, School of Economics and Management, Tsinghua University [email protected], [email protected], [email protected]
Abstract
Massive open online courses (MOOCs) have developed rapidly in recent years, and have attracted millions of on-line users. However, a central challenge is the extremely high dropout rate — recent reports show that the completion rate in MOOCs is below 5% (Onah, Sinclair, and Boyatt 2014; Kizilcec, Piech, and Schneider 2013; Seaton et al. 2014). What are the major factors that cause the users to drop out? What are the major motivations for the users to study in MOOCs? In this paper, employing a dataset from XuetangX1, one of the largest MOOCs in China, we conduct a system-atical study for the dropout problem in MOOCs. We found that the users’ learning behavior can be clustered into several distinct categories. Our statistics also reveal highcorrelation
between dropouts of different courses and stronginfluence
between friends’ dropout behaviors. Based on the gained in-sights, we propose a Context-aware Feature Interaction Net-work (CFIN) to model and to predict users’ dropout behavior. CFIN utilizes context-smoothing technique to smooth fea-ture values with different context, and use attention mecha-nism to combine user and course information into the model-ing framework. Experiments on two large datasets show that the proposed method achieves better performance than sev-eral state-of-the-art methods. The proposed method model has been deployed on a real system to help improve user re-tention.
Introduction
Massive open online courses (MOOCs) have become in-creasingly popular. Many MOOC platforms have been launched. For example, Coursera, edX, and Udacity are three pioneers, followed by many others from different countries such as XuetangX in China, Khan Academy in North America, Miriada in Spain, Iversity in German, Fu-tureLearn in England, Open2Study in Australia, Fun in France, Veduca in Brazil, and Schoo in Japan (Qiu et al. 2016). By the end of 2017, the MOOC platforms have of-fered 9,400 courses worldwide and attracted 81,000,000 on-line registered students (Shah 2018). Recently, a survey from Coursera shows that MOOCs are really beneficial to the
*The other authors include Shuhuai Zhang from PBC School of Finance of Tsinghua University and Jian Guan from XuetangX. Copyright © 2019, Association for the Advancement of Artificial Intelligence (www.aaai.org). All rights reserved.
1
https://xuetangx.com
learners who complete courses, where 61% of survey re-spondents report MOOCs’ education benefits and 72% of those report career benefits (Zhenghao et al. 2015).
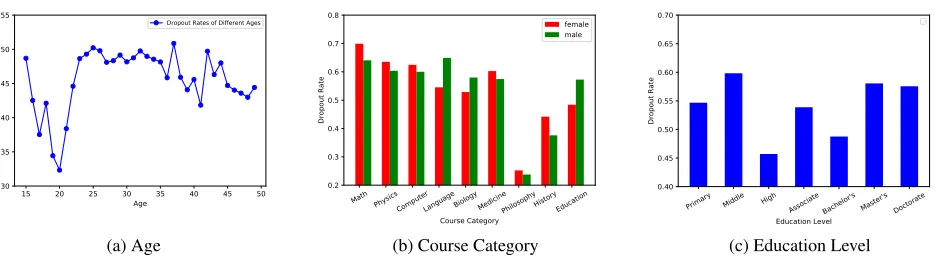
However, on the other hand, MOOCs are criticized for the low completion ratio (He et al. 2015). Indeed, the av-erage course completion rate on edX is only 5% (Kizilcec, Piech, and Schneider 2013; Seaton et al. 2014). We did a similar statistic for 1,000 courses on XuetangX, and resulted in a similar number — 4.5%. Figure 1 shows several ob-servational analyses. As can be seen, Age is an important factor — young people are more inclined to drop out; Gen-der is another important factor — roughly, female users are more likely to drop science courses and male users are more likely to give up non-science courses; finally, educational background is also important. This raises several interesting questions: 1) what are the major dropout reasons? 2) what are the deep motivations that drive the users to study or in-duce them to drop out? 3) is that possible to predict users’ dropout behavior in advance, so that the MOOCs platform could deliver some kind of useful interventions (Halawa, Greene, and Mitchell 2014; Qi et al. 2018)?
Employing a dataset from XuetangX, the largest MOOC platform in China, we aim to conduct a systematical explo-ration for the aforementioned questions. We first perform a clustering analysis over users’ learning activity data and found that users’ studying behavior can be grouped into several categories, which implicitly correspond to different motivations that users study MOOC courses. The analyses also disclose several interesting patterns. For example, the dropout rates between similar courses is highly correlated; friends’ dropout behaviors strongly influence each other — the probability that a user drops out from a course increases quickly to 65% when the number of her/his dropout friends increases to 5.
15 20 25 30 35 40 45 50 Age
0.30 0.35 0.40 0.45 0.50 0.55
Dropout Rate
Dropout Rates of Different Ages
(a) Age
Math PhysicsComputerLanguageBiologyMedicinePhilosophyHistoryEducation Course Category
0.2 0.3 0.4 0.5 0.6 0.7 0.8
Dropout Rate
female male
(b) Course Category
Primary Middle High Associate Bachelor's Master's Doctorate Education Level
0.40 0.45 0.50 0.55 0.60 0.65 0.70
Dropout Rate
(c) Education Level
Figure 1: Dropout rates of different demographics of users. (a) user age (b) course category (c) user education level.
system. Experiments on both datasets show that the pro-posed method achieves much better performance than sev-eral state-of-the-art methods. We have deployed the pro-posed method in XuetangX to help improve user retention.
Related Work
Prior studies apply generalized linear models (including lo-gistic regression and linear SVMs (Kloft et al. 2014; He et al. 2015)) to predict dropout. Balakrishnan et al. (2013) present a hybrid model which combines Hidden Markov Models (HMM) and logistic regression to predict student retention on a single course. Another attempt by Xing et al. (2016) uses an ensemble stacking generalization approach to build robust and accurate prediction models. Deep learning meth-ods are also used for predicting dropout. For example, Fei et al. (2015) tackle this problem from a sequence labeling perspective and apply an RNN based model to predict stu-dents’ dropout probability. Wang et al. (2017) propose a hy-brid deep neural network dropout prediction model by com-bining the CNN and RNN. Ramesh et al. (2014) develop a probabilistic soft logic (PSL) framework to predict user retention by modeling student engagement types using la-tent variables. Cristeaet et al. (2018) propose a light-weight method which can predict dropout before user start learning only based on her/his registration date. Besides prediction itself, Nagrecha et al. (2017) focus on the interpretability of existing dropout prediction methods. Whitehill et al. (2015) design an online intervention strategy to boost users’ call-back in MOOCs. Dalipi et al. (2018) review the techniques of dropout prediction and propose several insightful sugges-tions for this task. What’s more, XuetangX has organized the KDDCUP 20152for dropout prediction. In that competition,
most teams adopt assembling strategies to improve the pre-diction performance, and “Intercontinental Ensemble” team get the best performance by assembling over sixty single models.
More recent works mainly focus on analyzing students engagement based on statistical methods and explore how to improve student engagements (Kellogg 2013; Reich 2015). Zheng et al. (2015) apply the grounded theory to study users’
2
https://biendata.com/competition/kddcup2015
motivations for choosing a course and to understand the rea-sons that users drop out a course. Qiu et al. (2016) study the relationship between student engagement and their certifi-cate rate, and propose a latent dynamic factor graph (LadFG) to model and predict learning behavior in MOOCs.
Data and Insights
The analysis in this work is performed on two datasets from XuetangX. XuetangX, launched in October 2013, is now one of the largest MOOC platforms in China. It has provided over 1,000 courses and attracted more than 10,000,000 reg-istered users. XuetangX has twelve categories of courses: art, biology, computer science, economics, engineering, for-eign language, history, literature, math, philosophy, physics, and social science. Users in XuetangX can choose the learn-ing mode: Instructor-paced Mode (IPM) and Self-paced Mode (SPM). IPM follows the same course schedule as con-ventional classrooms, while in SPM, one could have more flexible schedule to study online by herself/himself. Usually an IPM course spans over 16 weeks in XuetangX, while an SPM course spans a longer period. Each user can en-roll one or more courses. When one studying a course, the system records multiple types of activities: video watching (watch, stop, and jump), forum discussion (ask questions and replies), assignment completion (with correct/incorrect answers, and reset), and web page clicking (click and close a course page).
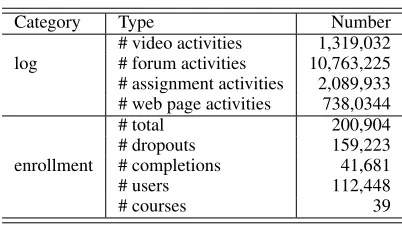
Two Datasets.The first dataset contains 39 IPM courses and their enrolled students. It was also used for KDDCUP 2015. Table 1 lists statistics of this dataset. With this dataset, we compare our proposed method with existing methods, as the challenge has attracted 821 teams to participate. We refer to this dataset as KDDCUP.
The other dataset contains 698 IPM courses and 515 SPM courses. Table 2 lists the statistics. The dataset contains richer information, which can be used to test the robustness and generalization of the proposed method. This dataset is referred to as XuetangX.
Insights
per-Table 1: Statistics of the KDDCUP dataset.
Category Type Number
log
# video activities 1,319,032 # forum activities 10,763,225 # assignment activities 2,089,933 # web page activities 738,0344
enrollment
# total 200,904
# dropouts 159,223
# completions 41,681
# users 112,448
# courses 39
Table 2: Statistics of the XuetangX dataset.
Category Type #IPM* #SPM*
log
# video activities 50,678,849 38,225,417 # forum activities 443,554 90,815 # assignment activities 7,773,245 3,139,558 # web page activities 9,231,061 5,496,287
enrollment
# total 467,113 218,274
# dropouts 372,088 205,988
# completions 95,025 12,286
# users 254,518 123,719
# courses 698 515
∗
#IPM and #SPM respectively stands for the number for the corresponding IPM courses and SPM courses.
form a clustering analysis on users’ learning activities. To construct the input for the clustering analysis, we define a concept oftemporal codefor each user.
Definition 1. Temporal Code: For each useruand one
of her enrolled course c, the temporal code is defined as a binary-valued vector su
c = [suc,1, suc,2, ..., suc,K], where su
c,k ∈ {0,1} indicates whether user uvisits course c in the k-th week. Finally, we concatenate all course-related vectors and generate the temporal code for each user as
Su= [su c1,s
u c2, ...,s
u
cM], whereM is the number of courses.
Please note that the temporal code is usually very sparse. We feed the sparse representations of all users’ temporal codes into aK-means algorithm. The number of clusters is set to5 based on aSilhouette Analysis(1987) on the data. Table 3 shows the clustering results. It can be seen that both cluster 2 and cluster 5 have low dropout rates, but more inter-esting thing is that users of cluster 5 seem to be hard work-ers — with the longest video watching time, while uswork-ers of cluster 2 seem to be active forum users — the number of questions (or answers) posted by these users is almost10× higher than the others. This corresponds to different moti-vations that users come to MOOCs. Some users, e.g., users from cluster 5, use MOOC to seriously study knowledge, while some other users, e.g., cluster 2, may simply want to meet friends with similar interest. Another interesting phe-nomenon is about users in cluster 4. Their average number of revise answers for assignment (i.e. #reset) is much higher than all the other clusters. Users of this cluster probably are students with difficulties to learn the corresponding courses.
Table 3: Results of clustering analysis. C1-C5 — Cluster 1 to 5; CAR — average correct answer ratio.
Category Type C1 C2 C3 C4 C5
video
#watch 21.83 46.78 12.03 19.57 112.1
#stop 28.45 68.96 20.21 37.19 84.15
#jump 16.30 16.58 11.44 14.54 21.39
forum #question#answer 0.040.13 0.383.46 0.020.13 0.030.12 0.030.17
assignment CAR#revise 0.220.17 0.760.02 0.190.04 0.200.78 0.590.01
session seconds 1,715 714 1,802 1,764 885 count 3.61 8.13 2.18 4.01 7.78
enrollment #enrollment 21,048 9,063 401,123 25,042 10,837 total #users 2,735 4,131 239,302 4,229 4,121 dropout rate 0.78 0.29 0.83 0.66 0.28
Correlation Between Courses. We further study whether there is any correlation for users dropout behavior between different courses. Specifically, we try to answer this ques-tion: will someone’s dropout for one course increase or decrease the probability that she drops out from another course? We conduct a regression analysis to examine this. A user’s dropout behavior in a course is encoded as a 16-dim dummy vector, with each element representing whether the user has visited the course in the corresponding week (thus 16 corresponds to the 16 weeks for studying the course). The input and output of the regression model are two dummy vectors which indicate a user’s dropout behavior for two dif-ferent courses in the same semester. By examining the slopes of regression results (Figure 2), we can observe a signifi-cantly positive correlation between users’ dropout probabil-ities of different enrolled courses, though overall the corre-lation decreases over time. Moreover, we did the analysis for courses of the same category and those across different cat-egories. It can be seen that the correlation between courses of the same category is higher than courses from different categories. One potential explanation is that when a user has limited time to study MOOC, they may first give up substitu-tive courses instead of those with complementary knowledge domain.
1 2 3 4 5 6 7 8 9 10 11 12 13 14 15 16
Week
0.30 0.35 0.40 0.45 0.50 0.55 0.60
Slope
Courses in Different Categories Courses in Same Categories All Courses
Figure 2: Dropout correlation analysis between courses. The x-axis denotes the weeks from 1 to 16 and they-axis is the slope of linear regression results for dropout correlation be-tween two different courses. The red line is the result of dif-ferent category courses, the green line denotes the slope of same category courses, and the black line is pooling results in all courses.
0 1 2 3 4 5 6 7 8 9 10
# dropout friends
0.0 0.2 0.4 0.6 0.8
user dropout probability
Figure 3: User dropout probability conditioned on the num-ber of dropout friends. x-axis is the number of dropout friends, andy-axis is user’s dropout probability.
In order to analyze the influence from dropout friends quantitatively, we calculate users’ dropout probabilities con-ditional on the number of dropout friends. Figure 3 presents the results. We see users’ dropout probability increases monotonically from 0.33 to 0.87 when the number of dropout friends ranges from1 to10. This indicates that a user’s dropout rate is greatly influenced by her/his friends’ dropout behavior.
Methodology
We now turn to discuss potential solutions to predict when and whether a user will drop out a specific course, by lever-aging the patterns discovered in the above analysis. In sum-mary, we propose a Context-aware Feature Interaction Net-work (CFIN) to deal with the dropout prediction problem. Different from previous work on this task, the proposed model incorporates context information, including user and course information, into a unified framework. Let us begin with a formulation of the problem we are going to address.
history prediction
Learning start 𝐷"day 𝐷"+ 𝐷$day Timeline
Figure 4: Dropout Prediction Problem. The firstDhdays are
history period, and the nextDpdays areprediction period.
Formulation
In order to formulate this problem more precisely, we first introduce the following definitions.
Definition 2.Enrollment Relation: LetCdenote the set
of courses,Udenote the set of users, and the pair(u, c) de-note useru∈Uenrolls the coursec∈C. The set of enrolled courses byuis denoted asCu⊂Cand the set of users who have enrolled coursecis denoted asUc ⊂U. We useEto denote the set of all enrollments, i.e.,{(u, c)}
Definition 3. Learning Activity: In MOOCs, user u’s
learning activities in a course c can be formulated into an mx-dimensional vector X(u, c), where each element xi(u, c) ∈X(u, c)is a continuous feature value associated tou’s learning activity in a coursec. Those features are ex-tracted from user historical logs, mainly includes the statis-tics of users’ activities.
Definition 4.Context Information: Context information
in MOOCs comprises user and course information. User in-formation is represented by user demographics (i.e. gender, age, location, education level) and user cluster. While course information is the course category. The categorical informa-tion (e.g. gender, locainforma-tion) is represented by a one-hot vec-tor, while continues information (i.e. age) is represented as the value itself. By concatenating all information representa-tions, the context information of a(u, c)pair is represented by a vectorZ(u, c).
With these definitions, our problem of dropout prediction can be defined as: Given useru’s learning activityX(u, c)
on course c inhistory period (as shown in Figure 4, it is the first Dh days after the learning starting time), as well as her/his context information Z(u, c), our goal is to pre-dict whetheruwill drop out fromcin theprediction period
(as shown in Figure 4, it is the followingDpdays after
his-tory period). More precisely, lety(u,c) ∈ {0,1}denote the
ground truth of whetheruhas dropped out,y(u,c)is positive
if and only ifuhas not taken activities oncin theprediction
period. Then our task is to learn a function:
f : (X(u, c),Z(u, c))→y(u,c)
Please note that we define the prediction of dropouts for all users/courses together, as we need to consider the user and course information.
Context-aware Feature Interaction Network
Feature augmentation Learning Activity 𝐗(𝑢, 𝑐)
𝑥)(∗, 𝑐)
𝑔,
Feature augmentation details
Activity feature 𝑥)(𝑢,𝑐)
Convolutional layer
Embedding layer
DNN
𝑦.
Context-smoothing
Attention
𝑔/ Embedding layer
Fully connected layer
𝑥)(𝑢,∗)
𝑥)(𝑢,𝑐)
Weighted sum Context Information 𝐙(𝑢, 𝑐) Attention-based Interaction
Context feature 𝑧)(𝑢, 𝑐) Course-context statistics User-context statistics
𝐕34/5
𝐕3())
𝐕6
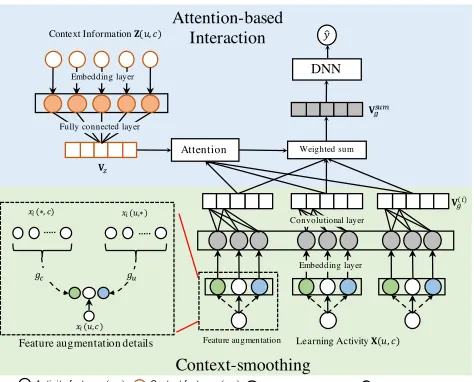
Figure 5: The architecture of CFIN.
to learn a context-aware representation for each activity fea-turexi(u, c)by leveraging its context statistics. This strat-egy is referred to as context-smoothing in this paper. What’s more, we also propose an attention mechanism to learn the importances of different activities by incorporatingZ(u, c)
into dropout prediction. Figure 5 shows the architecture of the proposed method. In the rest of this section, we will ex-plain the context-smoothing and attention mechanism in de-tails.
Context-Smoothing. The context-smoothing strategy consists of three steps: feature augmentation, embed-ding and feature fusion. In feature augmentation, each activity feature xi(u, c) ∈ X(u, c)3 is expanded with its user and course-context statistics. User-context statistics of feature xi is defined by a mapping function gu(xi) from the original activity feature to several statistics of ith feature across all courses enrolled by u, i.e., gu : xi(u, c) → [avg({xi(u,∗)}),max({xi(u,∗)}), . . .]. While course-context statistics, represented by gc(xi), are statistics over all users in course c, i.e., gc : xi(u, c) → [avg({xi(∗, c)}),max({xi(∗, c)}), . . .]. Let Xˆ = Xˆ(1)g ⊕ Xˆ
(2)
g ⊕ . . . ⊕ Xˆ
(mx)
g represent the
augmented activity feature vector, where eachXˆ(gi) ∈Rmg
is a feature group which consists of xi and its context statistics:Xˆ(gi)= [[xi]⊕gu(xi)⊕gc(xi)]. Then eachxˆ∈Xˆ is converted to a dense vector through an embedding layer. Asxˆ is continuous variable, we obtain the corresponding embedding vector via simply multiplyingˆxby a parameter vectora∈Rde:
e= ˆx·a. (1)
We useEx∈Rmgmx×deto denote the embedding matrix
of Xˆ and useE(gi) ∈ Rmg×de to represent the embedding
3
We ommit the notation(u, c)in the following description, if no ambiguity.
matrix of Xˆ(gi). After that, the next step is feature fusion. We employ a one-dimensional convolutional neural network (CNN) to compress eachE(gi)(1 ≤ i ≤ mx) to a vector. More formally, a vectorV(gi)∈Rdf is generated fromE(xi)
by
V(gi)=σ(Wconvδ(E(gi)) +bconv), (2)
whereδ(E)denotes flatting matrixEto a vector,Wconv∈ Rdf×mgde is convolution kernel,b
conv ∈Rdf is bias term.
σ(·)is activate function. This procedure can be seen as an mg-stride convolution on Ex. By using this method, each
feature groupXˆ(gi)is represented by a dense vectorVg(i). It can be seen as the context-aware representation of eachxi with integrating its context statistics.
Attention-based Interaction. We now turn to introduce how to learn a dropout probability by modeling the attention-based interactions for activity features inXusing context informationZ. First, we need to transformZinto a dense vectorVz∈Rdf by feeding the embedding ofZinto
a fully-connected layer:
Vz=σ(Wf cδ(Ez) +bf c), (3)
whereEzis the embedding matrix ofZ.Wf c andbf c are parameters. Then we useVzto calculate an attention score for eachV(gi)(1≤i≤mx):
ˆ
λi=hTattnσ(Wattn(Vg(i)⊕Vz) +battn), (4)
λi= exp(ˆλi)
∑
1≤i≤mxexp(ˆλi)
, (5)
whereWattn ∈ Rda×2df,b
attn ∈ Rda andh
attn ∈ Rda
are parameters.λi is the attention score ofV
(i)
g , which can be interpreted as the importance of theithactivity featurex
i. Based on the calculated attention scores, we obtain a pooling vectorVsum
g by applying weighted sum toV
(i)
g :
Vsumg = ∑
1≤i≤mx
λiV(gi). (6)
HereVsum
g can be seen as the context-aware representa-tion of X. In the final step, we feedVsum
g into anL-layer deep neural network (DNN) to learn the interactions of fea-tures. Specifically, the input layer isVsum
g . And each hidden layer can be formulated as
V(dl+1)=σ(W(dl)V(dl)+b(dl)), (7)
wherelis the layer depth.W(dl),b(dl)are model parameters.
V(dl)is output ofl-layer. The final layer a sigmoid function which is used to estimate the dropout rateyˆ(u,c):
ˆ y(u,c)=
1
1 + exp(−hT
sigmoidV
(L−1)
d )
, (8)
whereyˆ(u,c) ∈ [0,1]denotes the probability ofudropping
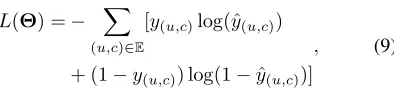
L(Θ) =− ∑
(u,c)∈E
[y(u,c)log(ˆy(u,c))
+ (1−y(u,c)) log(1−yˆ(u,c))]
, (9)
whereΘdenotes the set of model parameters,y(u,c)is the
corresponding ground truth,Eis the set of all enrollments.
Model Ensemble
For further improving the prediction performance, we also design an ensemble strategy by combining CFIN with the XGBoost (Chen and Guestrin 2016), one of the most ef-fective gradient boosting framework. Specifically, we obtain
V(dL−1), the output of DNN’s(L−1)thlayer, from a suc-cessfully trained CFIN model, and use it to train an XGBoost classifier together with the original features, i.e.,XandZ. This strategy is similar to Stacking (Wolpert 1992).
Experiments
We conduct various experiments to evaluate the effective-ness of CFIN on two datasets: KDDCUP and XuetangX.4
Experimental Setup
Implementation Details. We implement CFIN with Ten-sorFlow and adopt Adam (Kingma and Ba 2014) to opti-mize the model. To avoid overfitting, we applyL2
regular-ization on the weight matrices. We adopt Rectified Linear Unit (Relu) (Nair and Hinton 2010) as the activation func-tion. All the features are normalized before fed into CFIN. We test CFIN’s performance on both KDDCUP and Xue-tangX datasets. For the KDDCUP dataset, the history period and prediction period are set to 30 days and 10 days respec-tively by the competition organizers. We do not use the at-tention mechanism of CFIN on this data, as there is no con-text information provided in the dataset. For the XuetangX dataset, the history period is set to 35 days, prediction period is set to 10 days, i.e.,Dh= 35, Dp= 10.
Comparison Methods. We conduct the comparison ex-periments for following methods:
• LR: logistic regression model.
• SVM: The support vector machine with linear kernel.
• RF: Random Forest model.
• GBDT: Gradient Boosting Decision Tree.
• DNN:3-layer deep neural network.
• CFIN: The CFIN model.
• CFIN-en: The assembled CFIN using the strategy pro-posed in Model Ensemble.
For baseline models (LR, SVM, RF, GBDT, DNN) above, we use all the features (including learning activity Xand context information Z) as input. When training the mod-els, we tune the parameters based on 5-fold cross validation
4
All datasets and codes used in this paper is publicly available at http://www.moocdata.cn.
Table 4: Overall Results on KDDCUP dataset and IPM courses of XuetangX dataset.
KDDCUP XuetangX
Methods AUC (%) F1 (%) AUC (%) F1 (%)
LRC 86.78 90.86 82.23 89.35
SVM 88.56 91.65 82.86 89.78
RF 88.82 91.73 83.11 89.96
DNN 88.94 91.81 85.64 90.40
GBDT 89.12 91.88 85.18 90.48
CFIN 90.07 92.27 86.40 90.92
CFIN-en 90.93 92.87 86.71 90.95
Table 5: Contribution analysis for different engagements on KDDCUP dataset and IPM courses of XuetangX dataset.
KDDCUP XuetangX
Features AUC (%) F1 (%) AUC (%) F1 (%)
All 90.07 92.27 86.50 90.95
- Video 87.40 91.61 84.40 90.32
- Forum 88.61 91.93 85.13 90.41
- Assignment 86.68 91.39 84.83 90.34
(CV) with the grid search, and use the best group of parame-ters in all experiments. The evaluation metrics include Area Under the ROC Curve (AUC) and F1 Score (F1).
Prediction performance
Table 4 presents the results on KDDCUP dataset and IPM courses of XuetangX dataset for all comparison methods. Overall, CFIN-en gets the best performance on both two datasets, and its AUC score on KDDCUP dataset achieves 90.93%, which is comparable to the winning team of KDD-CUP 20152. Compared to LR and SVM, CFIN achieves 1.51 – 3.29% and 3.54 – 4.17% AUC score improvements on KD-DCUP and XuetangX, respectively. Moreover, compared to the ensemble methods (i.e. RF and GBDT) and DNN, CFIN also shows a better performance.
Feature Contribution
In order to identify the importance of different kinds of engagement activities in this task, we conduct feature ab-lation experiments for three major activity features, i.e.,
Table 6: Average attention weights of different clusters. C1-C5 — Cluster 1 to 5; CAR — average correct answer ratio.
Category Type C1 C2 C3 C4 C5
video
#watch 0.078 0.060 0.079 0.074 0.072 #stop 0.090 0.055 0.092 0.092 0.053 #jump 0.114 0.133 0.099 0.120 0.125
forum #question 0.136 0.127 0.138 0.139 0.129 #answer 0.142 0.173 0.142 0.146 0.131
assignment CAR 0.036 0.071 0.049 0.049 0.122 #reset 0.159 0.157 0.159 0.125 0.136
Hi Tom, Based on our study, the probability of you obtaining a certificate can be increased by about 3% for every hour of video watching~
(a) Strategy 1: Certificate driven
Based on our study, the probability of you obtaining a certificate can be increased by about 3% for every hour of video watching~
(b) Strategy 2: Certificate driven in video
Hi Alice, you have spent 300 minutes learning and completed 2 homework questions in last week, keep going!
(c) Strategy 3: Effort driven
Figure 6: Snapshots of the three intervention strategies.
Table 7: Results of intervention by A/B test. WVT — av-erage time (s) of video watching; ASN — avav-erage number of completed assignments; CAR — average ratio of correct answers.
Activity No intervention Strategy 1 Strategy 2 Strategy 3
WVT 4736.04 4774.59 5969.47 3402.96
ASN 4.59 9.34* 2.95 11.19**
CAR 0.29 0.34 0.22 0.40
*:p−value≤0.1, **:p−value≤0.05byt−test.
video activity, assignment activity and forum activity, on two datasets. Specifically, we first input all the features to the CFIN, then remove every type of activity features one by one to watch the variety of performance. The results are shown in Table 5. We can observe that all the three kinds of engagements are useful in this task. On KDDCUP, as-signment plays the most important role, while on XuetangX, video seems more useful.
We also perform a fine-grained analysis for different fea-tures on different groups of users. Specifically, we feed a set of typical features into CFIN, and compute their average attention weights for each cluster. The results are shown in Table 6. We can observe that the distributions of attention weights on the five clusters are quite different. The most sig-nificant difference appears in CAR (correct answer ratio): Its attention weight on cluster 5 (hard workers) is much higher than those on other clusters, which indicates that correct an-swer ratio is most important in predicting dropout for hard workers. While for users with more forum activities (cluster 2), answering questions in forum seems to be the key fac-tor, as the corresponding attention weight on “#question” is the highest. Another interesting thing is about the users with high dropout rates (cluster 1, 3 and 4). They get much higher attention wights on the number of stopping video and watch-ing video compared to cluster 2 and cluster 5. This indicates that the video activities play an more important role in pre-dicting dropout for learners with poor engagements than ac-tive learners.
From Prediction to Online Intervention
We have deployed the proposed algorithm onto XiaoMu, an intelligent learning assistant subsystem on XuetangX, to
help improve user retention. Specifically, we use our algo-rithm to predict the dropout probability of each user from a course. If a user’s dropout probability is greater than a threshold,XiaoMuwould send the user an intervention mes-sage. We did an interesting A/B test by considering different strategies.
• Strategy 1: Certificate driven.Users in this group will receive a message like“Based on our study, the proba-bility of you obtaining a certificate can be increased by
about 3% for every hour of video watching.”.
• Strategy 2: Certificate driven in video. Users of this group will receive the same message as Strategy 1, but the scenario is when the user is watching course video.
• Strategy 3: Effort driven.Users in group will receive a message to summarize her/his efforts used in this course such as“You have spent 300 minutes learning and
com-pleted 2 homework questions in last week, keep going!”.
Figure 6 shows the system snapshots of three strategies. We did the A/B test on four courses (i.e. Financial Analy-sis and Decision Making, Introduction to Psychology, C++ Programming and Java Programming) in order to examine the difference the different intervention strategies. Users are split into four groups, including three treatment groups cor-responding to three intervention strategies and one control group. We collect two weeks of data and examine the video activities and assignment activities of different group of users. Table 7 shows the results. We see Strategy 1 and Strat-egy 3 can significantly improve users’ engagement on as-signment. Strategy 2 is more effective in encouraging users to watch videos.
Conclusion
learning assistant in XuetangX to help improve students retention. We are also working on applying the method to several other systems such as ArnetMiner (Tang et al. 2008).
Acknowledgements.The work is supported by the National Natural Science Foundation of China (61631013), the Cen-ter for Massive Online Education of Tsinghua University, and XuetangX.
References
Balakrishnan, G., and Coetzee, D. 2013. Predicting stu-dent retention in massive open online courses using hidden markov models. Electrical Engineering and Computer
Sci-ences University of California at Berkeley.
Chen, T., and Guestrin, C. 2016. Xgboost: A scalable tree boosting system. In Proceedings of the 22Nd ACM SIGKDD International Conference on Knowledge
Discov-ery and Data Mining, 785–794.
Cristea, A. I.; Alamri, A.; Kayama, M.; Stewart, C.; Al-shehri, M.; and Shi, L. 2018. Earliest predictor of dropout in moocs: a longitudinal study of futurelearn courses.
Dalipi, F.; Imran, A. S.; and Kastrati, Z. 2018. Mooc dropout prediction using machine learning techniques: Review and research challenges. InGlobal Engineering Education
Con-ference (EDUCON), 2018 IEEE, 1007–1014. IEEE.
Fei, M., and Yeung, D.-Y. 2015. Temporal Models for Pre-dicting Student Dropout in Massive Open Online Courses.
2015 IEEE International Conference on Data Mining
Work-shop (ICDMW)256–263.
Halawa, S.; Greene, D.; and Mitchell, J. 2014. Dropout pre-diction in moocs using learner activity features.Experiences
and best practices in and around MOOCs3–12.
He, J.; Bailey, J.; Rubinstein, B. I. P.; and Zhang, R. 2015. Identifying at-risk students in massive open online courses.
InProceedings of the Twenty-Ninth AAAI Conference on
Ar-tificial Intelligence, 1749–1755.
Kellogg, S. 2013. Online learning: How to make a mooc.
Nature369–371.
Kingma, D. P., and Ba, J. 2014. Adam: A method for stochastic optimization.arXiv preprint arXiv:1412.6980.
Kizilcec, R. F.; Piech, C.; and Schneider, E. 2013. Decon-structing disengagement: Analyzing learner subpopulations in massive open online courses. InProceedings of the Third International Conference on Learning Analytics and Knowl-edge, 170–179.
Kloft, M.; Stiehler, F.; Zheng, Z.; and Pinkwart, N. 2014. Predicting MOOC Dropout over Weeks Using Machine Learning Methods. 60–65.
Nagrecha, S.; Dillon, J. Z.; and Chawla, N. V. 2017. Mooc dropout prediction: Lessons learned from making pipelines interpretable. InWWW’17, 351–359.
Nair, V., and Hinton, G. E. 2010. Rectified linear units improve restricted boltzmann machines. InICML’10, 807– 814.
Onah, D. F.; Sinclair, J.; and Boyatt, R. 2014. Dropout rates of massive open online courses: behavioural patterns.
EDULEARN’145825–5834.
Perozzi, B.; Al-Rfou, R.; and Skiena, S. 2014. Deepwalk: Online learning of social representations. InProceedings of the 20th ACM SIGKDD International Conference on
Knowl-edge Discovery and Data Mining, 701–710.
Qi, Y.; Wu, Q.; Wang, H.; Tang, J.; and Sun, M. 2018. Bandit learning with implicit feedback. InNIPS’18.
Qiu, J.; Tang, J.; Liu, T. X.; Gong, J.; Zhang, C.; Zhang, Q.; and Xue, Y. 2016. Modeling and predicting learning behav-ior in moocs. InProceedings of the Ninth ACM International
Conference on Web Search and Data Mining, 93–102.
Ramesh, A.; Goldwasser, D.; Huang, B.; Daum´e, III, H.; and Getoor, L. 2014. Learning latent engagement patterns of students in online courses. InAAAI’14, 1272–1278. Reich, J. 2015. Rebooting mooc research.Science34–35. Rousseeuw, P. J. 1987. Silhouettes: a graphical aid to the interpretation and validation of cluster analysis. Journal of
computational and applied mathematics20:53–65.
Seaton, D. T.; Bergner, Y.; Chuang, I.; Mitros, P.; and Pritchard, D. E. 2014. Who does what in a massive open online course?Communications of the Acm58–65.
Shah, D. 2018. A product at every price: A review of mooc stats and trends in 2017.Class Central.
Tang, J.; Zhang, J.; Yao, L.; Li, J.; Zhang, L.; and Su, Z. 2008. Arnetminer: Extraction and mining of academic social networks. InKDD’08, 990–998.
Wang, W.; Yu, H.; and Miao, C. 2017. Deep model for dropout prediction in moocs. InProceedings of the 2nd
In-ternational Conference on Crowd Science and Engineering,
26–32. ACM.
Whitehill, J.; Williams, J.; Lopez, G.; Coleman, C.; and Re-ich, J. 2015. Beyond prediction: First steps toward automatic intervention in mooc student stopout.
Wolpert, D. H. 1992. Stacked generalization. Neural
net-works5(2):241–259.
Xing, W.; Chen, X.; Stein, J.; and Marcinkowski, M. 2016. Temporal predication of dropouts in moocs: Reaching the low hanging fruit through stacking generalization.
Comput-ers in Human Behavior119–129.
Zheng, S.; Rosson, M. B.; Shih, P. C.; and Carroll, J. M. 2015. Understanding student motivation, behaviors and per-ceptions in moocs. InProceedings of the 18th ACM
Con-ference on Computer Supported Cooperative Work, 1882–
1895.