NSW PUBLIC HEALTH
BULLETIN
Influencing population health performance:
feedback from managers, population health
staff and clinicians on the
NSW Population
Health Standards for Area Health Services
Jeannine L. M. Liddle
A,B,F, Thérèse C. Jones
A,B, Margaret S. Lesjak
A,C, Andrew J. Milat
A,D,
David M. Lyle
A,Eand Emma L. Webster
A,BAPopulation Health Standards Evaluation Group, Greater Western Area Health Service
BPopulation Health, Planning and Performance, Greater Western Area Health Service
CBroken Hill Centre for Remote Health Research Joint Initiative of the University of Sydney and Greater Western Area Health Service
DCentre for Health Advancement, NSW Department of Health
EBroken Hill University Department of Rural Health, University of Sydney
FCorresponding author. Email: [email protected]
Abstract: The NSW Population Health Standards for Area Health Services have recently been introduced in
NSW to assist area health services assess and improve performance in population health. Greater Western Area Health Service was the pilot site for trialling the
Standards as a assessment tool. Following
self-assessment, managers, population health staff and cli-nicians were asked for feedback. Staff were either interviewed or participated in a group discussion. Consulting with staff who would be required to use the Standards in the long term was seen as important for facilitating implementation across the area health service. The Standards were seen as credible and potentially beneficial, especially in raising the profile of population health work and encouraging popula-tion-based and integrated approaches.
In the health sector, standards have been developed for indi-vidual practice, programs and organisations, and are used to assess performance and encourage its improvement.1
Standards Australia defines a standard as ‘a published document which sets out specifications and procedures designed to ensure that a material, product, method or service is fit for its purpose and consistently performs in the way it was intended’.2A standard ‘encodes within it
knowl-edge about how to’ and is used to transfer that knowlknowl-edge into practice.3
The NSW Department of Health commissioned a series of projects to evaluate the NSW Population Health Standards
for Area Health Services introduced in late 2005. One of
these projects determined the extent to which the Standards were reflected in area health service performance agree-ments.4 This paper presents another of these projects and
examines the Standards’ potential value from the perspec-tive of the area health service staff who would be required to apply them.
w w w. p u b l i s h . c s i r o. a u / j o u r n a l s / p h b CONTENTS – See back page
Vol. 19(7–8) • July–August 2008 State Health Publication PH 080163 ISSN 1034 7674
10.1071/NB07001
Methods
Staff participated in the process either through interview or group discussion.
Interviews
In order to gather a wide range of views, staff were purpo-sively selected from Greater Western Area Health Service (GWAHS) executive and non-executive tiers with different work roles (managerial, population health), work settings (hospital, community health, population health) and direc-torates (Population Health, Planning and Performance, Clinical Operations) represented. Staff were contacted directly and provided with information about the
Standards. They were informed that their participation in
the process was voluntary and that responses would be de-identified to maintain confidentiality. There was the opportunity to discuss any concerns before verbally con -senting to participate. Sixteen of 18 people contacted (nine women and seven men) agreed to be interviewed. All interviews were conducted by one of the authors and audiotaped. Interviews ran for 30–45 minutes.
After a pilot of two interviews, a list of open-ended ques-tions was developed and refined. The quesques-tions sought feedback on: the self-assessment process; the Standards’ potential benefits and risks; factors that would help or hinder implementation; and how the Standards could be improved. The questions were an initial prompt for further responses and discussion. Pilot interviews were not included in the final analysis.
Group discussion
As the views of clinicians had not been sought in the inter-views, a group discussion was held with eight clinicians working in hospital and community health settings. Participants were given information about the Standards before the session and were asked to consider the strengths and weaknesses, and factors that would help or hinder implementation. One of the authors facilitated the session and another took notes. The session ran for approximately 60 minutes.
Data analysis
Data analysis occurred concurrently with data collection. Audiotapes of interviews were transcribed for meaning, rather than verbatim. An initial reading of the transcripts identified the main points, which, along with pertinent quotes, were documented on an interview summary sheet. Transcripts were then coded by a single person. As further interviews were transcribed and coded, similar codes were collapsed into categories. Categories that recurred across interviews were noted as potential themes.
For comparison, two transcripts were coded by another author. Differences in coding and interpretations were discussed to reach agreement about categories. These
categories, with associated quotes, were further discussed with all authors to reach agreement on themes.
Notes taken during the group session were read to identify the main points. Points in addition to or contrary to those gained from interviews were noted.
Results
Feedback on the Standardsas a self-assessment process
The self-assessment took place in 2006 during a time of significant organisational change. Participants noted the difficulty in using the Standards as a self-assessment tool in this context.
There was uncertainty among participants about how nar-rowly or broadly the Standards were to be applied: too narrow and the Standards have little relevance outside population health circles; too broad and the practicalities of data collection become a problem in completing the self-assessment task.
For self-assessment to impact on performance, there needs to be a way of taking action. For some participants, the results of the self-assessment would ‘drive some of the change’ and provide ‘a focus to enable us to work on spe-cific strategies’. Others were more sceptical about the ben-efits of an audit. Future benchmarking with other area health services was seen as helpful.
Potential benefits and risks of implementing the Standards
Everyone interviewed reported that the Standards had potential benefits (Box 1).
All interviewees discussed possible risks or adverse con-sequences; in particular, that assessment using the
Standards could become a bureaucratic process removed
from everyday practice.
Factors that would help or hinder implementation
Staff involvement in developing and implementing the Standards was seen as crucial, and requires a good
Box 1. Reported potential benefits of the NSW Population Health Standards for Area Health Services
• Promote population health
• Educative for staff, especially staff outside population health
• Provide opportunity to examine existing systems and processes, and where appropriate, incorporate the Standards to make improvements in practice
• Increase accountability to communities, managers and for workers themselves
Vol. 19(7–8) 2008 NSW Public Health Bulletin | 119 Influencing population health performance
understanding of the tool and its purpose. One participant stated that the interview process itself had been educative. Participating in the process had helped their understanding of why the Standards had been developed and given them the opportunity to think about the potential value to their own practice. Others saw implementation as part of a bigger change, with one participant commenting that:
some of the changes that are required are about revolution, about a complete change in the way we do business and that requires a broader debate, a more inclusive debate, and this tool would assist that debate but you need general practitioners, specialist doctors and patients and commu-nity members using the tool, to get that sort of focus.
Successful implementation hinges on an organisation being orientated and committed to population health approaches. Most participants strongly expressed the idea that leader-ship and clear direction with tangible outcomes and rewards were needed along with links to other initiatives.
A recurring idea in the interviews was how to use the
Standards in a way that demonstrates their practical
purpose:
Being real, not being bureaucratic and ticking boxes so you can demonstrate that it [the Standards] is being treated seriously and that it is part of our core business.
Issues were raised about the capacity of the area health service to implement the Standards, including the need for resources and appropriate data collection systems (Box 2).
How the Standardscan be improved
The language and jargon used alienated staff who were not specialists in population health and were not ‘applicable to people on the ground’.
To rate performance, the current form of the Standards uses four levels of achievement, from A (highest level) to D (lowest level). This system was not well supported. Level A was perceived to be:
unachievable and unhelpful as being a gold bar set up so high…it wouldn’t actually help to raise the standard of the work that you were doing.
Level D was thought to be equally unhelpful:
I think…it does not acknowledge any good work that is done…it basically says whatever it is you’re doing isn’t worth counting. I don’t think that’s a reasonable way of encouraging staff involved to take on board the Standards.
Several participants thought greater emphasis should be placed on equity issues and tackling upstream determinants of health. The health of Aboriginal and Torres Strait Islander peoples was seen by some as missing altogether, and hence detrimental to presenting the health of Aboriginal and Torres Strait Islander peoples as a high priority.
Issues from group discussion
Feedback from the group discussion with clinicians was consistent with the interviews. The Standards in their current form were not seen as appropriate or accessible for clinicians. There was concern about the impact the
Standards would have on workloads and how to manage
any extra work. Clinicians understood the importance of engaging with communities about population health and thought that the Standards would help change expecta-tions about health services and encourage communities to value evidence-based approaches.
Clinicians also wondered how these Standards related to other standards, including professional standards, and advised that the various reporting requirements would not be compatible. More detail about group discussion results is available in the evaluation report.5
Discussion
The Standards were seen as a step forward in helping area health services assess and improve their own performance in population health. As an assessment tool, further modi-fication is needed, especially to encourage ‘buy-in’ from managers and clinicians who are not working in spe-cialised population health roles.
Feedback on the Standards was obtained from only a small number of staff in one rural area health service. Nearly half of interviewees worked in the Population Health, Planning and Performance directorate and had been directly involved in the self-assessment process. These staff members were therefore familiar with the Standards. Greater involvement of staff from outside this directorate may have elicited different findings. Nevertheless, there was consistency in responses between staff of the direc-torate and other staff.
This study took place during a time of significant change when all area health services in New South Wales (NSW) were undergoing restructure. GWAHS, an area health service with unique issues for implementation in terms of its geographical spread, was formed by merging three previously separate area organisational cultures. In these Box 2. Factors hindering implementation of the NSW
Population Health Standards for Area Health Services self-assessment tool
• Lack of understanding among staff about the content and purpose of the Standards and the tool
• Logistics of implementation over large geographical areas
• Resources required for set up across the area health service
circumstances, staff interviewed may have been particu-larly aware of organisational barriers that needed to be overcome to allow successful area-wide implementation.
The Standards need to have credibility with area health service staff if they are to be successfully implemented and in turn influence population health performance. While there was general support for the idea of standards in pop-ulation health, there was a strong feeling that poppop-ulation health should be central to the organisation’s business for the Standards to have credibility. The Standards were seen as potentially helpful in raising the profile of population health and setting goals for population health action.
Standards, as ‘encoded knowledge’ need to be ‘decoded’ easily. The current version of the Standards is written from a specialist population health viewpoint and does not translate well into what other area health service staff do on a daily basis. Area health service staff require time to engage with and extract meaning from standards expressed in plain language, and to decide how to use that knowledge to improve performance in their own setting.
The Standards as a self-assessment tool can identify current strengths and weaknesses, and identify where improve-ments could be directed. Those interviewed sought greater clarity about how area health services could take those next steps. Researchers note the lack of evidence-based tools to help improve performance in the population health context and the need for a science base that can ‘support accurate and reliable assessments of the practice of public health at local, state and national levels’.6
To effect these changes will be a major undertaking and that requires widespread support across the organisation and from outside, including support from the broader NSW community. The NSW Department of Health could assist area health services in a variety of ways, for example, through: revision of relevant policies to strengthen their population health orientation; engaging with other jurisdictions to develop a nationally coherent approach; and providing statewide co-ordination and resources where required.
Conclusion
The Standards show promise as a tool for area health serv-ices to assess their ability to deliver servserv-ices in line with a population health approach. While it would be easier and less resource intensive to confine the use of population health standards to population health staff, if applied across an area health service, they offer greater potential to break down ‘silos’ between clinical and population health disciplines and harness more local expertise to tackle issues affecting the health of populations.
Acknowledgment
Our thanks go to the GWAHS staff who participated in the pilot self-assessment and evaluation. The authors also wish to acknowledge Ross O’Donoughue and the members of the original working group who developed the Population Health Standards for Area Health
Services: Peter Sainsbury, Jeanette Ward, Mark Ferson and
Sarah Thackway.
References
1. Skok A, Swerissen H, Macmillan J. Standards and quality
improvement processes in health and community services: a review of the literature. Melbourne: Quality Improvement
Council; June 2000. Available from: http://www.qic.org.au/ Docs/Lit_review.pdf (Cited 16 November 2006.)
2. Standards Australia. What is a standard? Sydney: Standards Australia; 2006. Available from: http://www.standards.org.au/ (Cited 16 November 2006.)
3. Centre for International Economics. Standards and the
economy. Canberra and Sydney: Centre for International
Economics Canberra and Sydney; 2006, p. 6. Available from: http://www.thecie.com.au/content/publications/Economic_ impact_of_standards.pdf (Cited 16 November 2006.)
4. Liddle J, Lyle D, Lesjak M, Milat A, Webster E, Jones T. Influencing Population Health Performance: introduction of Standards for Area Health Services in New South Wales.
N S W Public Health Bull 2007; 18(1–2): 17–21.
doi:10.1071/NB07016
5. Liddle J, Jones T, Webster E, Milat A, Lyle D, Lesjak M.
Population Health Standards for Area Health Services: Evaluation Report. Dubbo: Greater Western Area Health
Service; 2006.
Vol. 19(7–8) 2008 NSW Public Health Bulletin | 121
Why use signposting?
Consumers today are interested in the nutritional quality of the food products they purchase. As such, mandatory nutritional labelling requirements are now present in several countries including the United States of America (USA), Australia and New Zealand. In Australia, legisla-tion requires that nutrilegisla-tion informalegisla-tion be listed on pack-aged food in the form of a nutrition information panel (NIP), with the aim of assisting consumers to make health-ier food choices.1–3When used by health professionals and
technically minded consumers, the NIP is highly informa-tive, but general consumers find it difficult to compre-hend.4–7A simple labelling or signposting system that is
easily seen and easily and quickly interpreted would assist consumers in making healthier food choices.1,8–10 It has
been suggested that the combination of a nutrition sign-post together with the traditional NIP is likely to be more effective in assisting consumers to make healthier choices.3,8,11
Front-of-pack signposts, or logos, such as the Heart Foundation tick and the Glycaemic Index (GI) symbol have already been voluntarily used widely in Australia. These signposts have been shown to assist consumers in selecting healthier choices within the same food group.12,13However,
there can be a lack of transparency around the inclusion
A comparison of two nutrition signposting
systems for use in Australia
Abstract: Consumers are interested in making healthier food choices but the mandatory nutrition information panel currently in use in Australia is not easily understood or interpreted by most con-sumers. A simple nutrition signpost would be valu-able. This paper reviews two nutrition signposting systems currently being considered for adoption in Australia. The authors conclude that a system similar to the colour-coded Traffic Light System is likely to be most useful.
Jimmy Chun-Yu Louie
A, Victoria Flood
A,
Anna Rangan
A, Debra J. Hector
Aand Tim Gill
A,BANSW Centre for Public Health Nutrition,
University of Sydney
BCorresponding author. Email: [email protected]
criteria of privately owned systems and often limited eval-uation of the impact. Research has shown that when a sign-post is endorsed officially by government legislation or standards, its credibility is strongly increased.8 In the
United Kingdom (UK), a voluntary signposting system is not providing a high level of assistance to consumers as some food manufacturers oppose the recommended system and use their own signposts, resulting in a plethora of dif-ferent signposts creating confusion among consumers. Thus, if an effective, simple-to-use signpost can be identi-fied for use in Australia, a mandatory system supported by Food Standards Australia New Zealand (FSANZ) to govern the use of such a signpost would be preferred, with inclu-sion criteria clearly presented to the public and its impact evaluated on a regular basis.
Potential signposting systems for use in Australia
There are two nutrition signposting systems that have been developed recently and are considered primary contenders for use in Australia by various population health groups and industry:
• The colour-coded Traffic Light System (CTLS) • The Percentage Daily Intake (%DI)
There are several other signposting systems previously or currently trialled in various countries – for example, the Choices front-of-pack stamp, Smart Spots and Shop Smart with Heart – but these other systems have not been suffi-ciently evaluated within the Australian context and are not considered within this paper.14–16
Colour-coded Traffic Light System
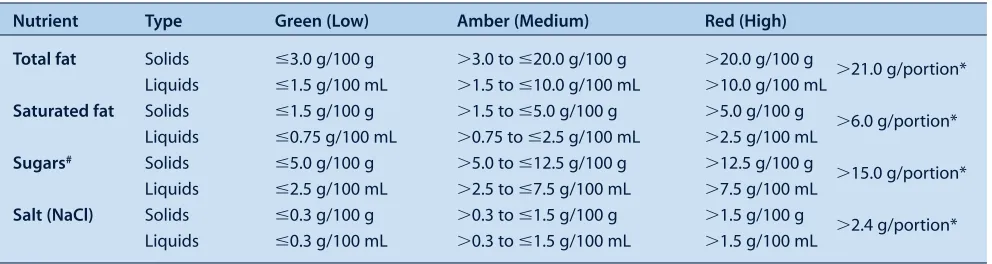
The CTLS has been developed by the Food Standards Agency (FSA) in the UK, where it is currently used. This system categorises the four key nutrients most associated with public health issues (fat, saturated fat, sugars and salt) as high, medium or low compared to a set of agreed crite-ria and these nutrients are then each given a red, amber or green rating, which are portrayed as red, amber or green traffic lights on the package (Figure 1).17,18Another light is
sometimes included in the signpost for energy content but it is not a core criterion.19The criteria, which are universal
across food types, compare the total fat, saturated fat, sugar and salt content of the food item against the Guideline Daily Amount (GDA) for each 100 g. The cut-offs for each category are summarised in Table 1.19 The FSA
recom-mends a particular list of foods that the CTLS should be used on (mainly composite, processed foods), but does not discourage its use on other products, including drinks.19
The CTLS is designed to promote the moderation message, by encouraging consumers to select food items with more green or amber lights and limit those with red lights.20Sales data from the UK suggest that this labelling
system may be effective, although sales may also be influ-enced by other factors such as price and promotion. For example, sales of breakfast cereals with mainly green lights or amber lights are growing twice as fast as break-fast cereals in total, and frozen meals with red lights on the label decreased in sales by 35%.21Similar effects on sales
have been reported for other products.22,23
Jones and Richardson demonstrated that a traffic light signpost helps guide the attention of the consumer to the important nutrients (i.e. those associated with chronic disease) as well as improving the accuracy of the healthi-ness rating of nutrition labels.24When a traffic light
sign-post was present, consumers were more likely to assess the healthiness rating using a combination of nutrients, rather
than a single one such as fat or energy content. The authors suggest caution when interpreting their results though, as in their study the colour-coded traffic light was placed next to the NIP, whereas it was designed for use on the front of pack.
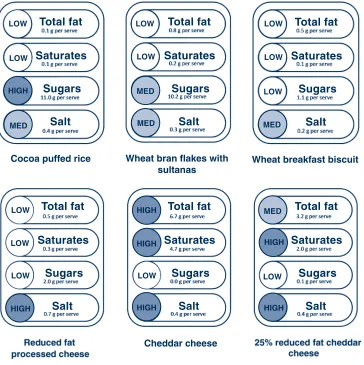
The traffic light signposts of some of the commonly con-sumed food items generated using the criteria specified in Table 1 are shown in Figure 2.
Feunekes et al. indicated that the CTLS gives inconsistent differentiation between healthier and less healthy products within certain categories.8For example, initially the CTLS
did not provide any distinction between breakfast cereals such as cocoa puffed rice and wheat bran flakes with sul-tanas, even though the latter has a better nutrient profile and is generally regarded as a healthier choice due to the presence of fruit sugars rather than added sugars. The FSA has updated the sugar criteria so that only non-milk extrin-sic sugars (NMES) – i.e., added sugars – are considered to determine the red colour code (high) (see Table 1 and Figure 2).19
The CTLS has also been criticised for labelling some core foods such as cheese with three or even four red lights (Figure 2), potentially contributing to a reduction in intake of these foods. This could be avoided if different cut-offs were specific to foods or food groups.20Such mislabelling
could also be avoided by the additional use of a single traffic light to represent the overall nutrient profile or healthiness of the food product, taking into account other nutrients such as fibre and protein. The single traffic light could be generated by criteria similar to the Nutrient Profile Modelling System (NPMS) used by FSANZ in the eligibility assessment of Nutrition, Health and Related Claims.25
Total Fat
FAT SATURATES LOW
LOW
LOW Saturates
Sugars
Salt
HIGH MEDIUM
0.8 g per serve
0.2 g per serve
11.0 g per serve
0.3 g per serve
Per serving GDA
7.7 g
42.4 g 2.0 g
2.0 g 70 g
20 g
40 g
6 g
HIGH SUGAR
SALT MED
Figure 1. Samples of the colour-coded Traffic Light System. GDA: Guideline Daily Amount.
䊏red: high; 䊏amber: medium; 䊐green: low. Source: Food Standards Agency (UK).38 Reproduced with permission.
Table 1. Criteria used in the colour-coded Traffic Light System for classifying nutrients as green, amber or red
Nutrient Type Green (Low) Amber (Medium) Red (High)
Total fat Solids ⱕ3.0 g/100 g ⬎3.0 to ⱕ20.0 g/100 g ⬎20.0 g/100 g
⬎21.0 g/portion*
Liquids ⱕ1.5 g/100 mL ⬎1.5 to ⱕ10.0 g/100 mL ⬎10.0 g/100 mL
Saturated fat Solids ⱕ1.5 g/100 g ⬎1.5 to ⱕ5.0 g/100 g ⬎5.0 g/100 g
⬎6.0 g/portion*
Liquids ⱕ0.75 g/100 mL ⬎0.75 to ⱕ2.5 g/100 mL ⬎2.5 g/100 mL
Sugars# Solids ⱕ5.0 g/100 g ⬎5.0 to ⱕ12.5 g/100 g ⬎12.5 g/100 g
⬎15.0 g/portion*
Liquids ⱕ2.5 g/100 mL ⬎2.5 to ⱕ7.5 g/100 mL ⬎7.5 g/100 mL
Salt (NaCl) Solids ⱕ0.3 g/100 g ⬎0.3 to ⱕ1.5 g/100 g ⬎1.5 g/100 g
⬎2.4 g/portion*
Liquids ⱕ0.3 g/100 mL ⬎0.3 to ⱕ1.5 g/100 mL ⬎1.5 g/100 mL
#The sugars colour code is determined as follows: the lower limit of amber is determined using totalsugars; the upper limit of amber is
determined using non-milk extrinsic sugars, i.e. addedsugars; if the food item falls in the amber category and is high in fruit or milk sugars, a statement on the packaging to highlight the presence of natural sugars (e.g. contains naturally occurring sugars) is required.
* per portion criteria were used to ensure foods contributing more than 30% of the recommended upper intake for total fat, saturated fat, sugar and 40% of salt be labelled red.
Vol. 19(7–8) 2008 NSW Public Health Bulletin | 123 Another limitation of the CTLS alone is the potential for
confusion around product choice by a consumer when faced, for example, with a product that carries two green lights and two red lights. Consumers may also find it con-fusing as to whether a 5 g serve of food carrying red lights is less healthy than a 300 g serve of a food carrying amber lights. The CTLS, however, is designed for comparison within a particular food group, and it is unlikely the serving size would vary much within a food group. Also, the overarching concept of discouraging consumption of foods with red lights still applies.
Critics have suggested that CTLS may act as a disincentive for food manufacturers to improve the nutritional compo-sition of food products, if it is not technically possible to move from red to amber or from amber to green.26,27
Certainly many manufacturers were unable to make the required changes to meet the criteria of the National Heart Foundation tick, which is similar conceptually to the single traffic light. However, many manufacturers did respond by removing around 33 tonnes of salt from their products in a year.28
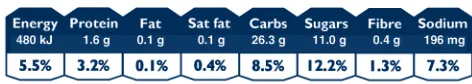
Percentage Daily Intake
In 2006, the Australian Food and Grocery Council (AFGC) recommended the inclusion of information on the percent-age daily intake (%DI) for key nutrients on the packpercent-ages of their members’ products.29The %DI labelling concept
originated in the USA, where percentage daily value (%DV) is included in the nutrition fact panel. A very similar concept has been developed in the UK, called per-centage guideline daily amounts (%GDA).30In Australia,
some food manufacturers have already placed a stand-alone signpost or %DI counter, for a wide range of nutri-ents beyond those recommended by the AFGC, on the front of their food packages (Figure 3).29
Percentage daily intakes are generally calculated as the percentages of the nutrients provided by one serving of the food compared to the reference value of an average male adult who consumes a daily diet of 8700 kJ. Only the inclusion of the %DI of energy is required under this scheme, but the seven core nutrients (energy, protein, fat, saturated fat, carbohydrates, total sugars and sodium), which are the same as those included in the traditional NIP, Nutrition signposting systems
LOW
LOW
LOW
LOW
LOW
LOW
LOW
LOW
LOW
LOW LOW LOW
HIGH
HIGH
HIGH
HIGH
HIGH
HIGH
HIGH MED
MED
MED MED
MED
Cheddar cheese
Total fat
Saturates
Sugars
Salt
Total fat
Saturates
Sugars
Salt
Total fat
Saturates
Sugars
Salt
Total fat
Saturates
Sugars
Salt
Total fat
Saturates
Sugars
Salt Total fat
Saturates
Sugars
Salt
Wheat bran flakes with sultanas
Wheat breakfast biscuit Cocoa puffed rice
Figure 2. Traffic light signposts of commonly consumed food items
A statement on the packaging to highlight the presence of natural sugars would be required for this product, e.g. ‘contain sugars naturally occurring from the fruit’.
are usually listed. Additional %DI values for nutrients such as fibre, vitamins and minerals can also be included in this system, but are not compulsory.
While the %DI counter provides factual information about specific nutrients, it is likely that it is too complex for most consumers. Interpretation requires the consumer to consider:
(i) different serving sizes of similar products, as illustrated for breakfast cereals in Figure 4 (ii) information about other foods to be consumed
throughout the day
(iii) how the guide fits in with their average daily requirement, which is not necessarily the same as an average adult male.
In addition, the approach includes ‘negative’ nutrients such as saturated fat and ‘positive’ nutrients such as fibre, which add to the complexity of this system.31In the case
of negative nutrients, the consumer is expected to moder-ate intake to a recommended upper limit; on the other hand, for positive nutrients, the consumer is expected to pursue the recommended minimum intake. Several studies have reported on the limitations of the %DI to consumers. Levy et al. reported that 71% of adults in a study did not understand the meaning of %DV (the US version of %DI), and most incorrectly rated the fat content of food items
using this system.32In another study, Barone et al. found
that the provision of %DV was misperceived by under-graduate participants and the system did not alter judg-ments about the overall healthiness of a product.33
Notably, recent research by FSANZ shows that non-NIP users are unlikely to benefit from the %DI concept, and that consumers need several attempts to evaluate products in a forced situation before the %DI can be used correctly, severely limiting its application and effectiveness.34
The %DI counter has strong support from some stake-holders who believe the system allows easy comparison between products, and who highlight the existing use of the system, but this appears to be contradicted by consumer research.35The implementation of this system
in Australia and New Zealand would be relatively simple as there is existing approval by FSANZ for the inclusion of %DI information on food packages. The food indus-try also believes that the use of a %DI counter in Australia and New Zealand could assist international harmonisation of labelling, as many countries use a similar system already. However, Beard has suggested that the industry may favour the %DI counter because it is concerned about the impact of red lights on the sales of certain products.13 Even if manufacturers can
reformu-late their products such that they carry fewer red or more green lights, the process takes time, costs and is risky to business.4
Support for the %DI system may be more prevalent in the UK where inclusion of an NIP is not mandatory (unless a nutrition claim is made).26,27,36,37In Australia, the %DI
system may be less valuable as NIPs are mandatory and thus the use of the simpler CTLS is a potentially useful Figure 3. Percentage daily intake counter.
Sat fat: saturated fat; Carbs: carbohydrates.
Wheat bran flakes with sultanas
Vol. 19(7–8) 2008 NSW Public Health Bulletin | 125 addition, in combination with the more detailed NIP.
%DI information can be effectively included in the CTLS, which has already been demonstrated by UK food manufacturers.
Opponents of the %DI approach are also concerned that the %DI is based on an average male adult diet therefore has little application for children. In contrast, the CTLS is based on per 100 g, which is essentially a percentage, so a red light relating to fat for adults (> 20 g per 100 g) would have the same application to children, though the cut-off may be different.
Conclusion
The advantages and disadvantages of the two systems are summarised in Table 2. Based on this assessment, we believe that a system similar to the colour-coded Traffic Light System currently used in the UK is likely to be more effective for use in Australia than a percentage daily intake (%DI) counter. In particular, it would complement the more detailed mandatory NIP already in operation. A combination of a single traffic light, based on the overall nutrient profile of the food, together with the CTLS for individual nutrients, including total fat, saturated fat, sugar and salt, would offer additional benefits. Whichever system is chosen, there should be clear and specific mandatory guidelines on how the information should be presented on food packages to minimise confusion to consumers. Further research on the effect of a CTLS on consumer behaviour would be valuable, including investi-gation of the effect of labelling on sales. Consideration should also be given to producing a set of criteria appro-priate for each food group.
Acknowledgment
The NSW Centre for Public Health Nutrition is funded by NSW Health and The Nutrition Research Foundation of The University of Sydney. This review was initiated and conducted by the investi -gators, and does not necessarily represent the view of the funding groups.
References
1. van Kleef E, van Trijp H, Paeps F, Fernández-Celemín L. Consumer preferences for front-of-pack calories labelling.
Public Health Nutr 2007; 11(2): 203–13.
2. Mhurchu CN, Gorton D. Nutrition labels and claims in New Zealand and Australia: a review of use and understanding. Aust
N Z J Public Health 2007; 31(2): 105–12.
doi:10.1111/j.1753-6405.2007.00026.x
3. Scott V, Worsley AF. Consumer views on nutrition labels in New Zealand. Aust J Nutr Diet 1994; 54: 6–13.
4. Beard TC. Traffic Light Food Labels, 2007. Available at: http://www.saltmatters.org/PDFs/TRAFFIC%20LIGHTS-web.pdf (Cited 9 August 2007.)
5. Cowburn G, Stockley L. Consumer understanding and use of nutrition labelling: a systematic review. Public Health Nutr 2005; 8(1): 21–8. doi:10.1079/PHN2005666
6. Rothman RL, Housam R, Weiss H, Davis D, Gregory R, Gebretsadik T et al. Patient understanding of food labels: the role of literacy and numeracy. Am J Prev Med 2006; 31(5): 391–8. doi:10.1016/j.amepre.2006.07.025
7. Pelletier AL, Chang WW, Delzell JE, McCall JW. Patients’ understanding and use of snack food package nutrition labels.
J Am Board Fam Pract 2004; 17(5): 319–23.
8. Feunekes GI, Gortemaker IA, Willems AA, Lion R, van den Kommer M. Front-of-pack nutrition labelling: Testing effectiveness of different nutrition labelling formats front-of-pack in four European countries. Appetite 2007; 50(1): 57–70. doi:10.1016/j.appet.2007.05.009
9. Hoyer WD. An examination of consumer decision making for a common repeat purchase product. J Consum Res 1984; 11: 822–9. doi:10.1086/209017
10. Synovate. Quantitative evaluation of alternative food signpost-ing concepts. London: Food Standards Agency; 2005.
11. Geiger CJ, Wyse BW, Parent CR, Hansen RG. Review of nutrition labeling formats. J Am Diet Assoc 1991; 91(7): 808–15.
12. Gander J, Harding S. National Heart Foundation pick the tick research. Auckland: Research International; 1999.
13. Reid RD, D’Angelo MES, Dombrow CA, Heshka JT,
Dean TR. The Heart and Stroke Foundation of Canada’s health Nutrition signposting systems
Table 2. Advantages and disadvantages associated with two different nutrition labelling systems proposed for use in Australia
Colour-coded Traffic Light System (CTLS) % Daily Intake (%DI) counter
Advantages • Requires no calculation by the consumer to • Provides more detailed, ‘factual’ information
interpret information therefore more equitable • Widely supported by the food industry
• Easy to understand
• Indication of nutrient profile at a glance • Eye-catching and immediately noticeable • Quick to interpret
Disadvantages • Some potential to confuse: e.g. if two green and • No guidance on relative amounts (i.e. what is
two red lights appear on the same product ‘a lot’/‘a little’)
• Does not take into account other positive • May confuse consumers as it is based on ‘per serve’
nutrients (e.g. fibre, protein) • Not relevant for children and adolescents
• Requires consumer education to be useful
check food information program. Can J Public Health 2004; 95(2): 146–50.
14. Dötsch-Klerk M, Jansen L. The Choices programme: a simple, front-of-pack stamp making healthy choices easy. Asia Pac J
Clin Nutr 2008; 17(S1): 383–6.
15. PepsiCo. Product Criteria: Smart Spots; 2006. Available at: http://www.smartspot.com/about/criteria (Cited 20 May 2008.)
16. Kinnunen TI. The heart symbol: A new food labelling system in Finland. Nutr Bull 2000; 25: 335–9. doi:10.1046/j.1467-3010.2000.00079.x
17. European Union. Regulation (EC) No 1924/2006 of
The European Parliament and of the Council of 20 December 2006 on nutrition and health claims made on foods: Official Journal of the European Union; 2006. Available at: http://eur-lex.europa.eu/LexUriServ/site/en/oj/2007/l_012/ l_01220070118en00030018.pdf (Cited 20 May 2008.)
18. Department of Health. Report on health and social subjects No. 41. Dietary reference values for food energy and nutrients for the United Kingdom. London: HMSO; 1991.
19. Food Standards Agency. Front of pack nutritional signpost labelling technical guide issue 2. London: Food Standards Agency; 2007. Available at: http://www.food.gov.uk/
multimedia/pdfs/frontofpackguidance2.pdf (Cited 7 May 2008.)
20. Beard TC, Nowson CA, Riley MD. Traffic-light food labels.
Med J Aust 2007; 186(1): 19.
21. Mesure S. ‘Traffic light’ labels help healthy foods.
The Independent (London). 26 June 2006.
22. Cellan-Jones R. Supermarkets in label wars. BBC News. 20 July 2006.
23. J Sainsbury plc. Corporate Responsibility Report 2007. London: J Sainsbury plc; 2007. Available at:
http://www.j-sainsbury.co.uk/files/reports/cr2007/files/ report.pdf (Cited 7 November 2007.)
24. Jones G, Richardson M. An objective examination of con-sumer perception of nutrition information based on healthiness ratings and eye movements. Public Health Nutr 2007; 10(3): 238–44. doi:10.1017/S1368980007258513
25. Food Standards Australia New Zealand. Attachment 6: Modelling of compositional criteria to determine the eligibility of foods to carry a health claim. Canberra: Food Standards Australia New Zealand; 2007. Available at:
http://www.foodstandards.gov.au/_srcfiles/attach%206.pdf (Cited 27 August 2007.)
26. Theobald H, Buttriss J. BNF response to FSA consultation on nutrient profiling. London: British Nutrition Foundation; 2005. Available at: http://www.nutrition.org.uk/upload/
BNF%20Response%20to%20Nutrient%20Profiling1.pdf (Cited 7 November 2007.)
27. Bussell G. Nutritional profiling vs guideline daily amounts as a means of helping consumers make appropriate food choices.
Nutr Food Sci 2005; 35(5): 337–43. doi:10.1108/00346650510
625548
28. Young L, Swinburn B. Impact of the Pick the Tick food information programme on the salt content of food in New Zealand. Health Promot Int 2002; 17(1): 13–9. doi:10.1093/ heapro/17.1.13
29. Australian Food and Grocery Council. Australian Food and Grocery Council: % DI Labelling; 2007. Available at: http://www.afgc.org.au/index.cfm?id⫽436 (Cited 9 August 2007.)
30. Rayner M, Scarborough P, Williams C. The origin of Guideline Daily Amounts and the Food Standards Agency’s guidance on what counts as ‘a lot’ and ‘a little’. Public Health Nutr 2004; 7(4): 549–56. doi:10.1079/PHN2003552
31. The Food Commission. Nutrition labels are designed to confuse. London: The Food Commission; 2005. Available at: http://www.foodcomm.org.uk/latest_labels_jul05.htm (Cited 23 October 2007.)
32. Levy L, Patterson RE, Kristal AR, Li S. How well do consumers understand percentage daily value on food labels?
Am J Health Promot 2000; 14(3): 157–60.
33. Barone MJ, Rose RL, Manning KC, Miniard PW. Another look at the impact of reference information on consumer impres-sions of nutrition information. J Pub Policy Marketing 1996; 15(1): 55–62.
34. Bessey A, van Bueren D, Barker B, Davis J. Attachment 2: Technical report: Consumer research on percentage daily intake. Canberra: TNS Social Research for Food Standards Australia New Zealand; 2006. Available at:
http://www.foodstandards.gov.au/_srcfiles/P293%20PFAR %20Att%202%20-%20Technical%20Report%20Consumer %20Research.pdf (Cited 9 August 2007.)
35. Food Standards Australia New Zealand. International literature review on percentage daily intake labelling. Canberra: FSANZ; 2006. Available at: http://www.foodstandards.gov.au/_
srcfiles/P293%20PFAR%20Att%203%20-%20Intl %20Literature%20Review.pdf#search⫽%22international %20literature%20revie%22 (Cited 20 May 2008.)
36. Food and Drink Federation. FDF response to FSA’s consulta-tion on a voluntary front of pack signpost labelling scheme for the UK. London: Food and Drink Federation; 2006. Available at: http://www.fdf.org.uk/responses/fdf_response_fsa_ signposting_consulation.pdf (Cited 7 November 2007.)
37. Food Standards Agency. Guidance notes on nutrition labelling. London: Food Standards Agency, 1999. Available at:
http://www.food.gov.uk/multimedia/pdfs/nutlabel2.pdf (Cited 24 September 2007.)
38. Food Standards Agency. Eat well, be well – Traffic light labelling. London: Food Standards Agency, 2006. Available at: http://www.eatwell.gov.uk/foodlabels/trafficlights/
Vol. 19(7–8) 2008 NSW Public Health Bulletin | 127 Australia has been considered malaria free since 1981;
however, there are approximately 700 imported cases of malaria reported each year.1,2 The most recently
docu-mented outbreak of locally acquired malaria occurred in 2002 near Cairns in Queensland with 10 confirmed cases resulting from an infected traveller, who may have become infected in Indonesia or Madagascar.3
Australia has been receiving increasing numbers of immigrants from malaria endemic areas, with 9846 people from Africa arriving in 2004–2005 under human-itarian programs.4Of 215 consecutive African refugees
screened for malaria at a clinic in Newcastle, 22 (10%) had malarial parasites of at least one species; 21
Plasmodium falciparum, three P. malariae, two P. ovale,
and one P. vivax (Davis J, Webber M, personal communi-cation, 2006). Refugee settlement has increased in regional areas where structured screening programs have not previously existed. Unlike returned travellers who have no immunity and thus are symptomatic if infected with malaria parasites, migrants from endemic regions
Is there a risk of malaria transmission in NSW?
Abstract: NSW has a putative malaria vector in Anopheles annulipes, and increased numbers of
immigrants from malaria endemic countries who may be infective to mosquitoes but asymptomatic. We examine the factors known to influence malaria transmission and conclude that local trans-mission is possible but unlikely. The public health implications are that there should be systematic screening of immigrants from malaria endemic countries on arrival, and that the public health capacity to identify and respond to a malaria out-break should be maintained.
Ben D. Ewald
A,B,D, Cameron E. Webb
C,
David N. Durrheim
A,Band Richard C. Russell
CAHunter New England Population Health,
Hunter New England Area Health Service
BSchool of Medical Practice and Population Health,
University of Newcastle
CDepartment of Medical Entomology, University of Sydney and
Institute of Clinical Pathology and Medical Research, Westmead Hospital
DCorresponding author. Email: [email protected]
may show no symptoms and go undiagnosed unless specifically tested.
It is therefore important to address the questions: does the presence of the putative vector mosquito An. annulipes in New South Wales (NSW) pose a threat for malaria trans-mission given the occurrence of imported infections and what are the public health implications?
Background on malaria
There are four species of human malaria parasites: P.
fal-ciparum, P. vivax, P. ovale and P. malariae. The most
dangerous is the potentially fatal P. falciparum, which together with P. vivax accounts for approximately 90% of cases in Australia.1The incubation period for malaria is
generally one to two weeks, but can be longer for certain strains and following chemoprophylaxis. A person with the infection becomes infective to mosquitoes late in the course of the initial illness (from as little as a week to over a month), but can remain periodically infective to mosqui-toes for up to a year (P. falciparum) or longer for other malaria species. Not all treatments eradicate the gameto-cytes, the stage that infects mosquitoes. This means that, with international travel and immigration, there is always a small chance that an infective person will arrive who could infect local Anopheles mosquitoes.
Mosquitoes that feed on gametocyte carriers are not immediately infective, as the malaria parasite undergoes part of its life cycle in the gut wall of the insect and then actively migrates to the salivary glands from where it is injected along with anticoagulant saliva during a bite. The time taken for the mosquito stages to be completed and the mosquito to become infective is referred to as the extrinsic incubation period (sporogony, or the extrinsic cycle) and is highly temperature dependent, ranging from 4 days at 30°C to 16 days at 20°C (Figure 1). This is of great impor-tance, as at lower temperatures the incubation period may be longer than the average lifespan of the mosquito result-ing in few or no infective mosquitoes.
Malaria in NSW
In Australia, the mosquito known as Anopheles farauti sensu lato is considered the most important vector of malaria. It is principally found in areas north of 19° lati-tude in Queensland and north of 15° latilati-tude in the Northern Territory, although it has been reported in Mackay (21°9⬘) and Townsville (19°15⬘), and north of 17° in the Northern Territory. The area considered at greatest risk of malaria in Australia has been primarily determined by the range of An. farauti s.l., climate supportive of parasite
transmission and historical records of outbreaks. However, transmission of malaria in Australia has historically occurred as far south as Melbourne in the east and Perth in the west, and a range of Anopheles species occurs through-out the country, although little is known of their respective capacities to transmit Plasmodium parasites under field conditions.5
Historically, there has been a small number of locally acquired malaria cases in NSW, thought to be eight in the 20th century, all of them P. vivax and most associated with military personnel returning from overseas service with transmission attributed circumstantially to An. annulipes s.l.5This mosquito is generally the most abundant of the
six Anopheles species known to occur in NSW, the others being An. amictus, An. atratipes, An. bancroftii,
An. pseudo stigmaticus and An. stigmaticus. Laboratory
studies have shown An. annulipes s.l. to be capable of transmitting malaria parasites but they have not been found infected in nature.5,6 While little is known of the
malaria capacity of the remaining species, they are con-sidered relatively rare and unlikely to pose a risk for malaria transmission, although An. amictus can be locally abundant and has been suspected to be involved in malaria transmission in the Northern Territory.
Anopheles annulipes s.l. is a spindly looking grey
mos-quito of which the wings and legs are mottled with white scales. The larval stages are associated with a range of freshwater habitats and lie flat under the water surface, often in the thin layer of water above algal blooms. This mosquito is typically found in flooded ground pools and, although it is not usually associated with estuarine wet-lands, larvae occasionally colonise these brackish water habitats when rainfall has reduced the salinity of the ground pools. The adult mosquitoes may live for up to
three weeks and the female mosquitoes take blood meals from humans (as well as other mammals) predominantly from dusk to dawn. Mark–release–recapture experiments on this mosquito species at Griffith, NSW, revealed mean dispersal distances of approximately 1.2 km, although some mosquitoes were found to travel up to 5 km.7
In the Australasian region, the mosquitoes called
An. annulipes s.l. and An. farauti s.l. are each a group of
species, called sibling species, that are morphologically similar but vary in their distribution and biology, and prob-ably in their capacity to transmit Plasmodium species. It is not known which siblings were included in the laboratory studies that demonstrated transmission capacity or were involved in historical field transmission.
Assessing the risk of an outbreak in NSW
Malaria transmission is dependent on many probabilistic events, such as a mosquito finding someone who is infective (gametocytes present in peripheral blood), the mosquito being capable of being infected and then living long enough to develop sporozoites and thus become infective, and the opportunity of biting a susceptible person and transmitting the parasite. The threats to this process are many: successful treatment of infected people to prevent them becoming infectious to a mosquito; use of personal protection meas-ures against mosquito bites including insect screens, cloth-ing, insecticides and repellents; dry weather that can reduce mosquito longevity; cold weather that prolongs the extrinsic cycle; and the presence of other blood sources and the rela-tively low density of people in many inland parts of rural and regional NSW where An. annulipes s.l. is more abundant.
Mathematical models offer an understanding of the trans-mission dynamics of malaria, and while variable values are not available for NSW they can provide a useful frame-work for considering the risk of local malaria trans -mission.8The basic reproductive ratio (R
0), the number of
new cases of malaria generated by one case introduced into a population of fully susceptible hosts during the duration of the case, may be quantified by multiplying the transmission rate factor from vector to human during the life-span of the vector (TH) with the transmission rate factor from human to vector during the duration of infec-tion in the human (TV).
In this model, TH⫽V/H a bHLV
while TV⫽a bVDH
where:
• V is the density of vectors • H is the density of human hosts
• a is the biting rate on the human host per vector, which includes the biting frequency (estimated as the reciprocal of the length of the gonotrophic cycle) and the proportion of blood meals taken on humans
Microparasites 35
30
25
20
15
0 4 8 12 16 20 24 28 32 36 Days
Temperature (°C) Plasmodium falciparum
P. vivax
Vol. 19(7–8) 2008 NSW Public Health Bulletin | 129 • bHis the proportion of infectious bites on humans that
produce a patent infection in humans
• bVis the proportion of bites by susceptible mosquitoes on infected people that produce a patent infection in the vector
• LVis the life expectancy of the vectors
• DHis the duration of infectiousness in the host. Important assumptions underpinning this model include a lack of immunity in the susceptible human population, which is a robust assumption in NSW and an absence of a parasite-induced effect on vector survival or behaviour.9,10
Thus R0⫽TH×TV⫽V/H a2b
HbVDHLV
Variables included in a mathematical model for explaining the transmission of malaria
V: the spatial and temporal abundance of An. annulipes s.l.
fluctuates across NSW. The availability of suitable habitat
in Griffith in the inland results in high adult populations in late summer (Figure 2), while in Port Stephens on the coast
An. annulipes s.l. is present at relatively low densities
(Figure 3) with only a few individual mosquitoes collected in traps that may contain many thousands of mosquitoes dominated by Aedes vigilax and Culex annulirostris.
H: the density of human hosts may be affected by planning
decisions if residential developments occur in areas close to productive mosquito habitats or areas of intense mos-quito activity. In the inland areas with greatest abundance of An. annulipes, there are generally low to very low human population densities; however, urban sprawl may increase the number of human populations close to mos-quito habitats.
a: the number of bites per vector depends on the
accessi-bility of humans to host-seeking female mosquitoes. Biting rates will be influenced by factors such as the use of insect screens, bed nets, insect repellents, presence of alternative blood sources and frequency and nature of noc-turnal outdoor activities. The contact between mosquitoes and humans may also be increased when refuge sites for adult mosquitoes, such as heavily vegetated areas, are close to dwellings.
bH: the probability that human infection occurs when
bitten by an infected mosquito is generally assumed to be 0.8 to 1.0.
bV: this variable includes not only the proportion of mos-quitoes that become infected while taking a blood meal, but also the delay due to sporogonic development that must occur before they become infective. The duration of sporo-gony is highly temperature dependent as shown in Figure 1, and is a crucial factor limiting malaria outside the tropics.
LV: to transmit malaria parasites, the female mosquito has a blood meal, lays eggs, and goes looking for another Malaria transmission risk in NSW
Box 1. Glossary
Imported malaria:people arriving with malaria acquired overseas.
Introduced malaria:local transmission from imported cases.
Indigenous malaria:local transmission from other than an imported case.
Established (endemic) malaria:continuing transmission of indigenous malaria.
Receptive areas:places where the climate and suitable vectors could result in established malaria if it was introduced.
Gametocyte:the stage of parasite transferred from humans to mosquitoes.
Sporozoite:the stage of parasite transferred from mosquitoes to humans.
Sensu lato (s.l.):‘in the broad sense’ (Latin); when a species name is used to refer to a group of morphologically similar sibling species.
2002–2006
Figure 2. Mean monthly abundance and standard error (SE) of Anopheles annulipessensu lato at Griffith, NSW; aggregate years 2002–2006 (NSW Health 2006).
0.00 0.25 0.50 0.75 1.00
Nov. Dec. Jan. Feb. Mar. Apr.
Mean monthly mosquito abundance
per trap site
2002–2006
meal. The survival of adult mosquitoes is influenced by humidity, temperature and availability of suitable refuge sites (e.g. vegetation). Studies of An. annulipes s.l. at Echuca, Victoria, on the Murray, and Appin, NSW, demon-strated that the oldest mosquitoes were present in summer and late autumn. Based on the ambient temperature at each site, up to 6.6% of females at Appin and 10.3% at Echuca lived long enough to potentially become infective.11
DH: the duration of infectiveness of a human with malarial
gametocytes in their blood depends on the infecting malaria species, whether treatment was provided and what treatment was provided. Untreated P. vivax can be infec-tive for 1–2 years, but P. falciparum is generally infecinfec-tive for less than one year. In a malaria-naïve person, the infec-tion will cause symptoms that should prompt early diag-nosis by an alert clinician and, hopefully, effective treatment, which interrupts transmission. Such treatment may explain the absence of malaria transmission in NSW in recent decades. People from endemic areas who are tol-erant of malaria infection will not have a febrile illness so may not be diagnosed. Unless they are adequately screened, they could remain infective for a prolonged period (Figures 2 and 3).
Scenario
It is probable that over many years, if Australians keep travelling overseas and immigrants keep arriving, during a period of unusually high mosquito abundance, triggered by major rainfall and during above average temperatures in late summer or early autumn, malaria transmission will occur in NSW. The risk would be further increased in those areas where high levels of human activity occur between dusk and dawn in close proximity to mosquito-breeding habitats and particularly in areas that provide harbourage for adult mosquitoes, including heavily forested parklands within residential or recreational areas.
How long would it take to detect and respond to a malaria outbreak?
Immigrants tolerant to P. falciparum, however, arriving in NSW and carrying gametocytes may be infective to mos-quitoes for months or possibly up to or longer than a year. If they were fed on by anopheline mosquitoes capable of transmitting malaria, then the shortest delay before out-break detection would include the extrinsic cycle of 10–12 days, an incubation period of 7–14 days before infected humans become symptomatic, a diagnostic delay of 7 days before malaria infection is confirmed and a period of 2–4 days for identifying the area requiring appropriate mosquito control and organising appropriate larvicidal and adulticidal treatments: a total of at least 30 days before mosquito control is initiated. During this time, the original infective person would continue to be fed on by mosquitoes. This estimate is similar to the most recent Australian outbreak at Mission Beach, Queensland
in 2002, in which the period from infection of the mosqui-toes to public health notification was 30–33 days.3 If
several people were bitten by infective mosquitoes and were all presenting with similar symptoms at the same time, then the diagnostic delay may be reduced. As game-tocytes occur relatively late in the course of illness, infec-tion of mosquitoes from secondary cases is unlikely, as supported by experience from North Queensland where despite abundant An. farauti s.l. and higher humidity and temperatures than in NSW, no secondary cases resulted from a local transmission incident.12This outcome may
demonstrate the effectiveness of local public health serv-ices: conducting careful follow up of cases, particularly regarding exposure to areas where mosquitoes are abun-dant; excluding the likelihood of local infection during follow-up of confirmed cases; increasing public aware-ness of measures to reduce exposure to mosquito vectors; and retaining entomological expertise to identify local risks and apply effective larval and adult mosquito control measures.
Climate change
The possible impact of climate change on malaria in Australia has been discussed elsewhere.13,14The issue is
complex, as various mosquito species will be differentially affected by rainfall, temperature and tidal changes. The consensus is that a temperature rise of 1.5°C may extend the malaria-receptive zone southward by a couple of hundred kilometres in the Northern Territory and Queensland. This temperature rise would thus extend the area in which malaria vigilance is required but would not pose a public health problem in NSW. The risk of outbreaks after disasters such as cyclones, which are predicted to become more frequent, should be considered in northern Australia, as housing and health-care facilities could be damaged, and potentially require emergency insect control.
Conclusions
Malaria is not a major health risk in NSW although the possibility of transmission cannot be ruled out completely. Receptivity to malaria will not increase significantly with global warming of 1.5°C. The high prevalence of malaria found during screening of immigrants in Newcastle sug-gests that immigrants from malaria-endemic countries should be tested for malaria on arrival in a systematic screening program. In NSW, medical practitioners should maintain a clinical index of suspicion in cases of febrile illness, particularly with multisystem involvement. The public health capacity to respond rapidly and effectively to a malaria outbreak must be ensured.
References
1. Liu C, Broom AK, Kurucz N, Whelan PI. Communicable Diseases Network Australia National Arbovirus and Malaria Advisory Committee annual report 2004–05. Commun Dis
Vol. 19(7–8) 2008 NSW Public Health Bulletin | 131 2. Longbottom H. Epidemiology of malaria in Australia.
Commun Dis Intell 1996; 20: 84–7.
3. Hanna JS, Ritchie SA, Eisen DP, Cooper RD, Brookes DL, Montgomery BL. An outbreak of Plasmodium vivax malaria in far north Queensland, 2002. Med J Aust 2004; 180: 24–8.
4. Department of Immigration and Multicultural Affairs. Immigration Update, July–December 2005. Canberra: Commonwealth of Australia; 2006.
5. Black RH. Malaria in Australia. Service publication 9. School of Public Health and Tropical Medicine, The University of Sydney. Canberra: Australian Government Publishing Service; 1972, p. 222.
6. Bryan JH, Russell RC. Australasian malaria vectors. Trans R
Soc Trop Med Hyg 1983; 77: 278–9.
doi:10.1016/0035-9203(83)90095-0
7. Bryan JH, Foley DH, Geary M, Carven CTJ. Anopheles
annulipes Walker (Diptera: Culicidae) at Griffith, New South
Wales. Dispersal of two sibling species. J Aust Entomol Soc 1991; 30: 119–21. doi:10.1111/j.1440-6055.1991.tb00401.x
8. Anderson R, May R. Infectious diseases of humans: dynamics and control. Oxford: Oxford University Press; 1992.
9. Dye C. Vectorial capacity: must we measure all of the components? Parasitol Today 1986; 2: 203–9. doi:10.1016/0169-4758(86)90082-7
10. Dye C. The epidemiological context of vector control. Trans R
Soc Trop Med Hyg 1994; 88: 147–9.
doi:10.1016/0035-9203(94)90270-4
11. Russell RC. Seasonal abundance, longevity and population age composition of potential malaria vectors in northern and southern Australia. Aust J Zool 1987; 35: 289–306. doi:10.1071/ZO9870289
12. Brookes DS, Ritchie SA, van den Hurk AF, Fielding JR, Loewenthal MR. Plasmodium vivax malaria acquired in far north Queensland. Med J Aust 1997; 166: 82–3.
13. Bryan JH, Foley DH, Sutherst RW. Malaria transmission and climate change in Australia. Med J Aust 1996; 164: 345–7.
14. Walker J. Malaria in a changing world: an Australian perspec-tive. Int J Parasitol 1998; 28: 947–53. doi:10.1016/S0020-7519(98)00045-9
15. Macdonald G. The epidemiology and control of malaria. London: Oxford University Press; 1957.
The 2003 heat wave in Europe and climate change caused by humans have heightened interest in the relationships between climate and public health generally, and heat-related morbidity and mortality in particular.1–3 While
many studies have examined heat-related mortality, in some cases associated with specific heat waves, fewer studies have examined heat-related morbidity; for example, by analysis of hospital records.4–10 The study
examines the hospital admission rates and patient charac-teristics for severe heat-related morbidity in New South Wales (NSW) by analysing routinely-collected hospital inpatient data.
Methods
Data used in the study were from the NSW Health Inpatient Statistics Collection (ISC). The ISC is a census of all admitted patient services provided by NSW public hospitals, public psychiatric hospitals, public multi-purpose services, private hospitals and private day proce-dures centres.11Eleven years of de-identified unit record
data were obtained for the period 1 July 1993 to 30 June 2004. Clinical information in the ISC, such as principal diagnosis, additional diagnoses and external causes of injury or poisoning, is coded according to the
Admission to hospital for effects of heat
and light: NSW, 1993–94 to 2003–04
Abstract: The study examined the hospital admis-sion rates and characteristics of patients experienc-ing severe heat-related morbidity in NSW usexperienc-ing data from the NSW Health Inpatient Statistics Collection. The study covered the 11-year period from July 1993 to June 2004. ICD-10-AM. codes examined included T67 (effects of heat and light). There was an average of 91 admissions for each year due to a principal diagnosis of the effects of heat and light, with consistently more males than females admitted (1.7 : 1). Many of the admissions (39%) were of people 65 years of age or older. Most admissions (49%) occurred in the summer months of December and January.
Paul J. Beggs
A,Band Pavla Vaneckova
AADepartment of Physical Geography, Macquarie University
BCorresponding author. Email: [email protected]
International Statistical Classification of Diseases and Related Health Problems – Tenth Revision – Australian Modification (ICD-10-AM). Codes examined included T67 (effects of heat and light), incorporating T67.0 (heat-stroke and sun(heat-stroke), T67.1 (heat syncope), T67.2 (heat cramp), T67.3 (heat exhaustion, anhydrotic), T67.4 (heat exhaustion due to salt depletion), T67.5 (heat exhaustion, unspecified), T67.6 (heat fatigue, transient), T67.7 (heat oedema), T67.8 (other effects of heat and light) and T67.9 (effect of heat and light, unspecified). External causes Y40–Y59 (drugs, medicaments and biological substances causing adverse effects in therapeutic use) used in addition to a T67 diagnosis were also examined.
Temporal characteristics were examined by analysis of the data by year, month and day of the week. Spatial charac-teristics were examined through analysis of the data by sta-tistical division. Stasta-tistical division is an Australian Standard Geographical Classification defined area, which represents a large, general purpose, regional-type geo-graphic area. Statistical divisions represent relatively homogeneous regions characterised by identifiable social and economic links between the inhabitants and between the economic units within the region.12There are a total of
12 statistical divisions in NSW. Spatial characteristics were also examined through analysis of the data by latitu-dinal (north or south) and coastal/non-coastal groupings of statistical divisions. The six statistical divisions north of approximately 33.3°S were categorised as ‘north’, and the six statistical divisions south of this latitude were cate-gorised as ‘south’. The six statistical divisions with a coastal border were categorised as ‘coastal’, while those without a coastal border were categorised as ‘non-coastal’. Rates were age-standardised using the 1996 Australian population.
Results
Vol. 19(7–8) 2008 NSW Public Health Bulletin | 133 to year, with a minimum of 50 in 1999–00 and a maximum
of 146 in 2002–03 (Table 1). The crude average annual statewide hospital admission rate for the effects of heat and light was 1.5 for every 100 000 population. There were consistently more males than females admitted due to a
Hospitalisation for effects of heat and light
principal diagnosis of effects of heat and light, with the ratio ranging from 1.2 : 1 to 3.1 : 1, and the overall ratio of 1.7 : 1. Admissions due to a principal diagnosis of effects of heat and light spanned all age groups, with a minimum age of less than 1 year and a maximum of 103 years. Table 1. Summary of the number of admissions for effects of heat and light (T67: ICD-10-AM) in
NSW from 1993–94 to 2003–04
Year Principal Additional Total n Sex (M : F)* Age (years)*
diagnosis n diagnosis†n Range Median
1993–94 80 31 111 1.3 : 1 1–91 50
1994–95 80 34 114 1.4 : 1 9–99 62
1995–96 55 27 82 1.2 : 1 1–97 48
1996–97 78 19 97 1.7 : 1 7–97 43
1997–98 101 42 143 1.9 : 1 <1–95 48
1998–99 78 20 98 1.5 : 1 1–89 58.5
1999–00 50 23 73 1.9 : 1 13–98 61.5
2000–01 116 36 152 1.6 : 1 2–91 54
2001–02 78 17 95 3.1 : 1 <1–99 40.5
2002–03 146 27 173 1.9 : 1 <1–103 52.5
2003–04 139 20 159 1.7 : 1 <1–96 49
Total 1001 296 1297 1.7 : 1 <1–103 52
*These relate only to principal diagnosis.
†This includes six records for which T67 was also used as the principal diagnosis (1 in 1993–94, 1997–98,
1999–00, 2000–01, 2001–02 and 2002–03), and two records for which T67 was used as more than one additional diagnosis; additional diagnoses 2 and 3 in 1995–96, and additional diagnoses 1 and 2 in 2002–03. ICD-10-AM: International Statistical Classification of Diseases and Related Health Problems – Tenth Revision – Australian Modification.
Source: NSW Health Inpatient Statistics Collection.
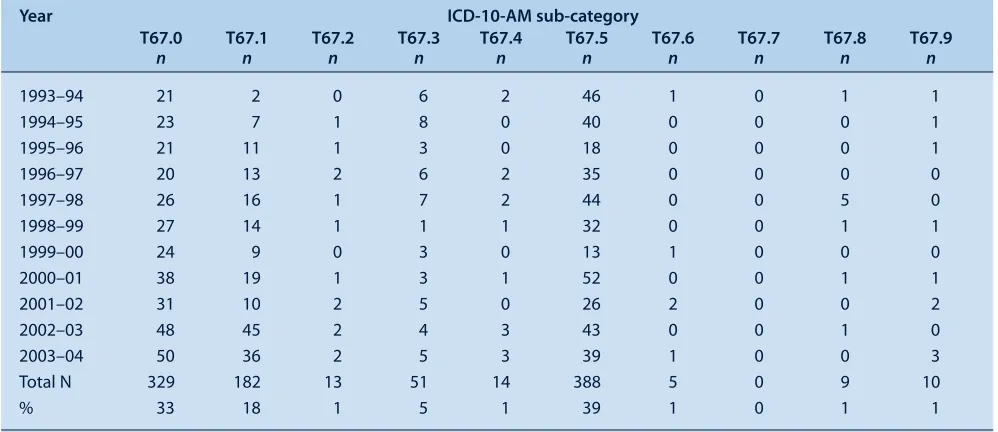
Table 2. Number of admissions for principal diagnosis for each ICD-10-AM sub-category of effects of heat and light (T67) in NSW for each year from 1993–94 to 2003–04
Year ICD-10-AM sub-category
T67.0 T67.1 T67.2 T67.3 T67.4 T67.5 T67.6 T67.7 T67.8 T67.9
n n n n n n n n n n
1993–94 21 2 0 6 2 46 1 0 1 1
1994–95 23 7 1 8 0 40 0 0 0 1
1995–96 21 11 1 3 0 18 0 0 0 1
1996–97 20 13 2 6 2 35 0 0 0 0
1997–98 26 16 1 7 2 44 0 0 5 0
1998–99 27 14 1 1 1 32 0 0 1 1
1999–00 24 9 0 3 0 13 1 0 0 0
2000–01 38 19 1 3 1 52 0 0 1 1
2001–02 31 10 2 5 0 26 2 0 0 2
2002–03 48 45 2 4 3 43 0 0 1 0
2003–04 50 36 2 5 3 39 1 0 0 3
Total N 329 182 13 51 14 388 5 0 9 10
% 33 18 1 5 1 39 1 0 1 1
ICD-10-AM: International Statistical Classification of Diseases and Related Health Problems – Tenth Revision – Australian Modification. T67.0: heatstroke and sunstroke; T67.1: heat syncope; T67.2: heat cramp; T67.3: heat exhaustion, anhydrotic; T67.4: heat exhaustion due to salt depletion; T67.5: heat exhaustion, unspecified; T67.6: heat fatigue, transient; T67.7: heat oedema; T67.8: other effects of heat and light; T67.9: effect of heat and light, unspecified.