A b s t r a c t.The aim of this study was to investigate the influence of temperature on water content value measured by ECH2O-TE sensors. The influence of temperature on measured soil water content values was clearly demonstrated. Soil water content values measured during the day apparently oscillated with oscilla-ting soil temperatures. Average daily temperature and soil water con-tent were calculated for selected periods. Regression relationships between deviations of soil temperature and soil water content from their daily average values were evaluated. Correlation between the soil water content and temperature deviations increase with the soil depth due to the lower influence of rainfall and evaporation at the soil surface on measured soil water content values in deeper soil layersegsoil water content oscillation was controlled mostly by oscillating temperature.The guideline values of linear regression equations (R2>0.8) were very similar, close to value 0.002 and the intercept values were equal to zero. The equation for recalculation of measured soil water content values at given temperature to refe-rence soil water content for referefe-rence soil temperature, was propo-zed on the basis of this analysis.
K e y w o r d s: water content, temperature, sensor ECH2O-TE, sensor temperature dependence, correction equation
INTRODUCTION
Soil water content is a basic property for soil water re-gime and its balance evaluation. Continuous monitoring of soil water content (or soil water potential) is important for the optimization of some plant irrigation. The need of actual soil water content knowledge has been increasing with the more frequent inundations during recent years. The actual soil water content in a river-basin and the ability of soil to infiltrate water are the key properties for water retention in
soil and water runoff. The gravimetric soil water content de-termination is the most accurate method. However, soil sam-ples must be removed from a soil and therefore this method is not suitable for continual soil water content monitoring. Widely acceptable in situ non-destructive methods to mea-sure soil water content (Dane and Topp, 2002) are radio-active methods such as the neutron scattering method and the gamma ray attenuation method. However, these methods require calibration for each soil and special caution is need-ed to avoid a possible health hazard. Other widely usneed-ed me-thods are based on measuring the dielectric constant of the media using different technologies such as: capacitance, frequency domain reflectometry, time domain reflectometry and time domain transmission. An overview of various me-thods, theories and applications were given among others by Friedman (2005), Noborio (2001), and Wraithet al.(2005). Dielectric sensors are relatively easy to use, but again they require calibration for each soil and sometimes also for each sensor. Sensors vary in size, accuracy and price depending not only on applied methodology but also on their expected application. The fundamental relationship between soil dielectric permittivity and volumetric soil water content,q, is well understood. Due to the fact that the dielectric of water is about 80, while other soil constituents are between 1 and 5, changes in soil dielectric permittivity are highly correlated with soil water content. However, the measurements may also be impacted by the other soil environmental factors, such as soil water salinity (Kodešová et al., 2011b) and temperature (Bogenaet al., 2007; Evettet al., 2006; Kizitoet al.,2008; Ruth and Munch, 2005; Verhoefet al.,2006), soil texture (Chandleret al., 2004; Guberet al., 2010; Kodešová et al.,2011b; Seyfried and Murdock, 2004; Wraith and Or, Int. Agrophys., 2012, 26, 259-269
doi: 10.2478/v10247-012-0038-2
Influence of temperature on soil water content measured by ECH
2O-TE sensors**M. Koèárek* and R. Kodešová
Department of Soil and Soil Protection, Czech University of Life Sciences, Prague, Kamýcká 129, Prague 6 - Suchdol, 165 21, Czech Republic
Received September 5, 2011; accepted February 16, 2012
© 2012 Institute of Agrophysics, Polish Academy of Sciences
*Corresponding author’s e-mail: [email protected]
**This work was supported by the Czech Science Foundation, Grant No. 526/08/0434, and by the Ministry of Education, Youth and Sports of the Czech Republic, Project No. 2B06095 and by Czech University of Life Sciences, Grant No. 31130/1313/313132.
1999), soil specific surface area (Skierucha, 2009), soil che-mical composition and soil bulk density (Kodešováet al., 2011b; Verhoefet al.,2006) as well as other factors, such as measurement frequency which can range from 5-500 MHz (Chen and Or, 2006; Kizito et al., 2008; Seyfried and Murdock, 2004). Chandleret al.(2004) refer to the need for calibration of each sensor to correct the inter-sensor varia-bility. Also the water status affects the soil dielectric con-stant andqmeasurement. The effect of soil free water and soil bound water is reported by Or and Wraith (1999) and Skierucha (2009). These authors describe two competing phe-nomena: increase of soil bulk dielectric conductivity with temperature following the release of bound water from soil solid particles, and decrease of soil bulk dielectric conducti-vity with temperature increase following the temperature effect of free water molecules. These competing phenomena equalize with characteristic water content for each soil.
Consequently, many dielectric techniques require soil specific calibrations, which create an added level of soil input that is not necessarily available. In addition, permit-tivity is a function of temperature, therefore temperature changes affect the measuredq, however, it has proven
dif-ficult to deal with, because of the complex nature of the underlying processes. Or and Wraith (1999) reported on the complex interactions between soil particle surfaces and surrounding water molecule dipoles that cause water to be invisible to the TDR measurement at high measurement frequencies because of the surface forces. Campbell (2001) reported that with increasing soil temperatures these surface forces reduce in strength, thereby causing a positive rela-tionship between soil water content and temperature. Moreover, for temperatures from 5 to 35°C the dielectric
constant of water decreases by 0.7% °C-1. In sandy and loamy soil, the ECH2O had only a small change in soil water content due to differences in temperature, but in clays changes of 0.003 m3m-3°C-1
were observed. Kizitoet al., (2008) tested the temperature sensitivity of the ECH2O –TM sensor in air and water. While the air data test shows very little sensitivity to temperature, the temperature sensitivity in water samples was consistent with the theory that die-lectric of water decreases with temperature. Kizito et al. (2008) also found the negativeDq/Dt– relationship for low
surface area wet soils, and positiveDq/Dt– relationship for high surface area wet soils, supporting the theory of Or and Wraith (1999) noted above. Meadet al. (1996) also studied daily soil water content fluctuations, as measured by a capa-citance probe, under a variety of temperature and soil condi-tions. They concluded that temperature fluctuations did cause a real fluctuation in soil water near the soil surface. They found that the devices itself is likely to be affected by temperature. Increased soil temperature caused an increase in apparentqand wetter soils displayed higher fluctuations than drier soils within varying temperature regimes. Kizito et al. (2008) reported that under laboratory conditions, for a temperature change of 10°C, measurements of soil water
content were affected by approximately 0.02 cm3 cm-3. Temperature sensitivity did not change as a result of the higher frequency, but appears to be correctable through data processing. Nevertheless, the temperature dampening effect of soil will reduce the need for temperature correction in many applications. Although other studies have suggested that higher measurement frequencies are attractive to miti-gate the effects soil type, temperature and EC, this study shows a significant improvement even at the 70 MHz level. Czarnomski et al. (2005) found a slight tendency of soil water content to decrease as temperature increased. Verhoef et al.(2006) compared results of various sensors in various vegetation. For the bare soil field, Profile Probes and ML2x ThetaProbes indicated a diurnal course of that did not con-cur with typical soil physical observations: surface layer soil water content increased from early morning until about midday, after whichqdeclined, generally until the early eve-ning. The unexpected course of was positively correlated to soil temperature, ts, also at deeper depths. Aquaflex and ML1 ThetaProbe (older models) outputs, however, reflected common observations:qincreased slightly during the night (capillary rise) and decreased from the morning until late afternoon (as a result of evaporation). Authors reported that the effects of soil water-temperature interactions are gene-rally small, in particular for situations where vapour trans-port only plays a minor role. Therefore, it was most likely that the soil temperature directly affected the sensor. Seyfried and Murdock, (2001) observed a small statistically significant effect of temperature on Water Content Reflecto-meter (WCR; Campbell Scientific, Logan, UT) response in air. Since the dielectric constant of air is not affected by tem-perature, these effects are indicative of the effect of tempe-rature on instrument electronics. The soil water calibration for each of the four tested soils was identical when the soil water content was zero. However, as soil water content increased, the calibration for each soil diverged significantly so that each soil required a separate calibration curve to relateqandP(wave period). For the sand, the temperature effect was negative, while for the other soils it was strongly positive, resulting in a large apparentqchange across a 40°C temperature change. The effect of temperature on sensor response was also significantly different for each soil. The low EC of sand in comparison with other tested soil probably caused the negative effect of sensors in sand.
Several equations to correct the influence of soil tempe-rature to measured soil water content values are proposed by Czarnomskiet al. (2005); Kizitoet al.(2008); Or and Wraith (1999); Seyfried and Murdock (2001); and Verhoefet al. (2006). For instance Campbell (2002) suggested the equa-tion to correct the temperature effect for ECH2O probes:
qt r q
i m
t C
t C
= +
+ , (1)
where:qt is the temperature-corrected soil water content,
at which the measurement was made (both in°C); andCis a correction factor. For the ECH2O probe, as tested using sandy loam data, Campbell (2002) found the correction factor to vary considerably (ranging roughly between 10 and 500), being a function of (approximately following a qua-dratic function).
The ECH2O-TE sensors (Decagon Devices, Inc.) were tested in our study. In contrast to some of the previously mentioned studies, results of our three years soil water con-tent and soil temperature monitoring under field conditions indicated that the effect of soil temperature on measured soil water content values is quite significant.
The aim of this study was to analyze the soil water con-tent sensor temperature dependence under field conditions and to propose a new equation for correcting the influence of soil temperature to measured soil water content values.
MATERIAL AND METHODS
The ECH2O-TE (Decagon Devices, Inc.) is a 5 cm, three-pronged soil water content probe, which measures volu-metric water content, temperature, and electrical conducti-vity of soil (Anonymous, 2007). Theprobe uses an electro-magnetic field to measure the dielectric permittivity of the surrounding medium. The probe supplies a 70 MHz oscilla-ting wave to the probe prongs that charges according to the dielectric of the material. Electrical conductivity (EC) is measured by applying an alternating electrical current to two outer electrodes, and measuring the voltage between two inner ones. Both this voltage and the current are used to de-termine conductance. Conductivity is then derived by multi-plying voltage and conductance by the cell constant (the ratio of the distance of the electrodes to their area). The ECH2O-TE uses a surface-mounted thermistor to take
tem-perature readings. It is located underneath the probe over-mold, next to one of the prongs. Because it is soldered to the copper ground trace on the board, it is in thermal contact with the probe prongs and reads an average temperature along the prong surface. The ECH2O-TE has been recently
replaced by the all-digital, high-frequency 5TE soil water content probe. The 5TE has, according to the sensor produ-cer (Anonymous, 2010) improved accuracy, improved dura-bility and reliadura-bility due to a change in the way electrical conductivity is measured.
Soil water content and soil temperature measurements and sensor testing were performed at the experimental field of Czech University of Life Sciences (CULS) in Prague. Soil was defined asHaplic Chernozem (diagnostic horizons Ap 0-30 cm, A/C 30-40 cm, C40-150 cm). Experiments were performed during a 3 year period (2008-2010). Soil was initially cultivated to the depth of 25 cm (2008). The second cultivation was done at the beginning of the year 2010. No cultivation was performed in 2009. No crop was planted at the monitored area. The main properties of the Haplic Chernozem surface and subsurface horizon, which were published in the study of Kodešováet al.(2011a), are given in Table 1.
Sensors were first calibrated for surface A and sub-surface C horizons under 20°C laboratory conditions using the same procedure as described by Kodešováet al.(2011b). Six ECH2O-TE sensors and six plastic cylinders (volume of 606 cm3, height of 6 cm) were used for each soil horizon to calibrate sensors for distilled water. The sensor was placed vertically into each cylinder together with the soil material. A specific amount of soil was prepared for each cylinder and soil sample to obtain the same bulk density (1.58 and 1.75 g cm-3for A and C horizon, respectively) as was measured on the 100 cm3soil samples. Soil was wetted before packing using 30, 60 and 90 cm3of distilled water (the same amount for 2 cylinders) using a sprayer. Each soil sample was weighed immediately after packing to obtain soil water content gravimetrically. Simultaneously RAW counts were measured using the ECH2O sensors which were placed in
the soil permanently. All soil samples were then wetted using another 90 cm3 of distilled water and placed into plastic bags for 24 h to let the water redistribute within the soil sample. The soil samples were then weighed again, and RAW counts were measured. The Procedure was repeated until full saturation of soil samples was reached. Despite that known amount of water was applied, a gravimetric method, which is an only direct reference method, was used to determine volumetric soil water content. Assuming specific density of water to be 1 g cm-3, soil water content was eva-luated as a ratio of mass of water (difference between mass of wet soil and mass of soil dried under 105°C) and sample volume. I linear equation was used to fit measured data points (measured RAW counts and soil water content, q).
Horizon
pHKCl pHH2O EA CEC HA BCS SCS OM CaCO3 Salinity z Sand Silt Clay
(-) (-) (mmol+ kg-1) (%) ( S cm-1) (g cm-3) (%)
A 7.21 7.69 0.72 263.8 4.2 259.6 98.4 3.47 7.8 43.7 2.52 24.4 56.3 19.3
C 7.4 8.14 0.99 241.3 3.02 238.28 98.7 0.76 11.6 7.7 2.53 23.7 51.8 24.5
T a b l e 1.Basic chemical and physical soil properties of A and C horizons of studied Haplic Chernozem: pHKCl, pHH2O, exchangeable
The final calibration equations for A (R2= 0.915) and C (R2= 0.992) horizons were:
q= 0.0012 RAW - 0.708 (2)
q= 0.0013 RAW - 0.808 (3)
ECH2O-TE sensors were placed in the soil profile to the
depths of 5, 10, 25, 50 and 80 cm. Soil water content and soil temperature were measured at 15 min intervals. In addition tensiometers installed to the depths of 10, 25, 47 and 80 cm were used to measure pressure head (data are not discussed in this study). Air temperature and amount of rainfall were measured at the meteorological station of the Department Agroecology and Biometeorology CULS. As mentioned above, all measurements were carried out during the 3 year monitoring period.
The period with minimal rainfall and with visible daily oscillations of soil water content values due to daily tempe-rature oscillations were chosen for every monitored year. These periods were chosen to avoid abrupt changes of soil water content. In 2008, this period took place from 2nd September to 28th September and was characterized by relatively well-balanced soil water content levels and a dra-matic drop in temperatures in the mid-term. In 2009, a period from 24th August to 8th September was characterized by relatively well-balanced values of average soil temperature but high daily oscillation of soil temperature and soil water content visible up to 25 cm of soil depth. Two periods were chosen in 2010. The first period lasted from 3rd March to 11th March and was characterized by low temperature (with
a frequent occurrence of temperature below zero in the soil depth of 5 cm) and by high oscillation of soil temperature and soil water content in the first part of this period and low oscillation of soil temperature and soil water content in the second part of this period. The second period in 2010 (from 29th June to 5th July) was characterized by high oscillation of soil temperature and soil water content up to 25 cm of soil depth and with an opposite trend of soil temperature (up-trend) and soil water content (down(up-trend). The average, ma-ximal and minimal values of soil temperature and soil water content in monitored periods in appropriate soil depths which demonstrate the difference between the chosen periods are presented in Table 2.
To assess the impact of temperature on soil water con-tent values measured using the ECH2O-TE sensors using
data measured directly in the field, we proposed a new methodology as follows:
– the average temperatures and soil water content values were calculated for every day,
– the regression relationships between the deviations of soil water content (Dq) and soil temperature (Dt) from their average daily values were evaluated.
RESULTS
The measured values of soil water content and soil temperature measured using the ECH2O-TE sensors during
the chosen periods are presented in Figs 1, 3, 5 (2008, 2009, 2010, respectively). These figures clearly demonstrate that the soil water content values were affected by soil tempera-ture values. Fluctuation of daily temperatempera-tures observed at
Year Soil depth (cm)
Period (days)
Temperature Water content
Average Min. Max. Average Min. Max.
(OC) (cm3cm-3)
2008
5 245 - 271 15.46 8.00 25.90 0.20 0.17 0.24
10 245 - 250 20.12 16.20 25.90 0.22 0.21 0.24
25 260 - 268 11.96 8.40 17.80 0.19 0.18 0.22
2009
5 235 - 250 19.84 11.20 32.80 0.07 0.02 0.27
10 235 - 250 20.92 13.40 30.30 0.12 0.08 0.16
25 235 - 250 20.44 15.90 24.70 0.13 0.12 0.14
2010 5 61 - 69 0.18 -1.90 6.40 0.10 0.05 0.28
10 61 - 69 1.04 -0.50 5.50 0.16 0.10 0.29
2010
5 179 - 185 27.29 15.00 40.60 0.09 0.03 0.14
10 179 - 185 27.02 16.80 37.40 0.15 0.13 0.17
25 179 - 185 24.89 18.60 30.40 0.16 0.16 0.17
T a b l e 2.The average, maximal and minimal values of soil temperature and soil water content in monitored periods in appropriate soil
soil depths of 5 and 10 cm (in some cases also in the soil depth of 25 cm) caused the oscillation of measured values of soil water content. No daily oscillations of temperature and soil water contents were observed in the depths of 50 and 80 cm.
Figure 1 shows that the period from 2nd September to 29th September in 2008 was characterized by relatively well-balanced soil water content levels and a dramatic drop in temperature during the mid-term. The analysis during this period of soil water content measurement dependence on soil temperature at the depth of 10 cm, are presented in Fig. 2. Analyses were also performed for the depth of 5 cm (not shown), but no relationship between the soil temperature and soil water content was found, because the soil water con-tent changed due to rainfall and evaporation from the soil sur-face in this period (the measured values of soil water content were not dependent only on the temperature). Figure 2a shows the relationship between soil temperature and Dq (soil water content deviation from its average daily value). It is clear that the resulting points are divided into two seg-ments. This distribution is a result of the different average tem-perature in the first and second part of the period (Fig. 1a).
The resulting relationship between the deviations of soil water content and soil temperature from their average daily values (Fig. 2b) shows relatively good agreement. The
pe-riod was consequently divided into two sub-pepe-riods: first with the higher temperature (Fig. 2c) and second with the lower temperature (Fig. 2d). This division brought about a significant refinement of the relationship between soil water content and temperature in the first period.
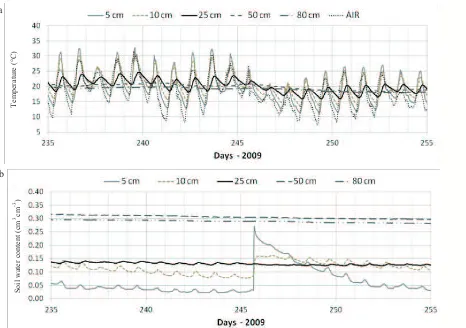
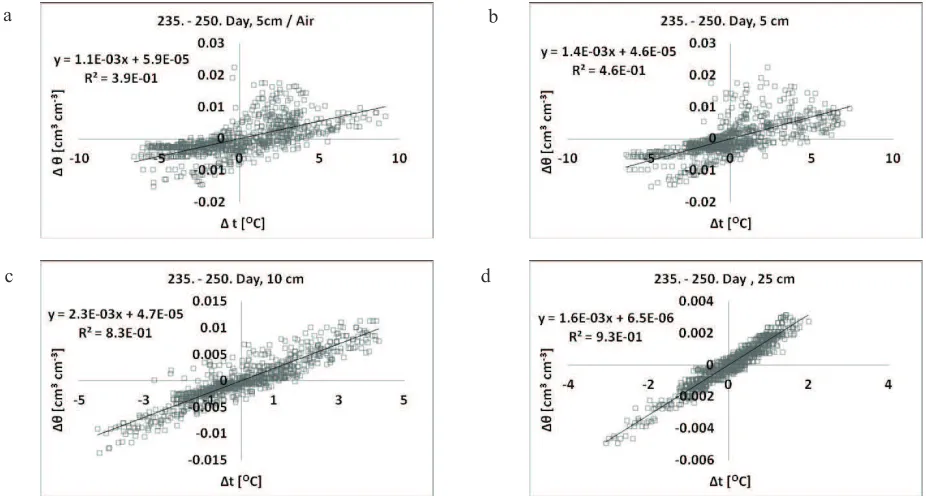
The period from 24th August to 13th September was chosen in 2009 (Fig. 3). This period wascharacterized by soil water content oscillation in the depth of 5, 10 and 25 cm and relatively well-balanced values of average soil tempe-rature but high daily oscillation of soil tempetempe-rature and soil water content, which were apparent up to the depth of 25 cm. The daily average soil temperature in this period was well-balanced in comparison with 2008. Figure 4 shows the relationship between soil water content and soil temperature deviations from their daily average values measured in the depths of 5, 10, 25 cm (Fig. 4b, c, d) and between soil water content deviations from its daily average values in the depth 5 cm and air temperature (Fig. 4a) during this period. The weakest relationship was found for soil water content at the depth of 5 cm and air temperature (R2= 0.39). A slightly greater dependence (R2= 0.46) was found for the relation-ship between deviations of soil water content and soil tem-perature in the depth of 5 cm. The relationship increased stronger with an increasing soil depth (10, 25 cm,R2=0.83,
Fig. 1.Values of soil: a – temperature, and b – water content; measured in each soil depth in the period of 2nd September to 28th September (245.-271. day).
a
b
Soil
water
content
(cm
3 cm -3 )
Soil
temperature
Fig. 2.Relationship between deviations of: a – soil water content values from average daily values (Dq) and temperature (t) (in the
period 245-271 days); soil temperature from average daily values (Ät)in the period of: b – 245.-271. day, c – 245.-250. day, d – 260.-268. day; in soil depth 10 cm in 2008.
Fig. 3.Values of soil: a – temperature, b – water content measured in each soil depth in the period of 24th August to 13th September
(235.-255. day).
a b
d c
b a
Temperature
(°C)
Soil
water
content
(cm
R2= 0.93, respectively). The weak dependence near the soil surface was found due to the changes of soil water content due to rainfall and transpiration from the soil surface, which had a decreased impact with soil depth.
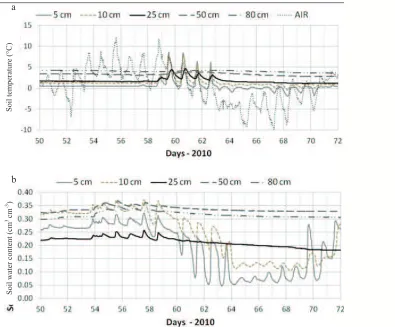
In the year 2010, the period from 3rd March to 11th March was chosen to study the relationship between the soil water content and temperature. This period was characte-rized by low temperatures (with a frequent occurrence of temperatures below zero in the soil depth of 5 cm) and by high oscillation of soil temperature and soil water content in the first part of this period and low oscillation of soil tem-perature (Fig. 5a) and soil water content (Fig. 5b) in the se cond part of this period. The relationship between deviations of soil water content and soil temperature values from daily averages in the depth of 5 and 10 cm are presented in Fig. 6. In this period the weakest relationship between the devia-tions from daily averages of measured values of soil water content and soil temperature was found. It could have been caused by the low temperatures in this season. Soil temperature in the depth of 5 cm was often below zero and the average temperature was 0.2°C. Only a slightly stronger relationship between the deviations from daily averages of soil water content and soil temperature values was found in the soil depth of 10 cm. The average temperature in the soil depth of 10 cm was 1°C.
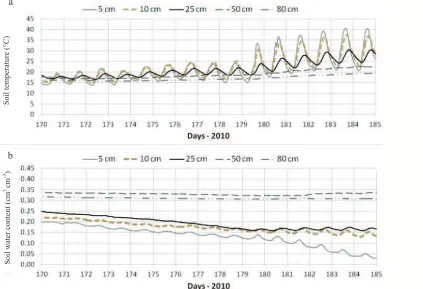
The second period from 20th June to 5th July was cho-sen in 2010. There are evident oscillations of soil tempera-ture and soil water content up to 25 cm of soil depth (Fig. 7). Moreover, this period is characterized by an uptrend of soil
temperature and a downtrend of soil water content values. The relationship between deviations of soil water content values from average daily values (Dq) and deviations of air temperature from average daily values (Dt) and soil water
content values from average daily values (Dq) and devia-tions of soil temperature from average daily values in this period is shown in Fig. 8. The best correlation between mea-sured soil temperature and soil water content values was found in the term from 29th June to 5th July (Fig.9). Similar as in 2009 the relationship between measured values of soil water content and soil temperature increased with increasing soil depth. The weakest relationship observed in topsoil could have been caused by soil water content changes due to rainfall and evaporation of water from the soil surface, of which the impact decreased with soil depth.
DISCUSSION
The soil temperature fluctuation caused by the solar radiation warming up the bare soil surface was observed in the surface A horizon up to the depth of 25 cm. The positive effect of soil temperature on measured soil water content was observed in the three monitored soil depths (5, 10 and 25 cm) of the surface horizon. These results are contradictory to the dielectric theory, because the dielectric constant of water decreases with increasing temperature. Similar results that contradict dielectric theory were presented by Verhoefet al. (2006) also in deeper soil depths. A Similar effect of soil temperature fluctuations on measured soil water content Fig. 4.Relationship between deviations of soil water content values from average daily values (Äè)and deviations of air temperature from average daily values (Ät)(a) and soil water content values from average daily values (Äè)and deviations of soil temperature from average daily values measured in the soil depths: b – 5, c – 10, and d – 25 cm in the period of 24th August to 8th September 2009 (235.-250. day).
a b
near the soil surface was also described by Mead et al. (1996). It should also be mentioned that the variable soil sa-linity may affect soil water content measurements(Kodešová et al., 2011b; Toppet al., 1980). However, in our case the soil salinity (Table 1) was low and no significant change during the studied periods was expected.
Correlations between deviations of measured soil water content and soil temperature values from their daily average values increased with increasing soil depths. This is due to the decreasing influence of soil water content changes as
a consequence of rainfall and water evaporation from the soil surface of the monitored soil profile. The linear relationship between the Dq and Dt was found in all
monitored periods and soil depths. The intercepts of all found regression equations were close to zero and slope values of linear equations (R2>0.8) were quite similar, fluctuating around the value of 0.002. This is also documented in Fig. 10 where theDtversusDqvalues for the depth of 10 cm and all tested periods (except the cold period in 2010) were plotted. The measured soil water content Fig. 6.Relationship between deviations of soil water content (Äè)and soil temperature (Ät)values from average daily values in the soil depths: a – 5, b – 10 cm in the period of 3rd March to11th march 2010 (61.-69. day).
Fig. 5.Values of soil temperature (a) and soil water content (b) water content measured in each soil depth in the period of 20th February to 14th march (50.-72. day).
b a
b a
Soil
water
content
(cm
3cm -3)
Soil
temperature
Fig. 8.Relationship between deviations of soil water content values from average daily values (Äè)and deviations of air temperature from average daily values (Ät)(a) and soil water content values from average daily values (Äè)and deviations of soil temperature from average daily values (b) in the period of29th June to 5th July 2010 (179.-185. day).
Fig. 7.Values of: a – soil temperature, b – soil water content measured in each soil depth in the periodof 20th June to 5th July (170.-185.
day).
Fig. 9.Relationship between deviations of soil water content values from average daily values (Äè)and deviations of soil temperature from average daily values (Ät) inthe soil depths 10 cm (a) and 25 cm (b) in the period of 29th June to 5th July 2010 (179.-185. day).
b a
b a
b a
Soil
water
content
(cm
3 cm -3 )
Soil
temperature
value (qm) at the corresponding measured soil temperature
(tm) can then be converted under this assumption to the
reference soil water content (èref) for reference temperature
(qref) using the following equation:
qref =qm-0002. (tm-tref ) . (4)
Since the sensors are usually calibrated in the laboratory at 20 °C, reference temperature value may be set to 20°C.
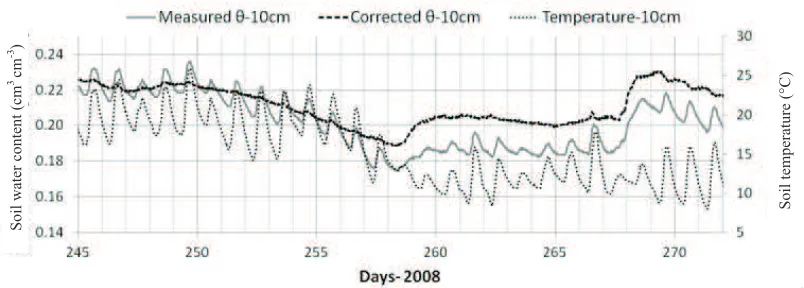
The soil water content correction using the proposed Eq. (4) is documented for the depth of 10 cm and the period in 2008 (Fig. 11). It is evident that when temperatures oscillated around 20°C, correction smoothed the soil water content measurements. When the average daily temperature differed for the 20°C value, the soil water content measu-rements were smoothed and shifted.
Study under field conditions proved the correction value reported by Kizitoet al. (2008), who studied water content measurement dependence on temperature under laboratory conditions. The temperature change of 10°C caused a diffe-rence in soil water content measurement of 0.02 cm3cm-3.
CONCLUSIONS
1. The evident influence of the soil temperature on the soil water content values measured in the field using the ECH2O-TE sensors was observed during the 3 years moni-toring campaign.
2. A new procedure was proposed to quantify observed soil water content sensor temperature dependence. The average daily soil water content and soil temperature values were calculated for each period. The relationship between the deviation of soil water content (Dq) and soil temperature (Dt) values from their average daily values were evaluated.
3. The positive effect of soil temperature on measured soil water content was observed in the three monitored soil depths (5, 10 and 25 cm) of the surface horizon. These re-sults run contrary to the dielectric theory, because the dielec-tric constant of water decreases with increasing temperature. 4. The linear relationships between Dq andDt were found for all monitored periods and soil depths. The slope va-lues of linear regression equations were very similar, close to value 0.002, and the intercept values were equal to zero.
5. The equation for the recalculation of measured soil water content values at a given temperature to the reference soil water content for the reference soil temperature was proposed on the basis of this analysis.
REFERENCES
Anonymous, 2007.ECH2O-TE/EC-TM Water Content, EC and Temperature Sensors Operator’s Manual. Decagon Devices Inc., Pullman Press, Pullman, WA, USA.
Anonymous,2010.Water Content, EC and Temperature Sensors Operators Manual. Decagon Devices Inc.,
http://www.decagon.com/ assets/Manuals/5TE-Manual.pdf
Bogena H.R., Huisman J.A., Oberdorster C., and Vereeckeen
H., 2007.Evaluation of a low-cost soil water content sensor
for wireless network applications. J. Hydrol., 344, 32-42.
Campbell C.S., 2001.Response of the ECH2O soil moisture probe
to variation in water content, soil type, and solution electrical Fig. 10.Relationship between deviations of soil water content
va-lues from average daily vava-lues (Äè) and deviations of soil tempera-ture from average daily values (Ät) in the soil depth of 10 cm bet-ween September 2 to 28, 2008 (245.-271. day), August 24 to Septem-ber 13, 2009 (235.-255. day) and June 20 to July 5, 2010 (170.-185. day).
Fig. 11. Soil water contents measured in the depth of 10 cm during the period of 2nd September to 28th September(245.-271. day),
corrected soil water contents using Eq. (4) and soil temperatures.
Soil
water
content
(cm
3cm -3)
Soil
temperature
conductivity. http://www.decagon.com/appnotes/echo_ana lysis.pdf
Campbell C.S., 2002.Response of ECH2O soil moisture sensor to
temperature variation, Decagon Application Note, http.//www.degacon.com
Chandler D.G., Seyfried M., Murdock M., and McNamara J.P.,
2004.Field calibration of water content reflectometers. Soil
Sci. Soc. Am. J., 68, 1501-1507.
Chen Y. and Or D., 2006.Geometrical factors and interfacial
processes affecting complex dielectric permittivity of par-tially saturated porous media. Water Resour. Res., 42, W06423 9 PP., doi:10.1029/2005WR004744.
Czarnomski N.M., Moore G.W., PypkerT.G., Licata J., and Bond
B.J., 2005.Precision and accuracy of three alternative
instru-ments for measuring soil water content in two forest soils of the Pacific Northwest. Can. J. For. Res., 35, 1867-1876.
Dane H. and Topp G.C., 2002.Methods of Soil Analysis. Part 4.
Physical Methods. SSSA Press, Madison, WI, USA.
Evett S.R., Tolk J.A., and Howell T.A., 2006.Soil profile water
content determination: Sensors accuracy, axial response, calibration, temperature dependence, and precision. Vadose Zone, 5(3), 894-907.
Friedman S.P., 2005.Soil properties influencing apparent
electri-cal conductivity: a review. Computers Electronics Agric., 46(1-3), 45-70.
Guber A.K., Pachepsky Y.A., Rowland R., and Gish T.J., 2010.
Field correction of the multisensor capacitance probe cali-bration. Int. Agrophys., 24, 43-49.
Kizito F., Campbell C.S., Campbell G.S., Cobos D.R., Teare B.L.,
Carter B., and Hopmans J.W., 2008.Frequency, electrical
conductivity and temperature analysis of a low-cost capaci-tance soil moisture sensor. J. Hydrol., 352, 367-378.
Kodešová R.,Koèárek M., Kodeš V., Drábek O., Kozák J., and
Hejtmánková K., 2011a.Pesticide adsorption in relation to
soil properties and soil type distribution in regional scale. J. Hazard. Materials, 186, 540-550.
Kodešová R., Kodeš V., and Mráz A., 2011b.Comparison of two sensors ECH2O EC-5 and SM200 for measuring soil water
content. Soil Water Res., 6(2), 102-110.
Mead R.M., Soppe R.W.O., and Ayars J.E., 1996.Capacitance
probe observations of daily soil moisture fluctuations. , Proc. Int. Conf. Evapotranspiration and Irrigation (Eds C.J. Camp, E.J. Sadler, R.E. Yoder). November 3-6, San Antonio, TX, USA.
Noborio K., 2001.Measurement of soil water content and
electri-cal conductivity by time domain reflectometry: a review. Computers Electronics Agric., 31(3), 213-237.
Or D. and Wraith J.M., 1999.Temperature effect on soil bulk
dielectric permittivity measured by time domain reflecto-metry: A physical model. Water Res. Res., 35( 2), 371-383.
Ruth B. and Munch J.C., 2005.Field measurements of the water
content in the top soil using a new capacitance sensor with a flat sensitive volume. J. Plant Nutr. Soil Sci.,168, 169-175.
Seyfried M.S. and Murdock M.D., 2001.Response of a new soil
water sensors to variable soil, water content, and tempe-rature. Soil Sci. Soc. Am. J., 65, 28-34.
Seyfried M.S. and Murdock M.D., 2004.Measurement of soil
water content with a 50 MHz soil dielectric sensor. Soil Sci. Soc. Am. J., 68, 394-403.
Skierucha W., 2009. Temperature dependence of time domain
reflectometry-measured soil dielectric permitivity. J. Plant Nutr. Soil Sci., 172, 186-193.
Topp G.C., Davis J.L., and Annan A.P., 1980.Electromagnetic
determination of soil water content: measurements in co-axial transmission lines. Water Resour. Res., 16, 574-582.
Verhoef A., Fernández-Gálvez J., Diaz-Espejo A., Main B.E.,
and El-Bishti M., 2006.The diurnal course of soil moisture
as measured by various dielectrid sensors: Effect of soil temperature and the implication for evapotranspiration estimates. J. Hydrol., 321, 147-162.
Wraith J.A., Robinson D.A., Jones S.B., and Long D.S., 2005.
Spatially characterizing apparent electrical conductivity and water content of surface soils with time domain reflecto-metry. Computers Electronics Agric., 46(1-3), 239-261.
Wraith J.M. and Or D., 1999.Temperature effects on soil bulk