IJPAR |Vol.7 | Issue 2 | Apr - Jun -2018
Journal Home page: www.ijpar.com
Research article Open Access
A quantitative RP-HPLC method development and validation for
sofosbuvir in bulk and tablet dosage form
Darshan Bhatt
1, Padmini Thatavarthi
2, B. Rajkamal
31
Research Scholar, Mewar University, Chittorgarh-312901, Rajasthan, India.
2Megha Institute of Engineering and Technology for Women, Ghatkesar, Hyderabad-501301, India
3Research Supervisor, Mewar University, Chittorgarh-312901, Rajasthan, India.
Corresponding author: Darshan Bhatt
Email: [email protected]
ABSTRACT
A new isocratic simple and rapid reverse phase high performance liquid chromatographic method was developed and successively validated for the estimation of Sofosbuvir. In this newly developed method, chromatographic separation of Sofosbuvir was achieved on a Phenomenex C18- column(250 × 4.6) mm within a short runtime of 6 min using mobile phase containing 0.1% Formic acid in water (pH at 2.3) and Acetonitrile in the ratio of 50:50% v/v. Sofosbuvir was estimated with UV detection at 262 nm and it was found to be eluted at 2.983 min. The above mentioned method was validated as per International Conference on Harmonization (ICH) guidelines with respect to accuracy, precision, linearity, limit of detection (LOD) and limit of quantitation (LOQ) and robustness. The method was found specific for Sofosbuvir and linear (r2 =0.9994) over concentrations ranging from 20 to 100 μg/mL. The method was found statically accurate (mean recovery = 99.46%), precise with both intra-day and inter-day relative standard deviation (RSD) values < 1.0% and robust. The obtained results concluded that the proposed RP-HPLC method is convenient, reliable and useful in routine analysis for estimation of Sofosbuvir in its bulk form and dosage form.
Keywords
:Sofosbuvir, RP-HPLC, Anti-HIV drugs, Development &Validation, ICH guidelines.INTRODUCTION
Chromatography is defined as separation of mixture of compounds into individual components by using stationary and mobile phases. RP-HPLC technique is fast growing analytical technique for the estimation of chemicals and formulations. Sofosbuvir is a medication used for the treatment of hepatitis-C.
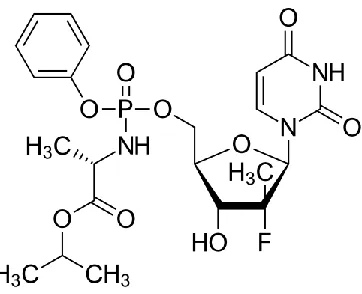
similar nucleotide analogue, 2'-deoxy-2'-α-fluoro-β-C-methylcytidine, is proposed to act as a chain terminator because the 2' methyl group of the nucleotide analogue causes a steric clash with an incoming NTP [2]. It would act in a similar way. Chemically it is designated as Isopropyl (2S) - 2-[[[(2R,3R,4R,5R)-5-(2,dioxopyrimidin-1-yl) - 4-fluoro– 3 – hydroxyl -4 -
methyl-tetrahydrofuran-2-yl]methoxy-phenoxy-phosphoryl]amino]propanoate [3 – 4].
Literature survey reveals RP-HPLC [5] and UPLC-MS/MS[6] plasma studies which are almost related to bioequivalence studies and few of are available on combination of drugs analysis or simultaneous estimations by HPLC.
Fig 1: Structure of Sofosbuvir
The proposed method was optimized and validated in accordancewith International Conference on Harmonization (ICH) guidelines[7]. The aim of present work is to develop a simple,
rapid, precise, accurate and selective reversed phase chromatographic method and to estimate the Sofosbuvir in bulk and its solid dosage forms.
MATERIALS AND METHODS
Materials and reagents
Sofosbuvir Standard drug sample was obtained as gift sample from by Aurobindo Pharma Ltd, Hyderabad. Sovaldi (Sofosbuvir 400 mg) Tablet dosage form procured from the local market. Other reagents used like HPLC grade Acetonitrile, formic acid were purchased from SD Fine Chemicals, Mumbai, India
Instrument
Quantitative HPLC was performed on Agilent 1200 series with Auto Sampler equipped with variable wavelength detector (UV detector). The chromatograms were recorded using EZChrom software.
Stationary
PHASEReverse phase Phenomenex C18- column (250 × 4.6) mm dimension was used as stationary phase.
Selection of wavelength detection
The multiple spectra scan of 50μg/mL of the Sofosbuvir were recorded on UV- visible spectrophotometer in the UV range of 200-800nm. From the UV spectrum, wavelength of 262 nm showing maximum absorbance and it was selected for detection of HPLC method.
Preparation of standard solution
20 mg of Sofosbuvir pure sample was weighed accurately and transferred into 100 mL clean and dry volumetric flask, and then added 50 mL of mobile phase. The solution was sonicated for 20 min and made up to the final volume with diluent. From the above stock solution, 2.5 mL was pipetted out in to a 10 ml clean dry Volumetric flask and then made up to the final volume with mobile phase.
Preparation of sample solution
into a 100 mL volumetric flask, 50 mL of mobile phase was added, sonicated for 45 min, and made up to the final volume with mobile phase and filtered. From the filtered solution 2.5 ml was pipetted out into a 10 ml clean dry volumetric flask and made up the volume up to 10 mL with mobile phase. Similar preparations were followed to achieve desired concentrations to perform for the validation of Sofosbuvir.
Analytical method validation
The objective of validation of an analytical method is to demonstrate that it is suitable for its intended purpose as stated in ICH guidelines Q2 (R1) on validation of analytical procedures. Parameters to be considered during validation of the developed method as per ICH guidelines are:
Specificity
Specificity is defined as ability to measure the analyte in the presence of other components which may present along with the analyte. To estimate specificity of the method Blank, placebo, standard and sample chromatograms were obtained for Sofosbuvir.
Linearity
The linearity of the method expresses the relation between the rest results and the concentration of the analyte. According to the linearity rule the test results should be directly proportional to the concentration of the analyte. A linear relationship was evaluated across the range of 20 - 100 μg/mL for Sofosbuvir. It was obtained by plotting peak area against concentration of standard and finding regression coefficient (r2).
Accuracy
The accuracy of the method expresses the closeness between the obtained value and an accepted reference value or the conventional true value. Accuracy was evaluated using 3 replicates of 3 different concentrations within the range. In the present work recovery studies were calculated by selecting triplicates of three concentration levels viz. 80%, 100%, 120% by the addition of known amount of Sofosbuvir standard.
Precision
The precision of the method expresses the closeness between a series of determinations
obtained from multiple sampling of the same sample under the same analytical conditions. Precision may be performed in three different levels: repeatability, reproducibility and intermediate precision. Precision is stated by mean, standard deviation and percentage relative standard deviation.
Limit
of
detection
(lod)
&
limit
of
quantification (loq)
The detection limit defined as the lowest amount of analyte which can be identified but cannot be quantified exactly. The quantitation limit defined as the lowest amount of analyte which can be quantified with suitable accuracy and precision. LOD and LOQ can be estimated by following formulas:
LOD=3.3×σ/S LOQ=10×σ/S
σ = Standard deviation estimated based on the calibration curve.
S = Slope of the calibration curve.
Robustness
The robustness of method expresses the resistance of chromatographic conditions by small change in the analytical conditions. To estimate robustness of analytical method chromatographic conditions like temperature, pH of mobile phase, flow rate and mobile phase composition were varied.
RESULTS AND DISCUSSION
To optimize the RP-HPLC method, mobile phases of different compositions were tried. A satisfactory separation and good peak symmetry for Sofosbuvir were obtained with a mobile phase 0.1% Formic acid in water (pH at 2.3) and Acetonitrile in the ratio of 50:50% v/v and at a flow rate of 1 mL/min. The retention time obtained for Sofosbuvir at 3.1 min at 262 nm wavelength. System suitability parameters was calculated and compared as per ICH guideslines
Linearity
obtain the calibration curve. Linear relationship was observed across the range of 20-120 μg/mL. Linearity range and linear regression data of
calibration plot for Sofosbuvir is given in table no.1 and calibration curve is represented in Figure 2.
Table-1: Linearity of Sofosbuvir
Parameters Results Obtained
Linearity range (ppm) 20-100
Correlation coefficient (r2) 0.9994
Slope 26178
Intercept 8885.6
Figure-2: Linearity Graph for Sofosbuvir
SPECIFICITY
Specificity was tested by evaluating chromatogram of blank run and standard Sofosbuvir. The HPLC chromatograms recorded for
the blank showed almost no peaks, interfering peak or baseline noise within a retention time of 2.983 min. Chromatogram of blank run and of 50 ppm of Sofosbuvir in mobile phase is given Figure 3 and 4.
Fig-4: Chromatogram of Sofosbuvir
PRECISION
Intra-day precision
It was performed at three different concentration levels low (20μg/mL), mid (30μg/mL) and high (40μg/mL) within the same day at three different times (session 1, 2, 3).
Inter-day precision
It was carried out at same concentration levels on three consecutive days, using same homogeneous sample. The % RSD values for both intra-day and inter-day precision were found within acceptable limit. Results are presented in Tables 2 and 3 respectively.
Table-2: Intra-day precision results
Level Low Mid High
Concentration (ppm) 20 30 40
Peak area
session 1 523565 785347 1147136
session 2 530021 791431 1149627
session 3 525645 779217 1146239
Average peak area 526410 785331 1163759
Standard Deviation 2690 4986 28757
%RSD 0.5 0.63 0.12
Table-3: Inter-day precision results
Level Low Mid High
Concentation (ppm) 20 30 40
Peak area session 1 523465 785447 1146936
session 2 530121 792431 1149597
session 3 525545 779317 1146239
Standard Deviation 2780 5357 1446
%RSD 0.51 0.68 0.12
LOD AND LOQ
Values of LOD and LOQ were calculated using slope of calibration curve. LOD and LOQ values of
Sofosbuvir for HPLC method are tabulated in Table 4. Determined based on the standard deviation of the response and slope of the calibration curve.
Table 4: Results of LOD and LOQ
Parameters Result
LOD 0.03 ppm
LOQ 0.063 ppm
ACCURACY
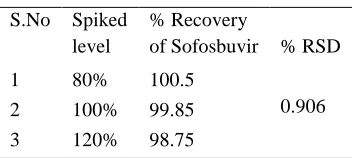
The accuracy of the method was determined on three concentration levels by recovery experiments. Accuracy of the method is reported as present recovery of known added amount of analyte in the placebo. The accuracy of the method was
established by performing recovery studies in triplicates of three concentration levels viz. 80%, 100%, 120% by adding known amount of Sofosbuvir. Results obtained were found to be within acceptable limits as shown in Table 5.
Table 5: Accuracy of Sofosbuvir
S.No Spiked level
% Recovery
of Sofosbuvir % RSD
1 80% 100.5
0.906 2 100% 99.85
3 120% 98.75
ROBUSTNESS
Robustness of method was studied by making slight but deliberate changes in chromatographic conditions such as proportion of organic phase in mobile phase composition and flow rate. Effects of
these changes on both the retention time (RT) and peak area were evaluated by calculating the relative standard deviations (%RSD). The results obtained are tabulated in Table 6.
Table 6: Robustness of Sofosbuvir
Parameter Variation % RSD
Robustness i. Change in flow rate (+ 0.1 mL/min) ii. Change in mobile phase (+ 1mL)
0.92 0.45
CONCLUSION
A simple and precise stability indicating RP-HPLC method has been developed for determination of Sofosbuvir in tablet dosage form. The %RSD values in precision, recovery studies and robustness studies were found less than 2.0%, which indicates that the method is precise, accurate
REFERENCES
[1]. Fung, A, Jin. Z, Dyatkina. N, Wang. G, Beigelman. L, Deval, J. Efficiency of incorporation and chain termination derermines the inhibition potency of 2' – modified nucleotide analogs against hepatitis Cvirus polymerase. Antimicrobial Agents and Chemotherapy. 58 (7), 3636–45.
[2]. Ma. H, Jiang. W.R, Robledo. N, Leveque. V, Ali. S, Lara-Jaime. T, et al. Characterization of the Metabolic Activation of Hepatitis C Virus Nucleoside Inhibitor β –d -2' –Deoxy-2'-fluoro-2'-C-methylcytidine and identification of a Novel Active 5'-Triphosphate species. The Journal of Biological Chemistry. 282 (41), 29812 – 29820.
[3]. P. Mohan Vikas, T. Satyanarayana, D. Vinod Kumar, E. Mounika, M. Sri Latha, R. Anusha et al. Development and Validation of New RP-HPLC Method for the Determination of Sofosbuvir in Pure Form. World Journal of Pharmacy and Pharmaceutical Sciences. 2016, 775-781.
[4]. P.SWATHI, K.RAJESWAR DUTT, K.N.VRAO, M.ALAGAR RAJA. RP-HPLC method development and validation for estimation of sofosbuvir in pure and tablet dosage form. Innovat International Journal of Medical & Pharmaceutical Sciences. 2(4), 2017, 7-9.
[5]. Bakht, Zaman, Faisal, Siddique, Waseem, Hassan. A New RP-HPLC Method for the Simultaneous Assay of Sofosbuvir and Ledipasvir in Combined Dosage Form. International Journal of ChemTech Research. 79(1), 2016, 1605-1613.
[6]. Rezk, M. R., E. B. Basalious and M. E. Amin. Novel and sensitive UPLC-MS/MS method for quantification of sofosbuvir in human plasma: application to a bioequivalence study. Biomedical Chromatography. 30, 2016, 1354-1362.