Correlation Between Tissue Densities in
Com-puted Tomography and Three Different
Cone-Beam Computed Tomography Units (In Vitro)
S Mehralizadeh *
1,A Talaipour
2, P Olyaee
3, M Amiri Siavoshani
11- Assistant professor,Oral and maxilofacial Radiology Dept ,Faculty of Dentistry,Tehran medical sciences,Islam-ic Azad University, Tehran, Iran
2- Professor,Oral and maxilofacial Radiology Dept ,Tehran Medical Sciences, Islamic Azad University, Tehran, Iran, Islamic Azad University, Tehran, Iran
3- Dentist, Frankfurt, Germany
ABSTRACT ARTICLE INFO
Article History
Received: Nov 2019 Accepted: Dec 2019 ePublished: Feb 2020
Corresponding author: S Mehralizadeh, Assis-tant professor,Oral and maxilofacial Radiology Dept , faculty of Den-tistry,Tehran medical sciences,Islamic Azad University, Tehran, Iran. Email: sandramehr@ yahoo.com
Background and Aim: Bone density is of great assistance in the selection of the proper implant site. The present study aimed to assess the correlation between tissue densities in computed tomography (CT) and three different cone-beam computed to-mography (CBCT) units.
Materials and Methods: In this descriptive study, a radiographic phantom consist-ing of a transparent polymethyl methacrylate (PMMA) cylinder with a 50-mm height and a 50-mm diameter was used, which comprised eight materials, including air, fat, water, PMMA, muscle, cortical bone, cancellous bone, and aluminum. Each material was of 5 mm height and 5 mm in diameter. A 20-mm-thick hollow plexiglass cylin-der was used to simulate the soft tissue. The phantom was scanned four times using 16-Slice Lightspeed CT, NewTom VGi, CRANEX 3D, and Rotograph Evo 3D CBCT units. The data were primarily reconstructed and transferred to the OnDemand 3D software in the Digital Imaging and Communications in Medicine (DICOM) format. All the assessments were made in the sagittal plane, and the average density of each of the mentioned eight materials was calculated with the proper grayscale value calcula-tion of each system, which utilizes a simulacalcula-tion inherent density calculacalcula-tion for any region of interest (ROI).
Result: The results showed that tissue densities are different in CT and CBCT units. The values estimated by the CRANEX 3D unit approximated that of CT, followed by NewTom VGi and Rotograph Evo 3D CBCT units. Kruskal-Wallis test showed that
the differences in the scores are statistically significant (P<0.01),
Conclusion:Considering the results, CBCT cannot accurately calculate tissue density.
Keywords: Bone Density, Cone-Beam Computed Tomography, In Vitro Tech-niques, Multidetector Computed Tomography, Radiographic Image Interpretation, Computer-Assisted, Software
J Res Dentomaxillofac Sci 2020, 5(1):13-20.
Introduction:
Assessment of the mechanical properties of the implant recipient bone is one of the concerns
among dentists, which can significantly affect the
osseointegration process and the primary stabil-ity of the implant.(1-3)and by 80% in developing
countries by 2025.(2) One of the most important
assessment indices is bone density, which is of great assistance in the selection of the
proper-implant site.(4) Armstrong, in 2006, stated that
the Hounsfield Unit (HU) and the grayscale
of a single point are not equal.(5) Katsumata et
al declared that grayscale values obtained by the use of cone-beam computed tomography (CBCT) are reliable.(6) Mah et al stated that the
differences between grayscale and HU are
http://www.jrdms.dentaliau.ac.ir
J Res Dentomaxillofac Sci 2020, 5(1)
F Hajifattahi et al
14
A 20-mm-thick hollow plexiglass cylinder was used to simulate the soft tissue, and the samples were placed at the center of this cylinder (Figure 2). (21)
Figure 2. A 20-mm-thick hollow plexiglass cyl-inder was used to simulate the soft tissue
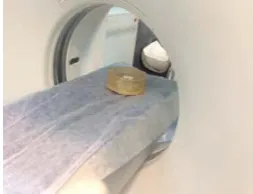
The CT unit in the present study was 16-slice Lightspeed CT (GE Medical Systems, USA). The CBCT units were NewTom VGi (Verona, Italy; CBCT1), CRANEX 3D (Soredex, Helsinki, Fin-land; CBCT2), and Rotograph Evo 3D (Villa, Italy; CBCT3). The phantom was placed at the center of the FOV, and scout images were ob-tained to ensure proper adjustment (Figure 3).(7)
Figure 3. The phantom was placed at the center of the field of view (FOV), and scout images were ob-tained to ensure proper adjustment
During recent years, computed tomography (CT) has been implemented in the assessment of bone quality.(4,6,7) However, CT scan has some
dis-advantages including limited availability and a high effective dose.(4-8) On the other hand, CBCT
has many advantages such as a lower radiation dose, availability, shorter image acquisition time, and sub-millimeter resolution compared to CT. (9-12) However, recent studies have proven
that CBCT’s effective dose is variable and can be affected by factors such as device type, the
field of view (FOV), the number of base projec -tions, and scan mode.(13) Nevertheless, CBCT is
the modality of choice for bone assessment be-fore implant placement with approved accuracy of linear measurements and accurate assessment of adjacent anatomy.(14) But disadvantages such
as beam hardening artifact, high radiation scat-ter, and inability to render actual HU values are among the limitations of CBCT.(9,10,15,16) CBCT
has the potential to assess bone density, and overall, grayscale can be used for bone density assessment.(17-19) However, the bone density
ob-tained by the grayscale in CBCT has not yet been calibrated to conform to HU in CT; their
corre-lation is indefinite.(20) The present in-vitro study
aimed to assess the correlation between tissue densities in CT and three different CBCT units at the Oral and Maxillofacial Radiology Depart-ment of the Dental Faculty of Islamic Azad Uni-versity of Medical Sciences, Tehran, Iran, during 2014-2015.
Materials and Methods
In this experimental study, a radiographic phan-tom comprised of eight materials, including air, fat, water, polymethyl methacrylate (PMMA), muscle, cortical bone, cancellous bone, and alu-minum, was used.(7,11) This phantom consisted
of a transparent PMMA cylinder with a 50-mm height and a 50-mm diameter.(7) The materials
were located at the center of the phantom’s ver-tical dimension in the following order: air, fat, water, PMMA, muscle, cancellous bone, cortical bone, and aluminum. Each material had a 5-mm height and a 5-mm diameter. An empty cavity with a 5-mm height and a 20-mm diameter was
Correlation Between Tissue Densities in Computed Tomography
http://www.jrdms.dentaliau.ac.ir Journal of Research in dental and maxillofacial sciences 15
The obtained data were primarily reconstruct-ed by the software providreconstruct-ed by the manufacturing company of each scanner and were transferred in the Digital Imaging and Communications in Medicine (DICOM) format to third-party soft-ware for analysis.(7) Softwares for primary
recon-struction included: ADM software for 16-slice Lightspeed CT, NNT software for CBCT1, On-Demand Software for CBCT2, and Dental Studio Plus software for CBCT3.
The DICOM data analysis was performed by the OnDemand software (CyberMed Inter-national, Seoul, Korea) in the three-dimensional (3D) mode.(7) All the assessments were made in
the sagittal plane, and the average density of each of the mentioned eight materials was calculated. The grayscale value calculation of each system was performed with the utilization of a simula-tion of inherent density calculasimula-tion for any region of interest (ROI). The images of each scan were captured by the image capture function of the OnDemand 3D software and were saved using the Microsoft Word Document software
(Figure 4).(7)
Figure 4. The images of each scan were tured by the image capture function of the OnDemand 3D software (CyberMed Inter-(national, Seoul, Korea
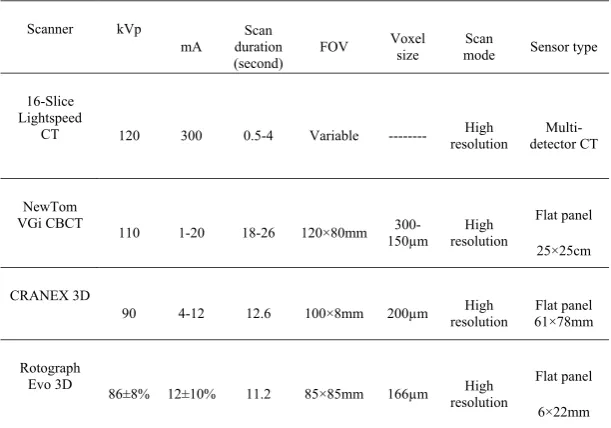
The specifications of the scanner units
employed in the present study are .rized in Table 1
To assess the correlation between HU and grayscale in the studied materials, the air was excluded from the study, and the sev-.en remaining materials were compared
Table 1: The specifications of the scanner units employed in the present study
1 Scanner kVp
mA duration Scan (second) FOV
Voxel
size modeScan Sensor type
16-Slice Lightspeed
CT 120 300 0.5-4 Variable --- Highresolution detector CT
Multi-NewTom
VGi CBCT 110 1-20 18-26 120×80mm
300-150µm resolution High
Flat panel
25×25cm
CRANEX 3D
90 4-12 12.6 100×8mm 200µm Highresolution 61×78mmFlat panel
Rotograph
Evo 3D 86±8% 12±10% 11.2 85×85mm 166µm High resolution
Flat panel
6×22mm
http://www.jrdms.dentaliau.ac.ir
J Res Dentomaxillofac Sci 2020, 5(1)
F Hajifattahi et al
16
Results:
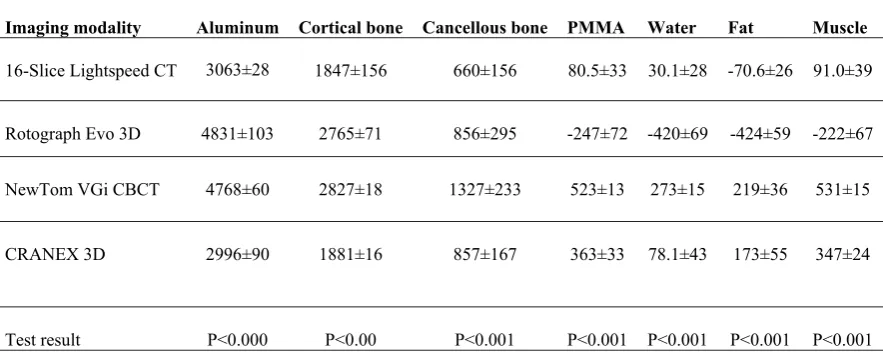
The present study involved four scanner units, including one CT scan unit and three CBCT units (CBCT1, CBCT2, and CBCT3). Seven tissue samples were assessed. Therefore, the total number of 28 samples were evaluated. Tissue densities are presented in Table 2.
Table 2: Densities of the assessed tissues according to the imaging modality
1
Muscle Fat
Water PMMA
Cancellous bone Cortical bone
Aluminum Imaging modality
91.0±39 -70.6±26
30.1±28 80.5±33
660±156 1847±156
3063±28 16-Slice Lightspeed CT
-222±67 -424±59
-420±69 -247±72
856±295 2765±71
4831±103 Rotograph Evo 3D
531±15 219±36
273±15 523±13
1327±233 2827±18
4768±60 NewTom VGi CBCT
347±24 173±55
78.1±43 363±33
857±167 1881±16
2996±90 CRANEX 3D
P<0.001 P<0.001
P<0.001 P<0.001
P<0.001 P<0.00
P<0.000 Test result
CT=computed tomography, CBCT=cone-beam com-puted tomography, PMMA=polymethyl methacrylate
1. Aluminum
The lowest density for aluminum was reported by CBCT2 (2996) followed by CT (3063) while the highest density was reported by CBCT3 (4831). Analysis of variance (ANOVA) showed that the
differences among the four units were significant (P<0.001). Duncan's post hoc test showed no
difference between CT and CBCT2 or between
CBCT1 and CBCT3 (P<0.21) while CT and CBCT2 were significantly different from CBCT1 and CBCT3 (P<0.01).
2. Cortical bone
The lowest density for this tissue was reported by CBCT2 (1881), and the highest density was
re-ported by CBCT1 (2827; P<0.0001). Supplemen
-tary comparisons showed that CT was signifi
-cantly different from the CBCT units (P<0.0001). CBCT1 and CBCT3 were not significantly dif
-ferent (P<0.2) while there were some differences among the three CBCT units (P<0.001).
3. Cancellous bone
The lowest density was reported by CT (660) while the densities reported by CBCT2 and
CBCT3 were almost equal (856). The high-est density was reported by CBCT1 (1327)
(P<0.001). Multiple comparisons showed that CT, CBCT2, and CBCT3 were not significantly different (P<0.6).
4. PMMA
The lowest density was reported by CBCT3 (-247), and the highest density was reported by CBCT1 (523). Multiple comparisons showed a
significant difference between the imaging units (P<0.001).
5. Water
Water density was -420 in CBCT3, 30 in CT, and 78 in CBCT1. The highest value was obtained by CBCT2 (273); the differences were statistically
significant (P<0.01). There was a significant dif -ference between CT and each of the CBCT units
(P<0.001).
6. Fat
Fat density was -424 in CBCT3, -70 in CT, and 273 in CBCT2. The highest value was reported by CBCT1 (219); the difference was
http://www.jrdms.dentaliau.ac.ir Journal of Research in dental and maxillofacial sciences 17
Discussion:
Assessment of bone quality and quantity is a fundamental step before implant placement sur-geries. This assessment should be of adequate accuracy and validity. Although CBCT has been
widely implemented in different dentistry fields,
a reliable method for the assessment of bone quality by CBCT has not yet been recognized.
(20) Nowadays, CT is the gold standard for bone
density estimations.(4,6,7) Therefore, many studies
have assessed the correlation between tissue den-sities in CT and CBCT, and different results have been achieved. (17,18,20-35)
CBCT3 rendered negative values while the
val-ues rendered by CBCT1 and 2 were not signifi
-cantly different (P<0.4).
7. Muscle
CBCT3 showed the value of -222, CT report-ed the value of 91, and CBCT1 showreport-ed the value of 347 while the highest density was reported by CBCT2 (531). The differences were statistically
significant (P<0.0001). Pair comparisons by the post hoc test showed that these units were signifi
-cantly different (P<0.0001).
Table 3 shows that the highest score (the clos-est value to CT) was related to CBCT2 (score 3) followed by CBCT1 (score 1.7) while the lowest score belonged to CBCT3 (1.28). Kruskal-Wallis test showed that these differences in the scores
are statistically significant (P<0.01), and
Mann-U-Whitney test, through pair comparisons of the
CBCT units, showed a significant difference be
-tween CBCT2 with CBCT1 and 3 (P<0.05), but
there was no difference between CBCT1 and
CBCT3 (P<0.2).
Table 3-Score and quality ranking of each cone-beam computed tomography (CBCT)
unit in comparison with computed tomogra-phy (CT)
1
CBCT Score QualityExcellent Good Moderate
Rotograph Evo 3D(n=7) 1.28±0.24 0 2 5
NewTom VGi CBCT (n=7) 1.71±0.49 0 5 2
CRANEX 3D(n=7) 3±0 7 0 0
Test result P<0.01 P<0.05
The present study showed that tissue densities are different in CT and CBCT units. CRANEX 3D showed the closest values to CT followed by NewTom VGi and Rotograph Evo 3D CBCT units.
A phantom comprised of seven materials with different densities was used in the present study. Mah et al used a standard phantom constructed under laboratory conditions in which each tissue was completely homogeneous.(7) They declared
an extremely strong correlation between CT HU and CBCT grayscale and rendered an equation for calculating HU based on CBCT grayscale. (7)
Lagravere et al (14) identified the differences with
the clinical conditions to be among the limita-tions of the study by Mah et al.(7) Therefore, in
the present study, natural tissues of a sheep’s head were used.
Parsa et al declared a strong correlation be-tween CBCT grayscale and CT HU; however, they emphasized that these two are not equal; they attributed the differences to the increased noise, scatter, and artifact in CBCT. (4)
Emadi et al stated that CBCT grayscale and CT HU are dissimilar and showed that the den-sities obtained by two different CBCT units are also dissimilar.(21) However, the results of the
present study showed a strong correlation be-tween aluminum and cortical bone densities ob-tained by NewTom VGi and Rotograph Evo 3D CBCT units.
The thickness of the tissues is an important
factor that can influence tissue density estima -tions. Therefore, in the present study, all the samples were of equal thickness. Although Kat-sumata et al stated that in thicker tissues, den-sity estimation by CBCT is more accurate, they concluded that exposure parameters can have a greater effect on density assessment.(6) They
attributed the differences in tissue densities ob-tained by different units to the differences in the exposure parameters.(6) Parsa et al also stated
that changes in the exposure parameters could affect tissue density.(32) In the present study, we
tried to use comparable milliampere (mA) and kilovoltage peak (kVp) as permitted by the de-vices although some differences were inevita-ble. Haristoy et al hypothesized that the tissue
http://www.jrdms.dentaliau.ac.ir
J Res Dentomaxillofac Sci 2020, 5(1)
F Hajifattahi et al
18
CBCT compared to the projection intensity.(30)
In the present study, the phantom was placed at the center of the FOV. Lagravere et al found
no significant differences between CT HU and
CBCT grayscale in different areas of the FOV
(31) while Oliveira et al found different results and
stated that tissue density is influenced by the lo -cation of the tissue in the dental arch.(33)
The three CBCT units in this study operated in the high-resolution mode. Consequently, the signal-to-noise ratio (SNR) was increased, ren-dering high-quality images with a high spatial
resolution, which can significantly affect tissue
density measurements.(32) De Vos et al showed
that CBCT units lack similar adjustments and uniformity; these differences in manufactur-ing can affect the results of tissue density esti-mations with non-uniformity among different units.(35) Therefore, we tried to select similar
FOVs as possible but some differences were in-evitable. Parsa et al showed that the size of the
FOV could influence CBCT grayscale.(32)
We used a single software (the OnDemand 3D) for the observation and assessment of the scans of the three CBCT units to prevent the er-rors that could happen upon using multiple soft-ware. Mah et al implemented 11 CBCT units and a single software, similar to ours, to match the ROI in the samples.(7)
The results of the present study indicate that the densities obtained by the CBCT units show higher numbers than CT HU in similar tissues. The NewTom VGi CBCT unit showed higher densities for all the samples in comparison with the CT unit. Also, all the samples were shown to have higher densities in the CRANEX 3D CBCT unit compared to CT although the densities of aluminum and cortical bone showed close num-bers to CT HU. In the Rotograph Evo 3D unit, the numbers were higher in comparison with CT HU, except for water, fat, and PMMA, which showed negative values. Scarfe et al found similar re-sults. (29) Although Lagravere et al found a linear
correlation between HU and CBCT grayscale, they also found higher CBCT grayscale numbers compared to HU. (14) Generally, kVp and mA in CBCT are lower than that in CT, and consequent-ly, CBCT has a higher SNR, which causes higher tissue density numbers compared to CT HU. (32) Haristoy and colleagues assessed the effect of
different exposure parameters on grayscale and found a strong correlation between HU and CBCT grayscale.(30) Due to the different results
obtained from different CBCT units, they recom-mended the use of a calibrated phantom before imaging to ensure the accuracy of density estima-tions.(30)
It seems that although some studies have found a strong correlation between HU and CBCT grayscale, (4,7) there is controversy among the
re-sults due to the differences in the study methods, statistical analyses, and scanner units. As stated recently by Pauwels et al, although many efforts have been made to determine accurate CBCT grayscale numbers, it is rational to consider these data unreliable.(36) The limitations of CBCT units
compared to medical CT units, which can be re-lated to the characteristics of CBCT units, such as SNR, scatter radiation, and different artifacts, are most probably the main reason for this disagree-ment.
Conclusion:
Considering the results, CBCT cannot accurately calculate tissue density. It is recommended to as-sess the effect of factors such as tissue thickness, FOV size, location of the tissue in the FOV, and exposure parameters on tissue density calcula-tions.
References:
1. Song YD, Jun SH, Kwon JJ. Correlation be-tween bone quality evaluated by cone-beam computerized tomography and implant primary stability. Int J Oral Maxillofac Implants. 2009 Jan-Feb;24(1):59-64. 2. Isoda K, Ayukawa Y, Tsukiyama Y, Sogo M, Matsushita Y, Koyano K. Relationship between the bone density estimated by cone-beam com-puted tomography and the primary stability of dental implants. Clin Oral Implants Res. 2012 Jul;23(7):832-6.
3. Cassetta M, Stefanelli LV, Pacifici A, Pacifici
L, Barbato E. How accurate is CBCT in meas-uring bone density? A comparative CBCT-CT in vitro study. Clin Implant Dent Relat Res. 2014 Aug;16(4):471-8.
tomogra-http://www.jrdms.dentaliau.ac.ir Journal of Research in dental and maxillofacial sciences 19
phy for preoperative implant planning assess-ment. Int J Oral Maxillofac Implants. 2012 Nov-Dec;27(6):1438-42.
5. Armstrong RT. Acceptability of cone beam CT vs. multi-detector CT for 3D anatomic mod-el construction. J Oral Maxillofac Surg. 2006 Sep;64(9):37.
6. Katsumata A, Hirukawa A, Okumura S, Nai-toh M, Fujishita M, Ariji E, et al. Relationship between density variability and imaging volume size in cone-beam computerized tomographic scanning of the maxillofacial region: an in vitro study. Oral Surg Oral Med Oral Pathol Oral Ra-diol Oral Endod. 2009 Mar;107(3):420-5.
7. Mah P, Reeves TE, McDavid WD. Deriving
Hounsfield units using grey levels in cone beam
computed tomography. Dentomaxillofac Radiol. 2010 Sep;39(6):323-35.
8. Cassetta M, Giansanti M, Di Mambro A, Ca-lasso S, Barbato E. Accuracy of two stereolitho-graphic surgical templates: a retrospective study. Clin Implant Dent Relat Res. 2013 Jun;15(3):448-59.
9. Cassetta M, Stefanelli LV, Giansanti M, Di Mambro A, Calasso S. Depth deviation and oc-currence of early surgical complications or un-expected events using a single stereolithographic surgi-guide. Int J Oral Maxillofac Surg. 2011 Dec;40(12):1377-87.
10. Scarfe WC, Farman AG. What is cone-beam CT and how does it work? Dent Clin North Am. 2008 Oct;52(4):707-30.
11. Razi T, Niknami M, Alavi Ghazani F.
Rela-tionship between Hounsfield Unit in CT scan and
gray scale in CBCT. J Dent Res Dent Clin Dent Prospect. 2014 Spring;8(2):107-10.
12. Liu Y, Bäuerle T, Pan L, Dimitrakopoulou-Strauss A, Dimitrakopoulou-Strauss LG, Heiss C, et al. Calibration of cone beam CT using relative attenuation ra-tio for quantitative assessment of bone density: a small animal study. Int J Comput Assist Radiol Surg. 2013 Sep;8(5):733-9.
13. Carrafiello G, Dizonno M, Colli V, Strocchi
S, Taubert SP, Leonardi A, et al. Comparative study of jaws with multislice computed tomog-raphy and cone-beam computed tomogtomog-raphy. Ra-diol Med. 2010 Jun;115(4):600-11.
14. Lagravere MO, Carey J, Toogood RW, Ma-jor PW. Three-dimensional accuracy of measure-ments made with software on cone-beam
comput-ed tomography images. Am J Orthod Dentofacial Orthop. 2008 Jul;134(1):112-6.
15. Pauwels R, Beinsberger J, Collaert B, Theodorakou C, Rogers J, Walker A, et al. Ef-fective dose range for dental cone beam com-puted tomography scanners. Eur J Radiol. 2012 Feb;81(2):267-71.
16. Hua Y, Nackaerts O, Duyck J, Maes F, Jacobs R. Bone quality assessment based on cone beam computed tomography imaging. Clin Oral Im-plant Res. 2009 Aug;20(8):767-71.
17. Schulze R, Heil U, Gross D, Bruellmann DD, Dranischnikow E, Schwanecka U, et al. Artefacts in CBCT: a review. Dentomaxillofac Radiol. 2011 Jul:40(5);265-73.
18. Kim DG. Can dental cone beam computed tomography assess bone mineral density? J Bone Metab. 2014 May;21(2):117-26.
19. Naitoh M, Hirukawa A, Katsumata A, Ariji E. Prospective study to estimate mandibular cancel-lous bone density using large-volume cone-beam computed tomography. Clin Oral Implant Res. 2010 Dec;21(12):1309-13.
20. Gonzalez-Garica R, Monje F. The reliability of cone-beam computed tomography to assess bone density at dental implant recipient sites: a histomorphometric analysis by micro-CT. Clin Oral Implant Res. 2013 Aug;24(8):871-9.
21. Emadi N, Safi Y, Akbarzadeh Bagheban A,
Asgary S. Comparison of CT-number and gray scale value of different dental materials and hard tissues in CT and CBCT. Iran Endod J. 2014 Fall;9(4):283-6.
22. Merrett SJ, Drage NA, Durning P. Cone beam computed tomography: a useful tool in orthodon-tic diagnosis and treatment planning. J Orthod. 2009 Sep;36(3):202-10.
23. Hofmann E, Medelnik J, Fink M, Lell M, Hischfelder U. Three-dimensional volume tomo-graphic study of the imaging accuracy of impact-ed teeth: MSCT and CBCT comparison--an in vitro study. Eur J Orthod. 2013 Jun;35(3):286-94. 24. Litsas G, Acar A. A review of early displaced maxillary canines: etiology, diagnosis and in-terceptive treatment. Open Dent J. 2011 Mar 16;5:39-47.
re-http://www.jrdms.dentaliau.ac.ir
J Res Dentomaxillofac Sci 2020, 5(1)
F Hajifattahi et al
20
lationship of radiographic gray density and im-plant stability. Clin Imim-plant Dent Relat Res. 2013 Dec;15(6):893-906.
26. Naitoh M, Hirukawa A, Katsumata A, Ariji E. Evaluation of voxel values in mandibular cancel-lous bone: relationship between cone-beam puted tomography and multislice helical com-puted tomography. Clin Oral Implants Res. 2009 May;20(5):503-6.
27. Schropp L, Alyass NS, Wenzel A, Stavro-poulos A. Validity of wax and acrylic as soft-tissue simulation materials used in in vitro radio-graphic studies. Dentomaxillofac Radiol. 2012 Dec;41(8):686-90.
28. Aranyarachkul P, Caruso J, Gantes B, Schulz E, Riggs M, Dus I, et al. Bone density assessments of dental implant sites: 2. Quantitative cone-beam computerized tomography. Int J Oral Maxillofac Implants. 2005 May-Jun;20(3):416-24.
29. Scarfe WC, Farman AG, Sukovic P. Clinical applications of cone-beam computed tomogra-phy in dental practice. J Can Dent Assoc. 2006 Feb;72(1):75-80.
30. Haristoy RA, Valiyaparambil JV, Mallya SM. Correlation of CBCT gray scale values with bone densities. Oral Surg Oral Med Oral Pathol Oral Radiol Endod. 2009;107(4):e28.
31. Lagravere MO, Carey J, Ben-Zvi M, Packota GV, Major PW. Effect of object location on the
density measurement and Hounsfield conver -sion in a NewTom 3G cone beam computer to-mography unit. Dentomaxillofac Radiol. 2008 Sep;37(6):305-8.
32. Parsa A. Ibrahim N, Hassan B, Motroni A,
van der Stelt P, Wismeijer D. Influence of cone
beam CT scanning parameters on gray value measurements at an implant site. Dentomaxillo-fac Radiol. 2013 Mar;42(3):79884780.
33. Oliveira ML, Tosoni GM, Lindsey DH,
Men-doza K, Tetradis S, Mallya SM. Influence of ana -tomical location on CT numbers in cone beam computed tomography. Oral Surg Oral Med Oral Pathol Oral Radiol. 2013 Apr;115(4):558-64. 34. Loubele M, Jacobs R, Maes F, Denis K, White S, Coudyzer W, et al. Image quality vs. ra-diation dose of four cone beam computed tomog-raphy scanners. Dentomaillofacial Radiol. 2008 Sep;37(6):309-18.
35. De Vos W, Casselman J. Swennen GR. Cone-beam computerized tomography (CBCT)
imag-ing of the oral and maxillofacial region: a system-atic review of the literature. Int J Oral Maxillofac Surg. 2009 Jun;38(6);609-25.
36. Pauwels R, Jacobs R, Singer SR, Mupparapu M. CBCT-based bone quality assessment: are
Hounsfield units applicable? Dentomaxillofac
Radiol. 2015;44(1):20140238.
Please cite this paper as: Mehralizadeh S, Talaipour
A, Olyaee P, Amiri siavoshani M. Correlation Be-tween Tissue Densities in Computed Tomography and Three Different Cone-Beam Computed
To-mography Units (In Vitro). J Res Dentomaxillofac