HIGHLIGHTED ARTICLE
| INVESTIGATION
How Boundaries Form: Linked Nonautonomous
Feedback Loops Regulate Pattern Formation in
Yeast Colonies
Sarah Piccirillo,* Abbigail H. McCune,*,1Samuel R. Dedert,*,2Cassandra G. Kempf,*,3Brian Jimenez,* Shane R. Solst,*,4LeAnn M. Tiede-Lewis,†and Saul M. Honigberg*,5 *Division of Cell Biology and Biophysics, School of Biological and Chemical Sciences and†UMKC Department of Oral and Craniofacial Sciences, University of Missouri-Kansas City, Missouri 64108
ABSTRACTUnder conditions in which budding yeast form colonies and then undergo meiosis/sporulation, the resulting colonies are organized such that a sharply defined layer of meiotic cells overlays a layer of unsporulated cells termed “feeder cells.” This differ-entiation pattern requires activation of both theRlm1/cell-wall integrity pathway and theRim101/alkaline-response pathway. In the current study, we analyzed the connection between these two signaling pathways in regulating colony development by determining expression patterns and cell-autonomy relationships. We present evidence that two parallel cell-nonautonomous positive-feedback loops are active in colony patterning, anRlm1-Slt2loop active in feeder cells and an Rim101-Ime1loop active in meiotic cells. The Rlm1-Slt2loop is expressedfirst and subsequently activates theRim101-Ime1loop through a cell-nonautonomous mechanism. Once activated, each feedback loop activates the cell fate specific to its colony region. At the same time, cell-autonomous mechanisms inhibit ectopic fates within these regions. In addition, once the second loop is active, it represses the first loop through a cell-nonautonomous mechanism. Linked cell-cell-nonautonomous positive-feedback loops, by amplifying small differences in microenvironments, may be a general mechanism for pattern formation in yeast and other organisms.
KEYWORDSRlm1; Rim101; Ime1; Slt2; cell autonomy; cell–cell signaling
W
HILE pattern formation during metazoan development has been studied extensively (reviewed in Dahmannet al. 2011; Perrimon et al. 2012; Sjöqvist and Andersson 2017), much less is known about pattern formation in micro-organisms. Communities of microorganisms, e.g., colonies and biofilms, are not homogeneous or random structures; instead, they are organized to contain sharply defined re-gions of cell types. These patterned communities, which are found in both bacteria and eukaryotic microorganisms, share
the properties of requiring chemical signals between cells (Shank and Kolter 2011; Claessen et al. 2014; Du et al.
2015) and providing biological function not possible for single microbial cells (reviewed in Allocati et al. 2015; van Gestel
et al.2015; Fischbach and Segre 2016; Honigberg 2016). In the model genetic eukaryotic microorganism,Saccharomyces cerevisiae, several types of community organization have been observed (reviewed in Honigberg 2011; Vachova and Palkova 2018). For example, a diploid yeast colony is partitioned into sharply defined layers of sporulat-ing (meiotic) and nonsporulatsporulat-ing cells. Specifically, after col-ony growth ceases, a thin layer of cells near the center of the colony induce Ime1 (reviewed in Neiman 2011; Honigberg 2016), a master regulator that activates sporulation in this layer (Piccirilloet al.2010). Over time, this thin sporulation layer expands to eventually include the top half of the colony, whereas the cells underlying the sporulation layer never sporulate (Piccirilloet al.2010). This colony sporulation pat-tern is observed in a range of S. cerevisiaelaboratory strain backgrounds as well as in S. cerevisiae and S. paradoxus Copyright © 2019 by the Genetics Society of America
doi:https://doi.org/10.1534/genetics.119.302700
Manuscript received May 24, 2019; accepted for publication October 15, 2019; published Early Online October 16, 2019.
Available freely online through the author-supported open access option.
Supplemental material available at figshare: https://doi.org/10.25386/genetics. 9978863.
1Current address: Iowa State University, Ames, IA 50011.
2Current Address: University of Alabama at Birmingham, Birmingham, AL 35294. 3Present address: Stowers Institute of Medical Research, Kansas City, MO 64110. 4Present address: University of Iowa, Iowa City, IA 52242.
5Corresponding author: School of Biological and Chemical Sciences, 5007 Rockhill
strains newly isolated from the wild. Indeed, in these wild strains, this sporulation pattern can be observed on a range of carbon and nitrogen sources (Piccirillo and Honigberg 2010). Through a range of conditions, colony sporulation pat-terning is characterized by the sharp boundary between a top layer of sporulating cells and a bottom layer with essentially no sporulation. The cells of the underlying unsporulated layer in colonies are termed feeder cells. Feeder cells are more perme-able than undifferentiated cells, and, probably as a result of this permeability, provide signals and/or nutrients that stimu-late sporulation in the overlying layer (Piccirilloet al.2015).
Both the cell-wall integrity (CWI) MAPK pathway and the alkaline response (AR) pathway have been implicated in the dual-layer colony pattern described above. The CWI pathway activates cell-wall remodeling (reviewed in Levin 2011; Sanz
et al.2017), and a target of this pathway, theRlm1 transcrip-tion factor, is activated in colonies specifically in the feeder-cell layer (Piccirillo et al. 2015). Indeed, examination of sections from embedded colonies indicates a feeder layer does not form inrlm1Dcolonies, sporulation is less efficient, and the residual spores are distributed throughout colonies rather than residing only in the upper layer. BecauseRlm1is activated in the lower colony layer, but required for sporula-tion in the upper layer, Rlm1 must activate sporulation through a cell-nonautonomous mechanism. In other words,
Rlm1expressed in one cell layer activates sporulation in an overlying cell layer through cell-to-cell signaling.
The rlm1D colony sporulation-pattern described above contrasts with the pattern observed in rim101D colonies.
Rim101 is essential for activation of the AR pathway (reviewed in Maeda 2012; Serra-Cardona et al. 2015). In
rim101Dcolonies, sporulation initiates in the same narrow central band of cells as in the wild type, but in the mutant colonies, this band fails to expand over time (Piccirilloet al.
2010). In addition, whereas the CWI pathway is only re-quired for efficient sporulation in colonies (Piccirillo et al.
2015), the AR pathway is required for efficient induction of
IME1, and, hence, sporulation, in both colonies or cultures (Li and Mitchell 1997; Piccirilloet al.2010). To explain the rim101D colony sporulation pattern, we proposed that
Rim101forms a nonautonomous positive-feedback loop with
IME1 (Piccirilloet al.2010). In this model,IME1expression leads to increased respiration, and, hence, raises the environ-mental pH (Hayashiet al.1998; Piccirilloet al.2010); in turn, this alkaline environment activates the Rim101pathway in neighboring cells, and, hence, induces IME1 in these cells (Piccirilloet al.2010).
The CWI and AR pathways respond to different cellular stresses, and act in parallel to regulate cell-wall synthesis (Castrejonet al.
2006). However, the relationship between these pathways in controlling colony sporulation is unknown. In the current study, we determined the interaction between these pathways through epistasis, cell autonomy, and colony expression/localization assays. Our results indicate that linked cell-nonautonomous positive-feedback loops coupled with cell autonomous repression of alternative fates underlies pattern formation.
Materials and Methods
Strains and plasmids
All strains used in the study (Supplemental Material, Table S1) were constructed in a modified W303 strain background (SH777) and are prototrophs. Deletion mutants were con-structed by designing PCR fragments to replace.90% of the ORF with theURA3,TRP1, orLEU2gene as described (Gray and Honigberg 2001; Gray et al. 2005). The RIM20-GFP allele was constructed by integrating GFP-TRP1 at the C-terminus of the RIM20 ORF as described (Boysen and Mitchell 2006). All newly constructed genomic alleles were verified by diagnostic PCR with primersflanking the targeted region (Gray and Honigberg 2001; Gray et al. 2005). The
rim101D rlm1D prIME1-mCherry mutant was constructed by crossing single mutants, sporulating the heterozygous dip-loid, and dissecting tetrads. Plasmids used in the study were YCp50(URA3)-UASRlm1-LacZ (Jung et al. 2002) and
YEp353(URA3)-prZPS1-LacZ (Freyet al.2011).
Media and growth conditions
Except as noted below, all colonies in this study were grown as spot colonies inoculated with 0.5 ml of a 2 3 108cells/ml
suspension in water on Sp2% medium (2% potassium ace-tate, 0.5% yeast extract, 2% agar, pH 7.0) or the same me-dium containing 40 mg/ml X-gal to monitor LacZ expression (Piccirilloet al.2015). A total of 20 colonies were inoculated per plate in a circular arrangement, with all colonies equally spaced and0.5 cm from the edge of the plate. For chimeric colonies specifically, inoculations contained equal numbers of signal and response strains.
High frequencies of Rim20-GFP foci were achieved by growing colonies on Sp6% media (6% potassium acetate, 0.5% yeast extract, 2% agar, pH 7.0). High expression levels of ZPS1-LacZ (as well as prIME1-LacZ and UASRlm1-LacZ)
were achieved by growing colonies on MPX medium (0.5% sodium pyruvate, 0.17% yeast nitrogen base, 0.5% ammo-nium sulfate, 40 mg/ml X-gal, 2% agar, pH 7.0). Other me-dia used in this study have been described previously (Rose
et al.1990; Piccirillo and Honigberg 2010).
Colony expression assays
samples were assayed, and the mean fraction of response cells to total cells in the colony was used to standardize the overall signal. As a second control, to ensure that response activity remained in the linear range of this assay, we verified that activity/response cell was not significantly different in pure colonies of the response strain relative to chimeric colonies containing an equal mixture of this response strain and an otherwise isogenic strain lacking the response gene (i.e.,
P.0.1).
Same-cell localization studies
The fraction of cells in aprIME1-mCherryRIM20-GFP colony that formed Rim20-GFP foci and/or expressed prIME1 -mCherry was determined by suspending the spot colony in 20 ml of sorbitol, placing 2 ml of the suspension on a micro-scope slide, covering this suspension with 4 ml mounting media (80% glycerol, 1 mg/ml p-phenylene diamine), and visualizing cells using conventional fluorescent microscopy. The fraction of cells in aprIME1-mCherry UASRlm1-LacZ
col-ony that expressed one or both alleles was determined by suspending spot colonies in 20 ml 0.1% SDS, 1 mMfl uores-cein di-b-D-galactopyranoside (FDG) in a PCR tube and in-cubating cells in a thermocycler for 10 cycles of 40 sec at 20° alternating with 60 sec at 30°, followed by 1 hr at 30°. Cell suspensions were then harvested, washed 43with 200 ml water, and visualized byfluorescent microscopy as above.
Cell and colony imaging and analysis
Images of individual cells in Figure 1 were captured by con-focal microscopy, red and green images merged, and Z-projections assembled in ImageJ (NIH). To visualize spatial expression patterns inRIM20-GFPprIME1-mCherry colonies, colonies were covered with agar and cleaved vertically through the center with a razor blade as described (Piccirillo et al.2015). Colony hemispheres were then trimmed into blocks, flipped 90°on to a coverslip with the exposed side down, confocal images collected, Z-projections assembled, and red and green images merged as above. Sec-tions were aligned using an ImageJ plug-in (Thevenazet al.
1998). The distribution offluorescent cells in the colony was quantified by superimposing a stack of 10 equal-size adjacent rectangles on the colony image and then manually determin-ing the frequency offluorescent cells in each rectangle. Im-ages were adjusted for brightness and contrast.
Sporulation, viability, and pH assays
To determine sporulation efficiency, colonies were resus-pended and examined by light microscopy for the fraction of cells that had formed asci. To measure viability of diploid cells in colonies, colonies were resuspended from Sp2% plates, diluted in 0.5 M sorbitol, and plated on His2 Lys2 synthetic medium containing 0.5 M sorbitol (Lee and Honigberg 1996). To monitor changes in pH, spot colonies were grown on Sp2% medium containing + 20 mg/liter phe-nol red for 4 days, an image of the top surface of a colony captured, and the red intensity of this image quantified as above.
Statistics and reproducibility
Except where noted in thefigure legends, all quantitative data in the study are expressed as the mean of four biological replicate experiments with error bars representing the SEM.
P-values are from unpaired Student’st-tests. All experiments were replicated on at least two separate dates, and except as noted in Table S1 all experiments on mutants were per-formed with at least two independently derived isolates of each mutant. Experiments based on scoring cell populations by microscopy were performed blind when possible, and at least 250 cells examined for each sample.
Data availability
All strains used in this study are described in Table S1 and are available upon request. The authors affirm that all data necessary for confirming the conclusions of the article are present within the article,figures, and tables. Supplemental material available at figshare: https://doi.org/10.25386/ genetics.9978863.
Results
Localization of Rim101 activity within colonies
To investigate the connection betweenRlm1andRim101in regulating colony patterning, we asked whether theRim101
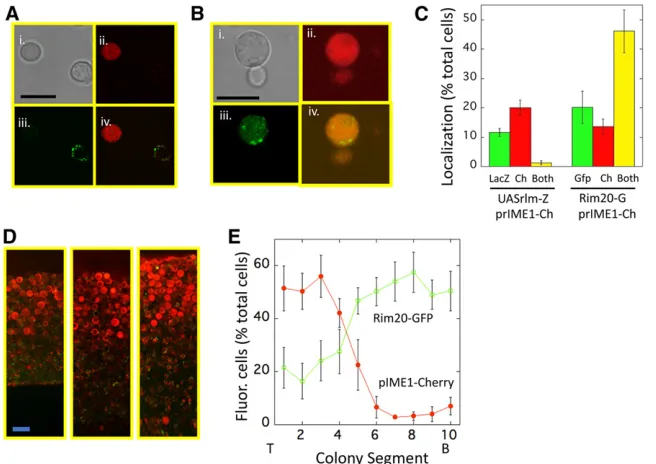
pathway was activated in meiotic cells and/or feeder cells within colonies. As afirst experiment, we usedfluorescence microscopy to verify a previous conclusion that the popula-tion of meiotic cells is distinct from the populapopula-tion of feeder cells (Piccirilloet al.2015). The former population was visu-alized as expressingprIME1-mCherry, whereas the latter pop-ulation was visualized as expressing UASRlm1-LacZ. For this
purpose, spot colonies of a prIME1-mCherry UASRlm1-LacZ
strain were incubated for 3–4 days, then colonies resus-pended, incubated with the lactose analog, FDG, and exam-ined byfluorescence microscopy (seeMaterials and Methods). As expected from the previous results, these colonies yielded many cells expressing one or the other allele but few, if any, cells expressing both alleles (Figure 1, A and C, left).
Next, we examined whether cells in colonies activated for the Rim101-pathway were also activated for IME1 expres-sion. Rim101 activity was detected by the formation of
Rim20-GFP foci (Boysen and Mitchell 2006). To identify cells activated for one or both pathways, we resuspended
RIM20-GFP prIME1-mCherry colonies and examined them by fluorescence microscopy for Rim20-GFP foci and/or
prIME1-mCherry expression. We found that these colonies contained many cells that had activated both pathways, as well as cells with only one or the other pathway active (Fig-ure 1, B and C, right). Thus, meiosis was initiated in a subset of the cells with theRim101pathway activated.
foci (Rim101 activity) within colonies. For this purpose,
RIM20-GFP prIME1-mCherry colonies were embedded in agar, cleaved vertically, and the exposed plane of the colony examined by confocal microscopy (seeMaterials and Meth-ods). As expected from earlier studies (Piccirilloet al.2015),
prIME1-mCherry was expressed specifically in the top layer of the colony. In contrast, we observedRim20-GFP foci in both the prIME1-mCherry top layer and in the underlying layer (Figure 1, D and E, separate red and green images in Figure S1). Indeed, quantification of multiple colony sections dem-onstrated that at this stage of colony development, cells displaying Rim20-GFP foci were more prevalent in the un-derlying layer. Thus, the results presented in Figure 1, C–E demonstrate that theRim101pathway is active in both the meiotic layer and the feeder cell layer of colonies.
Epistasis experiments indicate that Rim101 and Rlm1 pathways regulate sporulation through distinct pathways
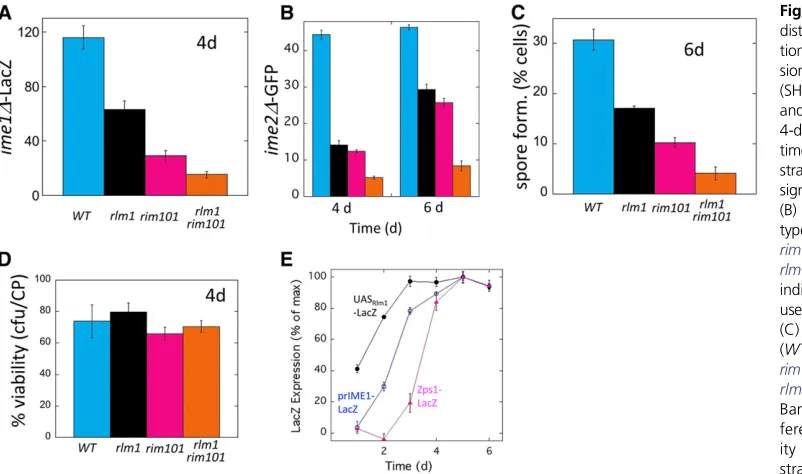
Since both theRlm1pathway, which is activated only in the lower (feeder cell) layer, and theRim101pathway, which is activated throughout the colony, induceIME1transcription, we investigated the relationship of these two pathways in regulating IME1 using epistasis (double mutant) analysis. In particular, we comparedprIME1-LacZexpression in wild-type,rim101D,rlm1D, andrim101Drlm1Dcolonies by grow-ing these colonies on medium containgrow-ing X-gal and then imaging the top surface of these colonies for the level of blue X-gal metabolite produced (seeMaterials and Methods). We found that either single mutant displayed2–4-fold dimin-ished expression ofprIME1-LacZ relative to the wild type, and the double mutant was decreased 10-fold relative to the
wild type (Figure 2A). If Rim101 andRlm1 acted only in the same linear pathway to activateIME1transcription, the double deletion mutant would not be more defective than either single mutant. Thus, our results are consistent with
Rlm1 and Rim101 activating sporulation through distinct pathways. For clarity, conclusions from this and all subse-quent experiments are diagrammed in Figure S2.
To confirm the above results, we used the samerim101Dand
rlm1Dsingle and double mutants to measure transcriptional induction of a second meiotic gene,IME2(Figure 2B), and to measure the formation of spores, which is thefinal event in the sporulation program (Figure 2C). Note that each assay moni-tors a separate level of control on sporulation. For example,
IME2, which encodes a Ser/Thr kinase required through both early and middle stages of meiosis, is regulated byIME1as well as throughIME1-independent pathways (Mitchellet al.1990). Similarly, spore formation requiresIME1,IME2, and additional pathways (Kassiret al.2003; Honigberg 2004). Nevertheless, we found that measuring either prIME2-GFP expression or spore formation yielded similar results to measuringprIME1 -LacZ (Figure 2, A–C).The differences between strains de-scribed above could in theory reflect differential cell viabilities. To test this possibility, we measured cell viability in the above wild-type and mutant strains. We found that all four strains maintained comparable and relatively high cell viabilities dur-ing the course of the experiment (Figure 2D). Thus, measure-ment ofIME1expression,IME2expression, spore formation, and cell viability all point to the conclusion that theRim101
andRlm1/CWI pathways activate sporulation through distinct pathways. As described below, although these pathways are distinct, they are not independent.
Figure 1 Colocalization ofIME1expression,Rlm1 activity and Rim101 activity within colonies. (A) Cells from a 3-day colony of UASRlm1-LacZ prIME1-mCherry strain (SH5904) visualized for (i) bright field, (ii) mCherry (iii), FDG metabolite, (iv) merge of FDG and mCherry images. As a control for possible interference of mCherry on the FDG signal, a control strain lacking theprIME1-mCherry allele (SH5408) yielded approximately the same fre-quency of FDG+cells (13.2 6 0.9,n= 3) as did the experimental strain (11.7 6 1.0, n= 3) (B) cells from a 3-day colony ofRIM20-GFPprIME1-mCherry strain (SH5252) visualized for (i) bright field, (ii) mCherry, (iii) GFP, (iv) merge of GFP, and mCherry images. (C) (Left) Cells resuspended from 4 day prIME1-mCherry UASRlm1-LacZ colonies (SH5904) scored by fluorescence microscopy for expression of UASRlm1-LacZ (“LacZ,”green bar) visualized by FDG (seeMaterials and Methods),prIME1-mCherry (“Ch,”red bar), or bothfluorophores (“Both,” yel-low bar) (n= 3). (Right) Cells resuspended from prIME1-mCherry RIM20-GFP (Rim20-G) colonies (SH6054) scored for expression ofRim20-GFP foci (“Gfp,” green bar), prIME1-mCherry (“Ch,” red bar) or bothfluorophores (“Both,”yellow bar),n= 3. (D) Representative regions from three independent colonies ofRIM20-GFPprIME1-mCherry/IME1
Rim101 is activated after Rlm1 and IME1
To further investigate the relationship between Rlm1 and
Rim101pathways in regulatingIME1, we compared the tim-ing of activation of these pathways to the timtim-ing of IME1
transcription. Rim101 pathway activity in this experiment was detected using theZPS1-LacZ response allele, which re-quires both RIM101 and alkaline pH for expression (Lamb
et al. 2001; Frey et al.2011). We compared the timing of LacZ expression in whole colonies in three strains that dif-fered only in the reporter-fusion allele—either ZPS1-LacZ,
prIME1-LacZ, or UASRlm1-LacZ. In this experiment, all three
strains wereime1Dto eliminate downstream effects of spor-ulation on gene expression, and expression of each gene is represented as a percentage of its maximum expression. As shown previously (Piccirilloet al.2015), UASRlm1-LacZ was
expressed in colonies 1–2 days earlier thanIME1. Further-more, we found thatZPS1-LacZ was induced much later in colony development than UASRlm1-LacZ, and slightly later
than prIME1-LacZ (Figure 2E). This expression pattern is consistent withRlm1andRim101activatingIME1through distinct pathways, with the Rlm1/CWI pathway acting earlier.
Cell autonomy tests of mutant alleles
The gradualRim101-dependent expansion of an initially nar-row central layer of sporulated cells to eventually include the entire top half of the colony led to the hypothesis thatIme1
activates Rim101 through a nonautonomousRim101-Ime1
positive feedback loop, i.e., Ime1 is required to produce a signal that activates Rim101 in neighboring cells (see
Introduction). To test this idea directly, we used the CCA (Piccirillo et al. 2010, 2015). This assay, which is used throughout the current study, utilizes “chimeric”spot colo-nies, which are colonies inoculated with an equal number of cells of two different genotypes.
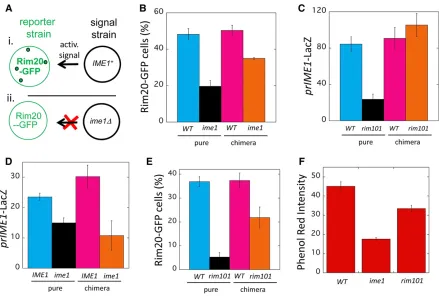
Chimeric colonics always contain an approximately equal mixture of a“response strain”and a “signal strain”(Figure 3A). The response strain carries a“response gene”that allows the activity of a gene product to be monitored. For example, in the CCA diagrammed in Figure 3A, the response gene is
RIM20-GFP. In contrast, the signal strain lacks this response gene, but instead contains alternative alleles of a “signal gene.”For example, in the CCA diagrammed in Figure 3A, the signal gene is eitherIME1orime1D. In a standard CCA, the response strain is also deleted for this signal gene, so any signal dependent on this gene can only originate from the signal strain.
The basic idea of the CCA is to compare two chimeric colonies that contain the same response strain but alternative signal strains. We refer to the chimeric colony containing the wild-type signal strain as the“wild-type chimeric colony”and the one containing the mutant signal strain as a “mutant (i.e. mutXD) chimeric colony.”For example, in the CCA dia-grammed in Figure 3A, if the fraction of cells forming
Rim20-foci is higher in wild-type (IME1) chimeric colonies than inime1Dchimeric colonies, thenIME1must stimulate theRim101pathway through a nonautonomous mechanism. Finding a cell-nonautonomous effect of a signal allele on a response gene implies that the signal gene is required to pro-duce a cell-to-cell signal, but it should be noted that other explanations are theoretically possible. For example, the
Figure 2 Rlm1andRim101have distinct roles in activating sporula-tion: (A) prIME1-LacZ expres-sion in wild-type (SH3830),rlm1D (SH4800) andrim101D(SH5312), and rim101D rlm1D (SH5729) 4-day colonies at the indicated times relative to a LacZ2 control strain (SH3972). Bars 3 and 4 are significantly different (P= 0.023). (B)ime2D-GFPexpression in wild-type (SH4805), rlm1D (SH5509),
rim101D(SH5545), and rim101D rlm1D (SH5513) colonies at the indicated times. SH3883 was used as a GFP2 control strain.
(C) Spore formation in wild-type (WT, SH3881), rlm1D(SH4708),
rim101D(SH4377), andrim101D
signal allele might affect response gene activity by affecting metabolism, and hence concentration of nutrients in the medium.
Interpretation of CCA results involves two separate com-parisons. The first of these is between the wild-type and mutant chimeric colonies as described above. The second com-parison is between two pure (i.e., not chimeric) colonies. Both pure colonies contain the same response gene as the chimeric colonies, but they differ from one another (like the chimeric colonies) in having alternative signal alleles (wild type or
mutXD). The pure colony comparison reveals the total effect (i.e., autonomous plus nonautonomous) of the mutant allele on the response gene. By subtracting the nonautonomous
effect from the total effect, the autonomous effect can be esti-mated. This dual comparison is particularly necessary because, as shown later in this study, the same allele may have both autonomous and nonautonomous effects on a response, and these effects may act in either the same or opposite directions (i.e., activation and/or repression).
An important control for the CCA assay verifies that mea-sured gene activity reflects activity/response cell and not variations in growth rates between signal and response strains (seeMaterials and Methods). Furthermore, a separate inter-nal control comparison verifies that the biological activity being measured is in the linear range of the assay (see
Materials and Methods).
Figure 3 NonautonomousRim101-Ime1positive feedback loop. (A) Diagram of chimeric colony assay: the activity of a response allele is compared between the chimeric colonies diagrammed in (i and ii). Each chimeric colony is a 50:50 mixture of a response strain (left side) and signal strain (right side). Note that theRIM20-GFP response strain is identical in both chimeric colonies, and the signal strain is eitherIME1(top right) orime1D(bottom right). If the chimeric colony diagrammed in (i) formsRim20-GFP foci (indicated by green dots in diagram) to higher levels than the chimeric colony diagrammed in (ii), thenIme1must activateRim20foci formation in neighboring cells,i.e.,IME1is required for cell-nonautonomous activation ofRim20 foci. (B) Results of chimeric colony assay (CCA) diagrammed in (A) measuring effect ofime1DonRim20-GFP foci formation. Pure colonies ofRIM20-GFP strains that were eitherIME1(WT) (blue, SH6055) orime1D(black, SH5252) and chimeric colonies containing anime1DRIM20-GFP response strain mixed with either aWT(magenta, SH3826) or anime1D(orange, SH3830) signal strain.Y-axis represents the fraction of cells in the colony that display Rim20-GFP foci. (C) CCA measuring effect ofrim101DonprIME1-LacZexpression. Pure colonies ofprIME1-LacZstrains that were eitherRIM101(WT) (blue, SH3827) orrim101D(black, SH6034) and chimeric colonies containing aRIM101prIME1-LacZ response strain mixed with either aWT(magenta, SH3881) or arim101D(orange, SH4376) signal strain. (D) Autochimeric colony assay measuring effect ofime1Don expression ofprIME1-LacZ. Pure colonies of aprIME1-LacZstrain that were eitherIME1(WT) (blue, SH5868) orime1D(black, SH5900) and chimeric colonies containing anime1D
Rim101 and IME1 form a cell-nonautonomous positive feedback loop
In the particular CCA described above, comparing wild-type to
ime1Dpure colonies forRim20-GFP foci formation revealed higher levels of foci in the wild-type colony. Thus, the total effect ofIme1is to activate theRim101pathway (Figure 3B, left two columns). Furthermore, comparing chimeric colonies revealed that the wild-type chimeric colony displayed signif-icantly more cells withRim20-GFP foci than did theime1D
chimeric colony (Figure 3B, right two columns). Indeed, the frequency of Rim20-GFP foci in IME1 colonies relative to
ime1Dcolonies was approximately the same in chimeric col-onies as in pure colcol-onies. Thus,IME1activates theRim101
pathway largely through a nonautonomous mechanism con-sistent with the hypothesis of a nonautonomous positive-feedback loop (Figure 3A).
We next used the CCA to determine the converse regula-tory relationship,i.e., to test the effect ofrim101DonIME1
transcription. As expected, given thatRim101activates of
IME1transcription (Figure 2A), in the pure colony compar-ison,RIM101colonies displayed much higherprIME1-LacZ
expression than did rim101D colonies (Figure 3C, bars 1 and 2). For the chimeric colony comparison,RIM101 col-onies displayed approximately the same expression as
rim101D colonies (Figure 3C, bars 3 and 4). Hence, even in the context of a cell-nonautonomousRim101-Ime1 feed-back loop, Rim101 activates IME1 through a largely cell autonomous mechanism. Thus, a cell-nonautonomous feedback loop can have some components that are cell autonomous.
Ime1 and Rim101 autochimeras confirm Rim101-Ime1 nonautonomous positive feedback loop
One prediction of a cell-nonautonomousRim101-Ime1 posi-tive feedback loop is that anime1Dallele will result in lower
IME1expression in neighboring cells. To test this prediction, we applied the CCA so that the response allele isprIME1-LacZ
and the signal allele is eitherIME1orime1D(an“auto-chimeric colony”). In comparing pure colonies, we found signifi-cantly higherprIME1-LacZexpression inIME1colonies than in ime1D colonies; this result is consistent with the Ime1
positive-feedback loop proposed previously (Shefer-Vaida
et al.1995; Morettoet al.2018). In comparing chimeric col-onies, we also found expression to be significant higher in
IME1colonies thanime1Dcolonies (Figure 3D). Thus,IME1
activates its own expression in colonies primarily through a cell-nonautonomous positive-feedback loop. That is,Ime1is required for a signal that activates IME1 transcription in neighboring cells.
Similarly, we compared the frequency of cells withRim20 -GFP foci in auto-chimeric colonies containing either a
RIM101or arim101Dsignal strain. In the pure colony com-parison, many fewer cells displayed Rim20-GFP foci in
rim101D colonies than inRIM101colonies (Figure 3E, left two bars) as expected sinceRim20-foci formation requires
Rim101. In the chimeric colony comparison as well,RIM101
colonies yielded significantly higher frequencies ofRim20 -GFP foci than rim101D colonies (Figure 3E, right two bars). Thus, both auto-chimeric colony experiments support the idea of an Rim101-Ime1 nonautonomous positive feed-back loop.
Rim101-Ime1 feedback loop driven by extracellular alkaline pH
A nonautonomous feedback loop requires an extracellular signal, and one candidate signal for the Rim101-Ime1loop is alkaline pH. For example, sporulating colonies increase the pH of their environment (Hayashiet al.1998; Piccirilloet al.
2010; Zhaoet al.2018), and alkaline pH is the primary stim-ulus for theRim101/AR pathway. To determine whether in-creased pH drives theRim101-Ime1positive-feedback loop, we performed two types of experiments. First, we compared colonies grown on pH 8.0vs.pH 6.0 medium for bothRim20 -GFP foci formation andprIME1-mCherryexpression (Figure S3). We found that the frequency of cells that displayed ei-ther activity was increased at the higher pH. Second, we compared the pH of the medium surrounding wild-type
rim101Dorime1Dcolonies using phenol red as a pH indica-tor. We found that the pH surrounding either mutant colony was significantly lower than wild-type colonies (Figure 3F). Thus, bothIME1expression andRim101activity were stim-ulated by extracellular pH, and bothIME1andRIM101were required for the increase in extracellular pH as colonies de-velop. These results support the idea that alkaline pH is the extracellular signal driving theRim101-Ime1positive feed-back loop.
Cell-nonautonomous positive feedback loop regulates Rlm1 in colonies
The discovery of the cell nonautonomousRim101-Ime1 pos-itive feedback loop in colonies led us to ask whetherRlm1, which is active in feeder cells, might also form a feedback loop. For this purpose, another autochimeric colony experi-ment was performed; in this case, with a UASRlm1-LacZRLM1
response strain and either RLM1+or rlm1D signal strains.
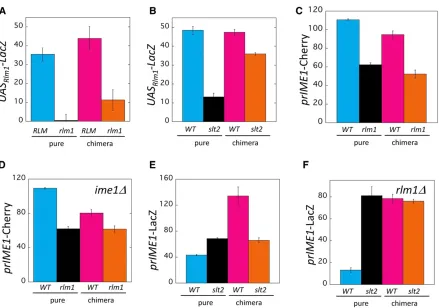
In comparing pure colonies, UASRlm1-LacZ expression was
much higher in the wild type colony than in therlm1Dcolony (Figure 4A, left two bars), as expected given thatRlm1 acti-vates transcription of this response gene. In comparing chi-meric colonies, UASRlm1-LacZ expression was also higher in
the wild-type colony than in therlm1D colony (Figure 4A, right two bars). Thus, Rlm1activates itself through a non-autonomous mechanism.
In cultures subject to cell-wall stress, Slt2kinase (also termed Mpk1 kinase) phosphorylates and activates Rlm1. In turn, the Rlm1 transcription factor may activate SLT2
transcription (Dodou and Treisman 1997; Watanabeet al.
CCA with a UASRlm1-LacZ response strain and eitherSLT2
or slt2Dsignal strains. As expected from the studies cited above, in pure colonies, the response gene was expressed to much lower levels in theslt2Dmutant than in the wild type (Figure 4B, left two bars). Similarly, in chimeric colonies, UASRlm1-LacZ was expressed to significantly lower levels in
the slt2Dcolony than in the wild-type colony (Figure 4B, right two bars). Thus,Slt2activatesRlm1in part through a nonautonomous mechanism; however, the total effect of
Slt2on UASRlm1-LacZ is much greater than its
nonautono-mous effect on this gene (Figure 4B,cf. right two bars to left two bars). Thus, even in the context of a cell-nonautonomous
Rlm1-Slt2positive feedback loop,Slt2activatesRlm1through largely a cell-autonomous mechanism.
Rlm1 activation of IME1 is amplified by Ime1 feedback loop
As described in the Introduction, we previously concluded that
Rlm1 activates IME1 expression in colonies through a cell nonautonomous mechanism (Piccirilloet al.2015). As an ini-tial experiment, we confirmed this conclusion under the con-ditions of the current study. Consistent with the results of Figure 2A, in the pure colony comparison, rlm1D colonies displayed much lower prIME1-mCherry expression than wild-type colonies (Figure 4C, left two bars). In the chimeric colony comparison, prIME1-mCherry was expressed to higher levels in the wild-type colonies than inrlm1Dcolonies (Figure 4C, right two bars). Indeed, the ratio between wild-type and
rlm1D colonies was very similar in the pure colony and chimeric colony comparison. Thus, as expected, under the
Figure 4 NonautonomousRlm1-Slt2 positive feedback loop regulates theRim101-Ime1feedback loop. (A) Autochimeric colony assay measuring effect ofrlm1Don UASRlm1-LacZ expression. Pure colonies of UASRlm1-LacZ strains that were eitherRLM1(WT)(blue, SH5069) orrlm1D(black, SH5863) and chimeric colonies containing anRLM1UASRlm1-LacZ response strain mixed with either aWT(magenta, SH3882) or anrlm1D(orange, SH4767) signal strain. (B) CCA measuring effect ofslt2Don UASRlm1-LacZ expression. Pure colonies of UASRlm1-LacZ strains that were eitherSLT2(WT)(blue, SH5069) or
slt2D(black, SH6062) and chimeric colonies containing theSLT2UASRlm1-LacZ response strain mixed with either aWT(magenta, SH3882) orslt2D (orange, SH5520) signal strain. Bars 3 and 4 are significantly different (P= 0.007,n= 3). (C) CCA measuring effect ofrlm1DonprIME1-mCherry expression. Pure colonies of prIME1-mCherry strains that were eitherRLM1(WT)(blue, SH4652) orrlm1D(black, SH5875) and chimeric colonies containing anrlm1DprIME1-mCherry response strain mixed with either aWT(magenta, SH3826) or anrlm1D(orange, SH4799) signal strain. (D) CCA measuring effect ofrlm1DonprIME1-mCherry expression whenIME1is absent. Pure colonies ofprIME1-mCherry/ime1Dstrains that were eitherRLM1 (WT)(blue, SH4414) orrlm1D(black, SH4967) strains and chimeric colonies containing anrlm1DprIME1-mCherry/ime1Dresponse strain mixed with either aWT(magenta, SH3830) or anrlm1D(orange, SH4800) signal strain. All strains used wereime1D.Bars 3 and 4 are significantly different (P= 0.04). (E) CCA measuring effect ofslt2DonprIME1-LacZ expression. Pure colonies ofprIME1-LacZ strains that are eitherSLT2(WT)(blue, SH3826) or
slt2D(black, SH6105) and chimeric colonies containing anslt2DprIME1-LacZ response strain mixed with either aWT(magenta, SH3882) or anslt2D
growth conditions used in the current study,Rlm1activates
IME1primarily through a cell nonautonomous mechanism. That is,Rlm1, which is active in the lower layer, is required to provide a signal that stimulates meiosis in the upper layer.
Once a signal gene is shown to nonautonomously regulate a response gene by an initial CCA, it is sometimes useful to determine if a second gene also acts in the same regulatory circuit. In the current study, this was accomplished by a performing a second CCA, which was identical to the initial one except with the second gene deleted in both signal strains, and comparing the results of the two CCAs. For example, to determine whether activation ofIME1transcription byRlm1
requires theIme1-dependent positive feedback loop, we re-peated the CCA described above except that both signal strains (and the response strain) wereime1D. Pure colonies displayed similar results in the second CCA (Figure 4D) as in the initial CCA (Figure 4C). When wild-type andrlm1D chi-meric colonies were compared in the second CCA, there was still a significantly higherprIME1-mCherry expression in the wild-type chimeric colony, as we had also seen in the initial CCA. However, this difference is much smaller in the second (ime1D) CCA than in the initial (IME1) CCA (Figure 4, C and D). Thus, the effect ofRlm1onprIME1-mCherry expression is likely amplified by theIme1-dependent feedback loop, but does not completely depend on this loop.
Slt2 represses IME1 through a cell autonomous mechanism
Given that Rlm1 activates IME1 transcription through a nonautonomous mechanism, we next asked whether the
Slt2component of the feedback loop also activatesIME1
transcription. For this purpose, we performed the CCA using a prIME1-LacZ/IME1 response strain, and signal strains that were eitherSLT2orslt2D(Figure 4E). Surpris-ingly, in the pure colony comparison, wild-type colonies yielded lowerprIME1-LacZexpression than didslt2D col-onies. In the chimeric colony comparison, wild-type colo-nies displayed higherprIME1-LacZexpression thanslt2D
colonies. Thus Slt2, like Rlm1, activatesIME1 transcrip-tion through a cell nonautonomous mechanism, but, at the same time,Slt2repressesIME1through a cell autonomous mechanism.
To explore the opposing roles ofSlt2onIME1expression described above, we tested the role ofRlm1in these roles. To this purpose, we performed a second CCA identical to the initial CCA described in the previous paragraph except that all strains were alsorlm1D. In the pure colony comparison for this second CCA,prIME1-LacZwas expressed to lower levels in wild-type colonies than inslt2Dcolonies (Figure 4, E and F). In fact, the total effect ofSlt2on the response gene was much greater in this second CCA than in the initial CCA (Fig-ure 4E). However, in the chimeric colony comparison for the second CCA, unlike in the initial CCA, prIME1-LacZ was expressed to approximately the same level in wild-type colo-nies as inslt2Dcolonies. Thus,Slt2activatesIME1through an
Rlm1-dependent cell nonautonomous mechanism, but it also
repressesIME1through an Rlm1-independent cell-autonomous mechanism.
Effect of Rim101-Ime1 feedback loop on Rlm1 activity
Because theRlm1-Slt2feedback loop activates theRim101
-Ime1feedback loop, we investigated other possible interac-tions between these two loops. First, we performed a CCA to determine the effect ofIME1onRlm1activity. In the pure colony comparison,ime1Dcolonies expressed the UASRlm1
-LacZ response allele to significantly higher levels than wild-type colonies. In contrast, in the chimeric colony compari-son, expression of UASRlm1-LacZ in ime1D colonies was
approximately the same as in wild-type colonies (Figure 5A). Thus,Ime1repressesRlm1through a cell autonomous mechanism.
As an independent test of the effect of IME1 on Rlm1
activity described above, we measured the effect of overex-pressingIME1using a high-copy plasmid (Honigberg and Lee 1998) on UASRlm1-LacZ expression (Figure 5B). All strains in
these CCAs wereime2D, so they cannot initiate meiosis. In the pure colony comparison, overexpressingIME1(oeIME1) inhibited UASRlm1-LacZ expression relative to the wild type.
In the chimeric colony comparison, oeIME1 in the signal strain had no effect on UASRlm1-LacZ expression relative to
the wild type. Thus, our results with bothime1DandoeIME1
colonies indicate thatIME1repressesRlm1, and that it does so through a cell autonomous mechanism.
SinceIme1repressesRlm1activity, we next performed a CCA to determine whetherRim101also represses this activ-ity. To eliminate the possibility thatRim101regulatesRlm1
by activatingIME1, these CCA experiments were performed in ime1D strains. In the pure colony comparison, rim101D
colonies displayed increased UASRlm1-LacZ expression
rela-tive toRIM101colonies. In the chimeric colony comparison,
rim101D colonies also displayed increased UASRlm1-LacZ
relative to wild-type colonies (Figure 5C). Thus, in contrast to the cell-autonomous repression of Rlm1 activity by
IME1,Rim101repressesRlm1through a cell-nonautonomous mechanism.
The above result, along with the discovery that theRim101
pathway is active in both colony layers (Figure 1A), and that this pathway is activated 2–3 days afterRlm1(Figure 2E), suggests the hypothesis that colony alkalization activates
Rim101in feeder cells, and this activation inhibitsRlm1 ac-tivity in these cells. To test this possibility, we determined the effect of pH on UASRlm1-LacZ expression in RIM101 and rim101D strains. Both strains contain ime1D mutations so
Ime1-dependent controls will be inactive. We found that, in
RIM101strains, UASRlm1-LacZ was expressed to significantly
higher levels in medium buffered to pH 7.0 than in medium buffered to pH 9.0. In contrast in arim101Dstrain, UASRlm1
underlying feeder cells, activating Rim101, and, hence, re-pressingRlm1in this lower cell layer.
Rlm1 does not directly affect Rim101 activity
We next tested the reciprocal relationship to the one described above; namely, we asked whether Rlm1regulatesRim101. For this purpose, we performed a CCA measuring the effect ofrlm1DonRim20-GFP foci formation. To eliminateIME1 -dependent effects, this CCA used onlyime1Dstrains. We found that in either the pure or chimeric colony comparisons, there was no significant effect ofrlm1DonRim20-GFP foci forma-tion (Figure 5D). Thus, Rlm1does not activate theRim101
pathway independently ofIME1.
Rim101 represses IME1 through an Rlm1-dependent mechanism
Interestingly, Rim101both activates IME1(Figure 3C) and represses theIME1-activator,Rlm1(Figure 5C). To investi-gate these opposite effects, we repeated the initialrim101D
prIME1-LacZ CCA as in Figure 3C except that strains in this second CCA wereime1Dso that theRim101-Ime1feedback loop would be disabled. As expected from the initial CCA, in the pure colony comparison from the second CCA,prIME1 -LacZ was expressed at higher levels in wild-type than in
rim101Dcolonies (Figure 5E, left two bars). In contrast, un-like the initial CCA, for the chimeric colony comparison,
prIME1-LacZ was expressed at lower levels in wild-type
Figure 5 Both autonomous an nonautonomous mechanisms divide meiotic fate from feeder-cell fate. (A) Chimeric whole colony expression assay measuring effect ofime1Don expression of UASRlm1-LacZ. Pure colonies of UASRlm1-LacZ strains that are eitherIME1(WT)(blue, SH5069) orime1D (black, SH5410) and chimeric colonies containing anime1DUASRlm1-LacZ response strain mixed with either aWT(magenta, SH3881) or anime1D (orange, SH5484) signal strain. Bars 1 and 2 are significantly different (P= 0.01,n= 8). (B) Chimeric whole colony expression assay measuring effect of
colonies than in rim101D colonies (Figure 5E, right two bars). To confirm this result, we also performed a CCA mea-suring the effect of rim101D on a second meiotic response gene,prIME2-GFP with all strains beingime2D, and similar results were obtained as with theIME1response gene (Figure S5). These results indicate that in an imeD background,
Rim101 activates the meiotic program autonomously while repressing this program nonautonomously.
How mightRim101nonautonomously repressIME1?Our
findings indicate thatRim101repressesRlm1andRlm1 ac-tivatesIME1; thus,Rim101might repressIME1by repressing
Rlm1. To test this idea, we repeated the same CCA as in Figure 5E except with all strains being rlm1D as well as
ime1D. In these latter chimeric colonies, autonomous activa-tion of prIME1-LacZ by Rim101 was still observed, but nonautonomous repression of IME1 by Rim101 was not (Figure 5F). Thus, Rim101 activates IME1 through an
Rlm1-independent autonomous mechanism while repressing this same gene through anRlm1-dependent nonautonomous mechanism.
Discussion
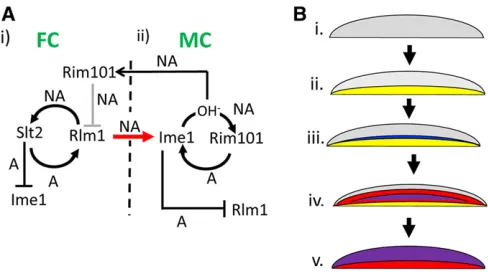
Many microbial communities are strikingly organized with respect to cell types, but the mechanisms underlying this organization remain mysterious. The results presented above, and in previous studies (Piccirilloet al.2015, 2017), lead to a model for colony organization/pattern formation in yeast. These findings include localization of gene expression and identification of cell–cell signaling within colonies as cata-loged diagrammatically in Figure S2; a model derived from these results is shown in Figure 6. By this model, colony pattern formation consists offive sequential steps. First, a cell nonautonomous positive feedback loop involvingRlm1and
Slt2 is activated in the bottom layer of cells (Figure 6A, i), causing them to differentiate into feeder cells (Figure 6B, i and ii, region of Rlm1 activity shown in yellow). Second, these feeder cells, which are more permeable than undiffer-entiated cells, produce a signal that triggersIme1expression in a narrow layer of cells overlying the feeder cell layer (Fig-ure 6A, i and ii and Fig(Fig-ure 6B, iii,Ime1 expression shown in blue). Once Ime1 is expressed, this initiates a second nonautonomous positive feedback loop involvingIme1and
Rim101(Figure 6A, ii). Third, this second feedback loop al-lows the gradual expansion of the initial narrow layer of meiotic cells, driven by a gradual expansion of the region of increased pH, (Figure 6B, iv,Rim101activation shown in red, and activation of bothIME1andRim101shown in purple). Fourth, through cell autonomous mechanisms, Slt2inhibits
IME1expression in the lower layer (Figure 6A, i), whereas
Ime1 inhibitsRlm1activity in the top layer (Figure 6A, ii). Fifth, at late stages of colony development, theIme1-Rim101
feedback loop becomes active throughout the top of the col-ony, and colony alkalization spreads to the feeder cell layer, activating Rim101, and, hence, repressingRlm1 activity in this layer (Figure 6A, i and Figure 6B, v). Through these
mechanisms,IME1expression is limited to the top layer of the colony, whereasRlm1activity is transient and limited to the lower layer.
Remarkably, the above model displays three types of reg-ulatory symmetry between upper and lower colony layers. The
first type of symmetry is that cell-nonautonomous positive feedback loops act in both layers. Although positive feedback regulation is expected from prior studies of bothIme1 (Shefer-Vaidaet al.1995; Morettoet al.2018) andRlm1(Dodou and Treisman 1997; Watanabe et al. 1997; Jung et al. 2002; Garcíaet al.2016), it is striking that positive feedback in both layers is cell-nonautonomous. A second type symmetry is that within the cells in which a feedback loop is expressed, the components of this loop repress components of the other loop. A final type of symmetry is that each feedback loop regulates activity of the other loop through cross-layer cell-to-cell signals.
Figure 6 Model of colony patterning through linkedRim101-Ime1and Rlm1-Slt2nonautonomous positive feedback loops (A) Genetic circuitry of pattern formation. Arrows represent activation and T-bars represent re-pression; autonomous or nonautonomous regulation is represented by an A or NA respectively adjacent to the arrow or bar. (i) Positive feed-back loop in feeder cells (FCs) initiate colony development. FCs in the bottom layer of the colony activate a nonautonomous positive-feedback loop containing Rlm1 and Slt2. Rlm1 expressed in FCs also induces IME1
This symmetry suggests that nonautonomous positive feedback loops, coupled with autonomous repression of al-ternative fates, may be a general mechanism for pattern formation. In particular, cell nonautonomous feedback loops can amplify initially small differences between colony micro-environments. As an example, a gradient of nutrients diffusing upward in the colony or oxygen diffusing downward could result in very different microenvironments at the top and bottom of colonies, but it is a riddle how this gradual change in microenvironment would lead to sharp boundaries be-tween regions of colonies containing different cell types, such as the horizontal boundary that forms between meiotic cells and feeder cells near the center of a colony (Piccirilloet al.
2010, 2015). Cell nonautonomous feedback loops driven by cell-cell signaling may act to reinforce initially small environ-mental differences along either side of a boundary. At the same time, cell autonomous repression mechanisms would inhibit cells in a particular region from adopting an ectopic fate.
TheRim101-Ime1feedback loop may explain our earlier observation that, as colonies develop, the sporulating region expands from a narrow central band to include the entire top half of the colony. Based on our results, we propose that this expansion is driven by a cycle of intracellular and extracellu-lar events. First, increased extracelluextracellu-lar pH activates the
Rim101/AR pathway. Second, this pathway induces IME1
in the same cell. Third,IME1, by activating sporulation, stim-ulates respiration, and, hence, further increases extracellular pH. Thus the sporulation wave likely reflects a wave of alka-lization. At the same time, increased colony pH reverses the activation ofRlm1in the lower cell layer.
The model presented in Figure 6 can be considered in the context of pattern formation during metazoan development. In both yeast and metazoan pattern formation, undifferenti-ated cells partition into sharply divided regions that adopt mutually exclusive differentiation fates. However, close ho-mologs to highly conserved master regulators of metazoan pattern formation, such as Notch, Wnt, Hedgehog, and bone morphogenic protein, are absent from the fungal genome. Thus, pattern formation likely evolved independently in these two clades. However, some features of the mechanism of pattern formation are similar in yeast colonies as in ani-mals. In particular, a common feature of embryonic pattern-ing models is “lateral induction”; i.e., a differentiating cell induces neighboring cells to adapt the same fate (reviewed in Sjöqvist and Andersson 2017). Lateral induction may be analogous to the nonautonomous Rim101-Ime1andRlm1
-Slt2 feedback loops in yeast colony pattern formation. In-deed, spreading of the meiotic cell fate from the central boundary to the top of the colony is reminiscent of the waves of differentiation that characterize some models of metazoan development (Satoet al.2013; Tateyaet al.2013). In con-trast to the parallels between metazoan lateral induction and nonautonomous positive feedback in yeast, another element of metazoan pattern formation—lateral inhibition—is absent or not yet recognized in colonies. In lateral inhibition, a
differentiated cell inhibits its neighbors from adapting the same fate, allowing the establishment and maintenance of boundaries between cell types (Dahmann et al. 2011; Schweisguth and Corson 2019). In yeast colonies, rather than lateral inhibition, boundaries may instead be enforced by cell-autonomous repression mechanisms that prevent cells from adopting the wrong fate.
The current study illustrates two general caveats regarding genetic analysis in microorganisms. First, alleles may affect distinct subpopulations of a microbial community in different or even opposite ways. Indeed, even suspended cultures contain populations with considerable expression and phe-notypic heterogeneity (Schwabe and Bruggeman 2014; Honigberg 2016; Gasch et al. 2017; Li et al. 2018; Nadal-Ribelleset al.2019). Second, contrary to usual expectations, alleles may affect biological processes in single-cell organ-isms by cell-nonautonomous as well as cell-autonomous mechanisms. As demonstrated in the current study, both of these caveats can be addressed by a combination of cell au-tonomy assays and single-cell or community colocalization assays. In this respect, representing regulatory relationships by adding an “A”(autonomous) or “NA”(nonautonomous) above arrow or bar symbols and also incorporating spatial and/or subpopulation information in the regulatory diagram as in Figure 6 could prove generally useful.
In the CCA, as with any measurement of gene expression in any cell population, increased expression of the response gene could result from increased expression in the same subpopulation and/or equal expression in a larger subpopu-lation. For the response genes used in the current study, positive feedback regulation likely causes these genes to be either fully on or fully off in most cells. Thus, the difference in total response in colony mostly reflects the fraction of cells in the colony that express the gene. Indeed, for all CCA presented in this study, an internal control verifies that doubling the fraction of response cells in a colony doubles the total signal (seeMaterials and Methods).
Because the organization of microorganisms into commu-nities is central to their biological function, these commucommu-nities offer a unique opportunity to investigate fundamental mech-anisms of pattern formation. However, it is important to point out that any cellular process could in principal be regulated by a combination of cell autonomous and nonautonomous mech-anisms. Indeed, it is very likely that many more biological processes are regulated by cell-to-cell signals than currently suspected.
Acknowledgments
This facility is supported by the UMKC Office of Research Services, UMKC Center of Excellence in Dental and Muscu-loskeletal Tissues, and National Institutes of Health (NIH) grants S10RR027668 and S10OD021665. The content of this article is solely the responsibility of the authors and does not necessarily represent the official views of the NIH.
Literature Cited
Allocati, N., M. Masulli, C. Di Ilio, and V. De Laurenzi, 2015 Die for the community: an overview of programmed cell death in bacteria. Cell Death Dis. 6: e1609.https://doi.org/10.1038/cddis.2014.570 Boysen, J. H., and A. P. Mitchell, 2006 Control of Bro1-domain protein Rim20 localization by external pH, ESCRT machinery, and the Saccharomyces cerevisiae Rim101 pathway. Mol. Biol. Cell 17: 1344–1353.https://doi.org/10.1091/mbc.e05-10-0949 Castrejon, F., A. Gomez, M. Sanz, A. Duran, and C. Roncero,
2006 The RIM101 pathway contributes to yeast cell wall as-sembly and its function becomes essential in the absence of mitogen-activated protein kinase Slt2p. Eukaryot. Cell 5: 507– 517.https://doi.org/10.1128/EC.5.3.507-517.2006
Claessen, D., D. E. Rozen, O. P. Kuipers, L. Sogaard-Andersen, and G. P. van Wezel, 2014 Bacterial solutions to multicellularity: a tale of biofilms,filaments and fruiting bodies. Nat. Rev. Micro-biol. 12: 115–124.https://doi.org/10.1038/nrmicro3178 Dahmann, C., A. C. Oates, and M. Brand, 2011 Boundary
forma-tion and maintenance in tissue development. Nat. Rev. Genet. 12: 43–55.https://doi.org/10.1038/nrg2902
Dodou, E., and R. Treisman, 1997 The Saccharomyces cerevisiae MADS-box transcription factor Rlm1 is a target for the Mpk1 mitogen-activated protein kinase pathway. Mol. Cell. Biol. 17: 1848–1859.https://doi.org/10.1128/MCB.17.4.1848
Du, Q., Y. Kawabe, C. Schilde, Z. H. Chen, and P. Schaap, 2015 The evolution of aggregative multicellularity and cell-cell communication in the dictyostelia. J. Mol. Biol. 427: 3722–3733.https://doi.org/10.1016/j.jmb.2015.08.008 Fischbach, M. A., and J. A. Segre, 2016 Signaling in
host-associ-ated microbial communities. Cell 164: 1288–1300. https:// doi.org/10.1016/j.cell.2016.02.037
Frey, A. G., A. J. Bird, M. V. Evans-Galea, E. Blankman, D. R. Winge et al., 2011 Zinc-regulated DNA binding of the yeast Zap1 zinc-responsive activator. PLoS One 6: e22535. https://doi.org/ 10.1371/journal.pone.0022535
García, R., A. B. Sanz, J. M. Rodríguez-Peña, C. Nombela, and J. Arroyo, 2016 Rlm1 mediates positive autoregulatory tran-scriptional feedback that is essential for Slt2-dependent gene expression. J. Cell Sci. 129: 1649–1660.https://doi.org/10.1242/ jcs.180190
Gasch, A. P., F. B. Yu, J. Hose, L. E. Escalante, M. Place et al., 2017 Single-cell RNA sequencing reveals intrinsic and extrinsic regulatory heterogeneity in yeast responding to stress. PLoS Biol. 15: e2004050.https://doi.org/10.1371/journal.pbio.2004050 Gray, M., and S. M. Honigberg, 2001 Effect of chromosomal locus,
GC content and length of homology on PCR-mediated targeted gene replacement in Saccharomyces. Nucleic Acids Res. 29: 5156–5162.https://doi.org/10.1093/nar/29.24.5156
Gray, M., S. Piccirillo, and S. M. Honigberg, 2005 Two-step method for constructing unmarked insertions, deletions and al-lele substitutions in the yeast genome. FEMS Microbiol. Lett. 248: 31–36.https://doi.org/10.1016/j.femsle.2005.05.018 Hayashi, M., K. Ohkuni, and I. Yamashita, 1998 Control of division arrest
and entry into meiosis by extracellular alkalization in Saccharomyces cerevisiae. Yeast 14: 905–913. https://doi.org/10.1002/(SICI)1097-0061(199807)14:10,905::AID-YEA290.3.0.CO;2-1
Honigberg, S. M., 2004 Ime2p and Cdc28p: co-pilots driving mei-otic development. J. Cell. Biochem. 92: 1025–1033. https:// doi.org/10.1002/jcb.20131
Honigberg, S. M., 2011 Cell signals, cell contacts, and the orga-nization of yeast communities. Eukaryot. Cell 10: 466–473. https://doi.org/10.1128/EC.00313-10
Honigberg, S. M., 2016 Similar environments but diverse fates: responses of budding yeast to nutrient deprivation. Microb. Cell 3: 302–328.https://doi.org/10.15698/mic2016.08.516 Honigberg, S. M., and R. H. Lee, 1998 Snf1 kinase connects
nu-tritional pathways controlling meiosis in Saccharomyces cerevi-siae. Mol. Cell. Biol. 18: 4548–4555.https://doi.org/10.1128/ MCB.18.8.4548
Jung, U. S., A. K. Sobering, M. J. Romeo, and D. E. Levin, 2002 Regulation of the yeast Rlm1 transcription factor by the Mpk1 cell wall integrity MAP kinase. Mol. Microbiol. 46: 781–789.https://doi.org/10.1046/j.1365-2958.2002.03198.x Kassir, Y., N. Adir, E. Boger-Nadjar, N. G. Raviv, I. Rubin-Bejerano
et al., 2003 Transcriptional regulation of meiosis in budding yeast. Int. Rev. Cytol. 224: 111–171.https://doi.org/10.1016/ S0074-7696(05)24004-4
Lamb, T. M., W. Xu, A. Diamond, and A. P. Mitchell, 2001 Alkaline response genes of Saccharomyces cerevisiae and their relation-ship to the RIM101 pathway. J. Biol. Chem. 276: 1850–1856 (erratum: J. Biol. Chem 276: 12476).https://doi.org/10.1074/ jbc.M008381200
Lee, R. H., and S. M. Honigberg, 1996 Nutritional regulation of late meiotic events in Saccharomyces cerevisiae through a path-way distinct from initiation. Mol. Cell. Biol. 16: 3222–3232. https://doi.org/10.1128/MCB.16.6.3222
Levin, D. E., 2011 Regulation of cell wall biogenesis in Saccharo-myces cerevisiae: the cell wall integrity signaling pathway. Genetics 189: 1145–1175.https://doi.org/10.1534/genetics.111.128264 Li, S., D. M. Giardina, and M. L. Siegal, 2018 Control of
nonge-netic heterogeneity in growth rate and stress tolerance of Sac-charomyces cerevisiae by cyclic AMP-regulated transcription factors. PLoS Genet. 14: e1007744. https://doi.org/10.1371/ journal.pgen.1007744
Li, W., and A. P. Mitchell, 1997 Proteolytic activation of Rim1p, a positive regulator of yeast sporulation and invasive growth. Ge-netics 145: 63–73.
Maeda, T., 2012 The signaling mechanism of ambient pH sensing and adaptation in yeast and fungi. FEBS J. 279: 1407–1413. https://doi.org/10.1111/j.1742-4658.2012.08548.x
Mitchell, A. P., S. E. Driscoll, and H. E. Smith, 1990 Positive control of sporulation-specific genes by the IME1 and IME2 products in Saccharomyces cerevisiae. Mol. Cell. Biol. 10: 2104–2110.https://doi.org/10.1128/MCB.10.5.2104
Moretto, F., N. E. Wood, G. Kelly, A. Doncic, and F. J. van Werven, 2018 A regulatory circuit of two lncRNAs and a master regu-lator directs cell fate in yeast. Nat. Commun. 9: 780.https:// doi.org/10.1038/s41467-018-03213-z
Nadal-Ribelles, M., S. Islam, W. Wei, P. Latorre, M. Nguyenet al., 2019 Sensitive high-throughput single-cell RNA-seq reveals within-clonal transcript correlations in yeast populations. Nat. Mi-crobiol. 4: 683–692.https://doi.org/10.1038/s41564-018-0346-9 Neiman, A. M., 2011 Sporulation in the budding yeast Saccharo-myces cerevisiae. Genetics 189: 737–765. https://doi.org/ 10.1534/genetics.111.127126
Perrimon, N., C. Pitsouli, and B. Z. Shilo, 2012 Signaling mecha-nisms controlling cell fate and embryonic patterning. Cold Spring Harb. Perspect. Biol. 4: a005975.https://doi.org/10.1101/ cshperspect.a005975
Piccirillo, S., M. G. White, J. C. Murphy, D. J. Law, and S. M. Honigberg, 2010 The Rim101p/PacC pathway and alkaline pH regulate pat-tern formation in yeast colonies. Genetics 184: 707–716.https:// doi.org/10.1534/genetics.109.113480
Piccirillo, S., R. Morales, M. G. White, K. Smith, T. Kapros et al., 2015 Cell differentiation and spatial organization in yeast col-onies: role of cell-wall integrity pathway. Genetics 201: 1427– 1438.https://doi.org/10.1534/genetics.115.180919
Piccirillo, S., D. Neog, D. Spade, J. D. Van Horn, L. M. Tiede-Lewis et al., 2017 Shrinking daughters: Rlm1-dependent G1/S check-point maintains Saccharomyces cerevisiae daughter cell size and viability. Genetics 206: 1923–1938.https://doi.org/10.1534/genetics. 117.204206
Rose, M. D., F. Winston, and P. Hieter, 1990 Methods in Yeast Genetics: A Laboratory Course Manual. Cold Spring Harbor Lab-oratory Press, Cold Spring Harbor, NY.
Sanz, A. B., R. Garcia, J. M. Rodriguez-Pena, and J. Arroyo, 2017 The CWI pathway: regulation of the transcriptional adaptive response to cell wall stress in yeast. J. Fungi (Basel) 4: PMC5872304.https://doi.org/10.3390/jof4010001 Sato, M., T. Suzuki, and Y. Nakai, 2013 Waves of differentiation
in thefly visual system. Dev. Biol. 380: 1–11.https://doi.org/ 10.1016/j.ydbio.2013.04.007
Schwabe, A., and F. J. Bruggeman, 2014 Single yeast cells vary in transcription activity not in delay time after a metabolic shift. Nat. Commun. 5: 4798.https://doi.org/10.1038/ncomms5798 Schweisguth, F., and F. Corson, 2019 Self-organization in pattern formation. Dev. Cell 49: 659–677. https://doi.org/10.1016/ j.devcel.2019.05.019
Serra-Cardona, A., D. Canadell, and J. Arino, 2015 Coordinate responses to alkaline pH stress in budding yeast. Microb. Cell 2: 182–196.https://doi.org/10.15698/mic2015.06.205 Shank, E. A., and R. Kolter, 2011 Extracellular signaling and
mul-ticellularity in Bacillus subtilis. Curr. Opin. Microbiol. 14: 741– 747.https://doi.org/10.1016/j.mib.2011.09.016
Shefer-Vaida, M., A. Sherman, T. Ashkenazi, K. Robzyk, and Y. Kassir, 1995 Positive and negative feedback loops affect the transcription of IME1, a positive regulator of meiosis in Saccha-romyces cerevisiae. Dev. Genet. 16: 219–228.https://doi.org/ 10.1002/dvg.1020160302
Sjöqvist, M., and E. R. Andersson, 2017 Do as I say, Not(ch) as I do: lateral control of cell fate. Dev. Biol. 447: 58–70.https:// doi.org/10.1016/j.ydbio.2017.09.032
Tateya, T., I. Imayoshi, I. Tateya, K. Hamaguchi, H. Torii et al., 2013 Hedgehog signaling regulates prosensory cell properties during the basal-to-apical wave of hair cell differentiation in the mammalian cochlea. Development 140: 3848–3857. https:// doi.org/10.1242/dev.095398
Thevenaz, P., U. E. Ruttimann, and M. Unser, 1998 A pyramid approach to subpixel registration based on intensity. IEEE Trans. Image Process. 7: 27–41.https://doi.org/10.1109/83.650848 Váchová, L., and Z. Palková, 2018 How structured yeast
multicel-lular communities live, age and die? FEMS Yeast Res. 18. https://doi.org/10.1093/femsyr/foy033
van Gestel, J., H. Vlamakis, and R. Kolter, 2015 Division of labor in biofilms: the ecology of cell differentiation. Microbiol. Spectr. 3: MB-0002-2014. https://doi.org/10.1128/microbiolspec.MB-0002-2014
Watanabe, Y., G. Takaesu, M. Hagiwara, K. Irie, and K. Matsumoto, 1997 Characterization of a serum response factor-like protein in Saccharomyces cerevisiae, Rlm1, which has transcriptional activity regulated by the Mpk1 (Slt2) mitogen-activated protein kinase pathway. Mol. Cell. Biol. 17: 2615–2623.https://doi.org/ 10.1128/MCB.17.5.2615
Zhao, H., Q. Wang, C. Liu, Y. Shang, F. Wenet al., 2018 A role for the respiratory chain in regulating meiosis initiation in Saccha-romyces cerevisiae. Genetics 208: 1181–1194.https://doi.org/ 10.1534/genetics.118.300689