ABSTRACT
SYED, RAZA ABBAS. Investigating Intermittent Software Failures. (Under the direction of Dr. Laurie Williams).
Intermittent software failures and nondeterministic behavior complicate and compromise the effectiveness of software testing processes. Software engineers spend a significant amount of time attempting to reproduce such intermittent and non-reproducible software failures, but often are unable to do so and instead close the failure as “Not Repeatable” or “Not Reproducible”. Whether such failures are detected during internal testing or by customers in the field, they represent a need for the development of versatile testing strategies that minimize non-deterministic behavior in software systems.
We found that decreasing processor speed and increasing processor load had a statistically significant relationship with frequency of occurrence of intermittent failures. Also, using metrics such as number of comments and failure resolution time, we found that software engineers spent significantly more time debugging intermittent failures than reproducible failures. Finally, we demonstrate that metrics extracted from failure reports and metrics based on natural language processing techniques can be used to predict that a failure may be intermittent at the time the failure is reported. Our prediction models were able to correctly predict more than 60% of failure reports as being intermittent.
Investigating Intermittent Software Failures
by
Raza Abbas Syed
A thesis submitted to the Graduate Faculty of North Carolina State University
in partial fulfillment of the requirements for the degree of
Master of Science
Computer Science
Raleigh, North Carolina 2011
APPROVED BY:
_______________________________ ______________________________
Dr. Laurie Williams Dr. Tao Xie
Committee Chair
DEDICATION
To the City of Knowledge, and it’s Gate.
BIOGRAPHY
ACKNOWLEDGMENTS
First and foremost, I would like to thank Laurie for being the best advisor ever; for putting up with me for two years; for her guidance, and showing me my path forward. I really couldn’t have asked for a nicer, more understanding advisor.
Thank you to Brian Robinson at ABB for being incredibly helpful on my research, and for being patient when things weren’t going so well. It was a pleasure working at ABB over the summer of 2009 and 2010. For that, I would like to thank the entire ISS team -- Andy, Pat, Will, Mithun, Vinay, and Xiao. Thanks for all your help guys.
Thank you to the entire Realsearch group – Andy, Ben, Yonghee, John, Pat, Sarah, Mei, Andrew, and Jerrod. It was a great experience working alongside such smart people. Our reading groups taught me the importance of peer review and getting feedback on one’s work, not just in academia, but on a more general level.
Thanks to Aapi (my sister) for those home-cooked meals. Thanks to Haider bhai (my brother-in-law) for helping me get settled in a new country and for countless other things over the last three years. You guys are incredibly generous, and I love you.
Thank you to my fellow Pakistani friends at NC State – Sajeel, Ahmer, Maqbool, Asim, Fakeha, Qasim, Zohaib, Imran, Sadaf, Kashif, Aown, and Easa. Thanks for keeping me sane all this time at grad school.
This work was sponsored by ABB Corporate Research.
Some of the work in this thesis incorporates material from the following conference publication, which is copyright of IEEE © 2010:
TABLE OF CONTENTS
LIST OF TABLES ... ix
LIST OF FIGURES ... x
1. INTRODUCTION ... 1
2. BACKGROUND ... 5
2.1 Prevalence of Intermittent Behavior ... 5
2.1.1 iPhone Alarm Faults ... 5
2.1.2 Therac-25 Accidents ... 6
2.2 Types of Intermittent Behavior ... 6
2.2.1 Configuration-dependent failures ... 7
2.2.2 Unanticipated conditions ... 8
2.3 How do modern-day software organizations deal with intermittence? ... 9
2.3.1 Deterministic Replay Debugging ... 9
2.3.2 Fuzz-testing ... 9
2.3.3 High Volume Test Automation ... 10
2.3.4 Load testing ... 10
2.3.5 Disturbance Tests ... 11
2.4 Repeatability of Classification Scheme... 11
3. RELATED WORK ... 14
4. EFFECTS OF HARDWARE CONFIGURATION ON OCCURRENCE OF INTERMITTENT FAILURES ... 20
4.1 Empirical Study ... 20
4.1.1 Step One: Identify Intermittent Failures ... 21
4.1.2 Step Two: Determine Hardware Configurations ... 22
4.1.3 Step Three: Hardware Configuration Testing ... 24
4.1.4 Step Four: Processor Load Testing ... 25
4.1.5 Establishing a Baseline ... 26
4.1.6 Observability Data Collection and Tools ... 26
4.1.7 Threats to Validity ... 27
4.2 Selected Failures ... 28
4.3.1 Hardware Configuration Study ... 32
4.3.2 Processor Load Generation Study ... 38
4.4 Baseline Failure Analysis ... 44
4.5 Conclusions ... 45
4.5.1 Is the observability of a software fault impacted by processor speed? If so, how? 45 4.5.2 Is the observability of a software fault impacted by the amount of memory? If so, how? ... 46
4.5.3 Is the observability of a software fault impacted by the size of the hard drive? If so, how? ... 46
4.5.4 Is the observability of a software fault impacted by processor load? If so, how? 46 5. CLASSIFICATION OF INTERMITTENT FAILURES ... 47
5.1 Study... 47
5.1.1 Systems Under Test ... 48
5.1.2 Data Collection ... 49
5.1.3 Classification Methodology ... 50
5.2 Classification of Intermittent Failures ... 52
5.2.1 Industrial System: ABB ... 57
5.2.2 Open Source System: Mozilla Firefox ... 58
5.2.3 Repeatability of Classification Scheme ... 59
5.3 Attributes of Intermittent Failures ... 61
5.3.1 Repeatability of Assigned Attributes ... 64
5.4 Additional Observations ... 67
5.5 Limitations and Threats to Validity ... 68
5.6 Conclusion ... 69
6. EFFORT SPENT DEBUGGING INTERMITTENT FAILURES ... 71
6.1 Study... 71
6.1.1 Data Collection ... 72
6.2 Number of Comments ... 73
6.3 Failure Resolution Time ... 75
6.4 Length of Failure Reports ... 77
6.6 Additional Observations ... 80
6.7 Summary ... 80
6.8 Limitations ... 81
7. PREDICTION OF INTERMITTENT FAILURES ... 82
7.1 Prediction Modeling ... 83
7.1.1 Modeling Techniques... 84
7.1.2 Natural Language Processing Techniques ... 84
7.2 Results ... 85
7.2.1 Industrial System: ABB ... 86
7.2.2 Open Source System: Mozilla Firefox ... 89
7.3 Limitations ... 91
7.4 Conclusions ... 91
8. CONCLUSION AND RECOMMENDATIONS ... 93
8.1 Identifying Intermittent Failures ... 93
8.2 Increasing reproducibility of intermittent failures ... 94
9. REFERENCES ... 98
APPENDICES ... 105
Appendix A. Common Words Identified by NLP Techniques ... 106
A.1 ABB ... 106
LIST OF TABLES
Table 1. Example Rater Classifications ... 12
Table 2. Levels of Independent Variables Used In Our Study ... 23
Table 3. Hardware Configurations Used In Our Study... 25
Table 4. Hardware Configurations Used In Processor Load Study ... 26
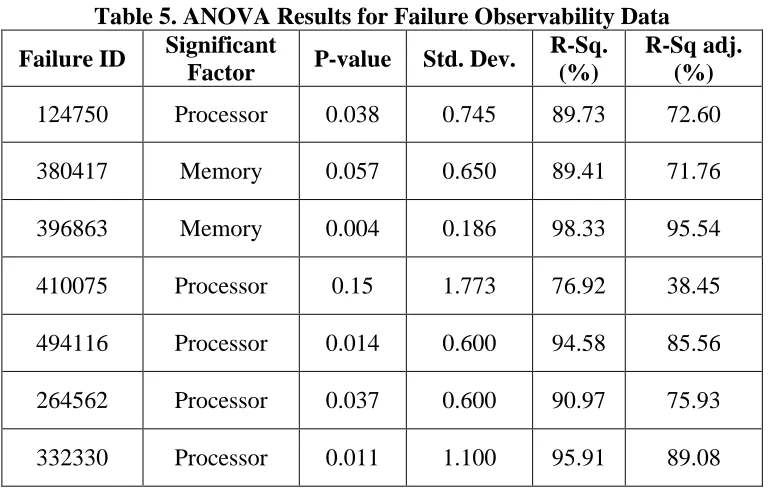
Table 5. ANOVA Results for Failure Observability Data ... 33
Table 6. ANOVA Results for Failure Observability Data Using Load Generation ... 39
Table 7. Rater classifications for intermittent failures of industrial and open source system 60 Table 8. Rater classifications for attributes of intermittent failures of industrial and open source system ... 66
Table 9. Results summarizing estimation of effort spent debugging failures in industrial system ... 75
Table 10. Results summarizing estimation of effort spent debugging failures in the open source system ... 76
Table 11. Performance of prediction model for industrial system... 87
Table 12. Performance of prediction model for industrial system (with common word occurrences) ... 88
Table 13. Performance of prediction model for open source system ... 89
LIST OF FIGURES
Figure 1. Observed frequency of failure # 124750 ... 33
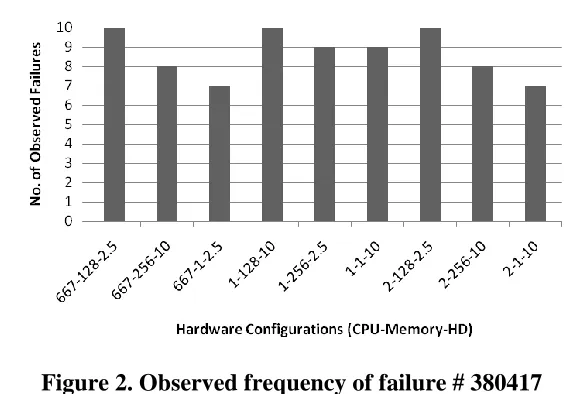
Figure 2. Observed frequency of failure # 380417 ... 34
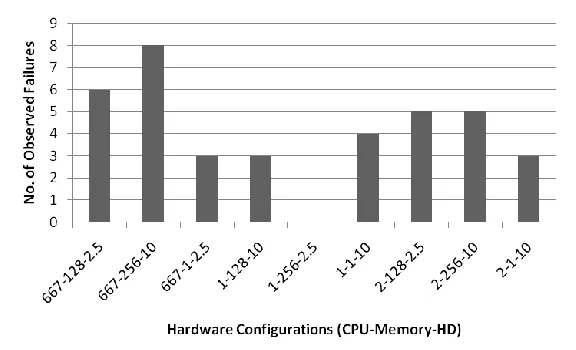
Figure 3. Observed frequency for failure # 396863 ... 35
Figure 4. Observed frequency for failure # 410075 ... 35
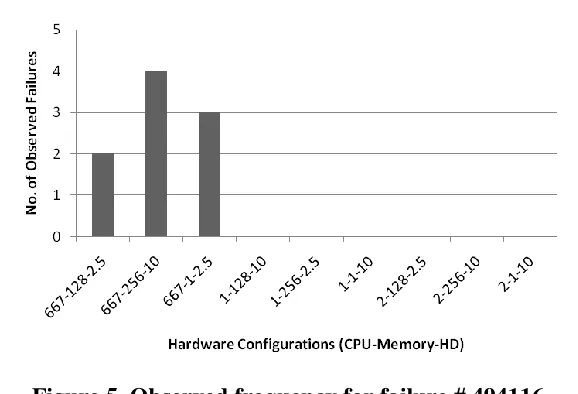
Figure 5. Observed frequency for failure # 494116 ... 36
Figure 6. Observed frequency for failure # 264562 ... 37
Figure 7. Observed frequency for failure # 332330 ... 37
Figure 8. Observed frequency of failure # 124750 under simulated processor load ... 39
Figure 9. Observed frequency of failure # 264562 under simulated processor load ... 40
Figure 10. Observed frequency of failure # 332330 under simulated processor load ... 41
Figure 11. Observed frequency of failure # 380417 under simulated processor load ... 42
Figure 12. Observed frequency of failure # 396863 under simulated processor load ... 42
Figure 13. Observed frequency of failure # 410075 under simulated processor load ... 43
Figure 14. Observed frequency of failure # 494116 under simulated processor load ... 44
Figure 15. Distribution of failure statuses in the ABB system ... 48
Figure 16. Distribution of classified intermittent failure reports for the ABB system ... 57
Figure 17. Distribution of classified intermittent failure reports for Mozilla Firefox ... 58
Figure 18. Distribution of attributes of intermittent failure reports for the ABB system ... 64
Figure 19. Distribution of attributes of intermittent failure reports for Mozilla Firefox ... 64
Figure 20. Distribution of number of comments for intermittent failure reports for ABB system ... 73
Figure 21. Distribution of number of comments for previously intermittent failure reports for ABB system ... 74
Figure 22. Distribution of percentages of severity for failure groups in ABB system ... 79
Investigating Intermittent Failures in Software Systems
1.
INTRODUCTION
Software maintenance accounts for more than 65% of all costs incurred in the lifecycle of software development [1]. A major component of this cost is debugging and fixing faults1. Faults may escape to the field as a result of the difficulty in software systems adequately before release. A significant amount of software testing research has focused on improving software testing, leading to techniques and tools that aid software engineers in exposing faults. In recent years, advances have been made in test case generation [3], [4], model-based testing [5], regression test selection [6], and graphical user interface (GUI) testing [7]. However, intermittent failures and nondeterministic behavior continue to complicate and compromise the effectiveness of software testing despite advancements in these testing techniques.
According to a study by National Institute of Standards and Technology (NIST), software failures that arise as a result of inadequate testing infrastructure cost the US economy as much as $59.5 billion annually [8]. With software’s increasing complexity, debugging and fixing failures is an increasingly challenging task for developers and testers, especially due to tight deadlines in today’s competitive market. Among the most challenging failures for testers are those that are intermittent i.e., those that cannot be reliably reproduced.
Software testers and developers spend a significant amount of time debugging programs due to intermittent failures, and often make no quality-improving change to the code.
1
Software testing and maintenance processes are adversely affected by failures that are hard to reproduce. Such intermittent failures, although investigated in great depth, are often closed as being “Not Repeatable” with no fault fixed. Whether such failures are detected during internal testing or by customers in the field, they represent a need for a versatile testing strategy that minimizes non-deterministic behavior in software that may lead to intermittent failures.
The goal of this research is to help software engineers understand the characteristics
of intermittent behavior in software systems, and to aid in developing efficient techniques
for detecting and fixing such failures.
The Toyota Prius “unintended acceleration” software fault2
is an example of the implications of potentially dangerous intermittent software failures. Toyota was forced to recall 133,000 vehicles in the US because one intermittent software fault escaped to the field, and was not detected until some customers complained of the car's strange acceleration problem. This incident demonstrates a need for the development of adequate techniques for detecting intermittent failures, given how software has now permeated such safety-critical systems as cars and airplanes [9].
Another example is that of the Mars Pathfinder mission. In an article on LATimes.com3, David Cummings describes how a simple test on the Pathfinder software failed: the test case asserted the result of a computation, which was always expected to be even. The test case passed for thousands of test runs, except once. Further investigation revealed a fault in the
2 http://pressroom.toyota.com/pr/tms/faqs-about-prius-recall-153624.aspx 3
operating system's interrupt-handling routine that had triggered at just the right time (down to the exact microsecond) and had caused the operating system to “misremember” the carry on the previously-executed arithmetic operation. Such a subtle yet significant fault could have resulted in a catastrophic failure to the Pathfinder mission en route to Mars that was fortunately avoided in this case.
In software failure repositories, particularly the ones we studied, we observe that intermittent failure reports are often closed by testers due to lack of reproducibility of the failure. As a result, a significant investment of effort spent by testers goes to waste because often no quality-improving change is made to the code through fault fixing. Such wasted effort can compromise the effectiveness of the entire product testing effort, and needs to be minimized. Another important factor that affects this cost is whether such failures are discovered during internal testing or by customers in the field. Post-release failures cost more, since testers often have to travel to the customer site to investigate conditions that lead to the failure. With the increasing complexity of software, this trend in their maintenance costs is expected to continue to rise exponentially.
To summarize, this research makes the following contributions:
- Shows the significance of hardware configuration factors (such as processor speed, processor load, and memory) in detecting intermittent failures
- Proposes a classification scheme for intermittent failures to aid in improvement of software processes in an organization
- Provides a list of common attributes of intermittent failures to aid in identification of common patterns, symptoms, and pre-conditions of intermittent failures
- Provides empirical evidence that developers spend more effort in debugging intermittent failures than reproducible failures; and finally,
- Presents a prediction model for intermittent failures based on metrics extracted from failure reports
2.
BACKGROUND
The term “intermittent” is defined as:
“occurring occasionally or at regular or irregular intervals”4
In terms of software engineering, and particularly software testing, this term refers to failures that occur randomly and cannot be reliably reproduced. Often there are no obvious causes for intermittent behavior in software systems, and this behavior is generally marked as “non-reproducible” or “not repeatable” by software engineers. Practitioners have used the terms intermittent, non-reproducible, and not-repeatable to refer to failures that cannot be reliably reproduced. In this document, we use the term intermittent to refer to such behavior.
2.1
Prevalence of Intermittent Behavior
Intermittent behavior in software systems is highly prevalent [10]. The famous Therac-25 accidents are well-known5. In this section, we provide some more recent examples of intermittent failures disrupting everyday software systems.
2.1.1
iPhone Alarm Faults
In November 2010, users of Apple’s phone, iPhone 4, complained that their alarms went off an hour late immediately the day after Daylight Saving Time had come into effect. The fault was in the phone software’s alarm application and was triggered only when users set repeating alarms on their phones to go off on certain days of the week. More recently,
4 http://dictionary.reference.com/browse/intermittent 5
another fault in the phone’s software caused non-repeating alarms to not go off on New Year’s Day6
. Finally most recently, users of iPhone’s operating system iOS 4.1 (including the author) complained that their alarms went off an hour early the day after Daylight Saving Time had come into effect7 in Spring 2011.
2.1.2
Therac-25 Accidents
Therac-25 was a radiation therapy machine involved in at least six accidents from 1985 to 19878. Therac-25 inflicted patients with massive radiation overdose due to faulty software. Investigation of the accidents revealed bad coding practices, inadequate testing, lack of documentation, and no hardware locks allowed for race conditions in the machine’s software modules resulting in delivering 100 times the intended dose. The failure was dependent on timing of operator actions, and was never detected during testing since operators at that time were not very familiar with the machine.
2.2
Types of Intermittent Behavior
There are two major types of intermittent behavior we witness in software systems. a) Failures that occur only on certain configurations (hardware or software) b) Failures that occur in unanticipated conditions
6 http://www.nytimes.com/2011/01/03/technology/03iphone.html
7 http://www.slashgear.com/did-your-iphone-4-alarm-work-correctly-this-morning-14139740/
8
2.2.1
Configuration-dependent failures
Anomalous behavior in software systems is sometimes exposed on only specific hardware or software configurations that were not part of the testing phases of the software. Users of a software system may have hardware configurations ranging from very old systems to state of the art systems with multi-core processing units, large amounts of memory and hard drive. The total number of combinations for just these factors is huge. Moreover, the software system itself has an extremely large configuration space. For example, for Microsoft Internet Explorer9 Version 6 that shipped with Windows XP, the security tab under options alone had 31 different configurable options. Of these, 10 were binary, 19 had three levels, and two had four levels of settings. As a result, there were 210 x 319 x 42 = 19,042,491,875,328 total configurations for this tab alone. This demonstrates the vastness of the configuration space of a typical software system in use today.
Testing a software system across all possible configurations of hardware and software is obviously impossible. The term configuration testing refers to testing software system across different configurations, which usually includes the major operating systems in use along with both slow and advanced hardware. For example, for Firefox version 1.5.0.2 the Mozilla team10 designed configuration tests on Windows XP, Mac OS 10.3 and 10.4, and Linux Fedora Core 4.
To reduce configuration space, concepts such as pairwise testing can be adopted. Pairwise testing is a combinatorial testing technique that operates on the principle that most
9 http://www.microsoft.com/ie/ 10
faults are caused by interactions between two factors of a system [11]. Testing pairwise combinations of factors, therefore, generates a much smaller testable configuration space compared to an exhaustive technique that covers all possible combinations of factors. Testing for more than two-way combinations of factors becomes progressively expensive given the complex nature of software systems in use today [12].
2.2.2
Unanticipated conditions
Sometimes intermittent failures are observed in software systems when they run into unanticipated input or end up in an abnormal state resulting from an occurrence of an unlikely event or input. We, therefore, observe that software systems often malfunction when met with unforeseen and unanticipated conditions. For example, a real-time system designed to receive input A followed by input B after a certain time interval may malfunction when it receives input B twice or not at all in the specified time interval. There are instances where such faults may not be immediately observable or they manifest as different failures. Debugging such failures can be extremely challenging as testers often have to conduct root-cause analysis to find out where the fault originally occurred in the code. Additionally, there are instances where software simply does not scale well and thus causes intermittent failures11.
11
2.3
How do modern-day software organizations deal with
intermittence?
A number of techniques are employed by software engineers nowadays to detect intermittent failures in their software systems.
2.3.1
Deterministic Replay Debugging
Deterministic replay debugging is the ability to record a program’s execution up to the minute it crashes, so that it can be deterministically replayed at a later point in time and a root cause of the crash can be identified. Tools such as the BugNet [13] help record every instruction executed by the program so that it can be exactly replayed up to the last second before a crash occurred. This solution has proven to be more useful than collecting and analyzing core dumps12,13.
2.3.2
Fuzz-testing
Fuzz-testing is useful form of black-box testing technique for finding and fixing intermittent faults in software systems. Fuzz-testing or simply “fuzzing” involves providing a system with random, invalid, and unexpected data. This technique helps test whether a software system degrades gracefully or not. Tools such as jsfunfuzz14, a JavaScript fuzzer for
12 “Online Crash Analysis,” http://oca.microsoft.com/en/dcp20.asp.
13 http://support.mozilla.com/en-US/kb/Mozilla%20Crash%20Reporter
14
Firefox, have helped uncover faults that could not uncovered using traditional testing techniques15.
Fuzzing programs can either be mutation-based or generation-based. Mutation-based fuzzers mutate existing test input data to create new test data whereas generation-based fuzzers create new test input data based on models of the input [14]. Fuzz-testing is most useful in detecting failures related to data corruption, memory leaks, assertions, and crashes. Fuzzers must also record all data they create to produce test cases once faults are found in the code.
2.3.3
High Volume Test Automation
High Volume Test Automation (HVTA) is a broad class of testing techniques [15]. HVTA involves automated execution of a large number of test cases for finding intermittent and non-reproducible failures in software systems. HVTA techniques have shown to be particularly useful in finding failures such as buffer overruns, stack overflows, resource exhaustion, and timing-related errors. One example of HVTA tests is extended random regression tests (ERRT) [15]. ERRT involves running regression tests in random order until the software under test fails. These techniques augment conventional testing techniques by finding faults that are otherwise hard to find and reproduce.
2.3.4
Load testing
Load tests test a software system when it is operating at its defined limits. Load tests include volume and stress tests [16].
15
Volume tests test the ability of a program to operate normally when given large tasks to perform. For example, word processing software might be provided a constant stream of documents that are large in size.
Stress tests attempt to determine the maximum limit at which the program breaks. Ideally, this limit is well beyond the specified limit for the program under test. For example, a web server can be stress-tested by simulating a very high visitor load using bots and scripts.
2.3.5
Disturbance Tests
Some organizations employ disturbance tests to test the overall quality and fault-tolerance of a software system. Disturbance tests are defined as tests that disrupt normal operation of the application such as switching off network connection, unplugging the power cord, simulating some other physical failure etc. The anomalous behavior of the software seen as a result of some of the disturbance tests is generally very hard to reproduce, since it requires an intricate set of events to occur at specific time intervals (as discussed in Section 2.2.2).
2.4
Repeatability of Classification Scheme
(Section 5). Such classifications need to be repeatable [19]. Several agreement coefficients have been proposed in literature for measuring inter-rater reliability such as Cohen’s kappa (κ) [20], Scott’s pi (π) [21], and intra-class coefficient [22]. Of these Cohen’s kappa is the most extensively used statistical measure [19]. Cohen’s kappa statistic measures agreement between two raters only. Several modifications such as weighted-kappa [23], kappa maximum [24], and Fleiss’s kappa (for more than two raters) [25] have been proposed, but Cohen’s kappa remains the most widespread in use with more than 11,400 citations to date16
. Cohen’s kappa measures agreement between two raters who each classify N items into C mutually exclusive categories. Cohen’s kappa is defined as follows:
where Pr(a) is the probability of agreement between raters, and Pr(e) is the probability of agreement among raters by chance. If there is complete agreement between raters, then κ=1, and if there’s complete disagreement between the raters, then κ=0.
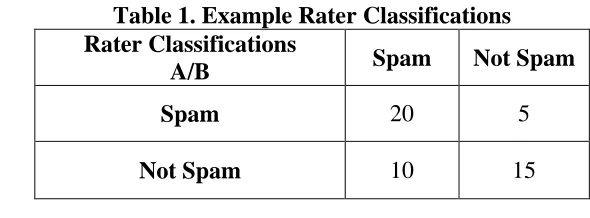
As an example, consider two raters classified 50 emails as spam or not spam. Suppose the raters classified the emails as shown in Table 1 below. Rater A’s classifications are represented as rows, and rater B’s classifications are represented as columns.
Table 1. Example Rater Classifications Rater Classifications
A/B Spam Not Spam
Spam 20 5
Not Spam 10 15
16
For this example, probability of agreement, Pr(a), is (20+15)/50 = 0.7. To calculate probability of agreement by chance, Pr(e), consider that:
Rater A classified 25 emails as spam, and 25 emails as not spam. Therefore, probability of rater A classifying an email as spam or not spam is 0.5.
Rater B classified 30 emails as spam, and 20 emails as not spam. Therefore, the probability of rater B classifying an email as spam is 30/50=0.6, and the probability of rater B classifying an email as not spam is 20/50=0.4.
Therefore, the probability that both raters A and B classified an email as spam is 0.5*0.6=0.3. Similarly, the probability that both raters classified an email as not spam is 0.5*0.4=0.2. Thus, the overall probability of agreement by chance will be 0.3+0.2=0.5. If we apply our formula for Cohen’s kappa, we would get κ = (0.7-0.5) / (1-0.5) = 0.40.
3.
RELATED WORK
Several studies have appeared in literature concerning nondeterminism [27], [28] as well as observation-based testing [29-31], but there are few existing studies that have established a correlation between the observability of faults in software and its base hardware. White et al. [32] presented one empirical study carried out on RealPlayer. Their work involved testing RealPlayer on hardware running on different processor speeds, memory, and operating systems. They observed that RealPlayer behaved differently on different configurations, particularly in the way that it failed. They also detected an increased trend of faults with decreasing processor speed and memory. Our study on hardware configurations (discussed in Section 4) builds on their work using a more rigorous experimental design. In addition, they had no access to the underlying code, which limited their ability to study and understand the intermittent nature of the failures.
Duarte et al. [33] present a framework, GridUnit, for testing distributed applications on a grid of multiple heterogeneous environments simultaneously. Their results show that carrying out such tests increases the proof of correctness of software under test by achieving greater environmental coverage for their test suites in a singular or small number of environments. While not completely similar to our research, their work on testing on different environment confirms an important assertion that testing in one environment is not sufficient for verifying that the software executes correctly.
They have shown that large software configuration spaces need to be sampled using appropriate combinatorial testing techniques (such as n-way testing). Findings from their case study suggest that combinatorial testing techniques help find configuration-dependent faults, and also increase the overall fault-detection capability of individual test cases.
Combinatorial testing techniques have been extensively advocated in literature for increasing the efficiency of the testing phase by achieving high code coverage while utilizing significantly fewer test cases [35-38]. Kuhn et al. in [39], [40] found that combinatorial testing is effective for testing software such as Mozilla Firefox. In addition, they found that that 75% of failures in Firefox were dependent on the interaction of two or more software configuration parameters. Our work uses combinatorial testing techniques to assess the impact of hardware configuration and environment factors on the observability of intermittent faults.
Porter et al. [41] present a framework for distributed testing of applications called Skoll. The Skoll system focuses on systems with large configuration spaces and distributes testing tasks to user communities worldwide in an effort to use greater computing resources and reduce testing time. They found that their distributed effort found faults sooner than traditional non-distributed techniques. Yilmaz et al. [42] found that using covering arrays to select a subset of configuration space for fault characterization allowed for much greater scalability of the Skoll framework.
eliminating nondeterminism in concurrent programs. CHESS explores thread schedules of programs under test in a deterministic manner and uses model-checking techniques to expose any discrepancies in terms of interleaving of events or race conditions. While not directly related to our work, it represents one of the recent research studies undertaken in the area of concurrency testing and intermittent failures.
Artzi et al. [45] developed a tool called Recrash that stores copies of methods-under-execution in memory. When the target program crashes, Recrash generates unit test cases based on the method arguments stored in memory. Using a Java implementation of their approach, called RecrashJ, they have evaluated the tool with real crashes from applications such as Eclipsec, SVNKit, among others. Recrash aims to reduce the amount of time spent by developers in reproducing failures, and according to the authors can also be adopted to work with non-crashing faults and errors.
Another tool, Krash, was developed by Perarnau et al. [46]. Krash supports the findings of our hardware configuration study (discussed in Section 4) that CPU load generation leads to higher occurrence of software failures in many cases. The tool itself can record and reproduce “dynamic load profiles” for multi-core machines. Their methodology cooperates with the system scheduler to ensure that a load profile is accurately replayed once it has been recorded. Krash is particularly helpful for parallel application developers who want to test for concurrency issues with their application.
were not reproduced after significant effort from the testers, but using evolutionary testing techniques enabled them to discover new test scenarios that helped reproduce those failures. The authors, however, admit that there are a number of hurdles and future work is needed before their approach can be fully adopted by the software industry.
Memory leaks are one of the sources of intermittent behavior in software systems. Bond et al. [48] describe their approach towards tolerating memory leaks in software systems. Their leak tolerance approach, called Melt, seeks to reduce performance degradations of the target application in the event of memory leak. Melt transfers portions of memory it deems as “likely leaked” to physical disk (analogous to operating system paging operation), thus delaying memory exhaustion, and in turn, a program crash. This approach is meant to give developers more time in identifying the memory leak and fixing it.
A problem that falls under the class of intermittent failures is software hangs i.e., when a software system goes unresponsive. Wang et al. [49] developed a tool, HangWiz, as part of their research into such software hangs. HangWiz requires hang patterns from runtime traces of the target application, which is then used to find places in the source that make blocking calls i.e., potential hang points. They evaluated their tool on several real-world large software systems, and found several “hang bugs” in those systems.
that similar to intermittent failure reports, “Not a Problem” failure reports also cost the company significant resources, as each report had to be investigated thoroughly, especially if the report was filed by a customer.
An interesting study revolving around automated extraction of information from failure repositories was published by Aranda et al. [51]. The authors asserted that histories of even simple failures are strongly dependent on social, organizational, and technical knowledge that cannot be extracted via any automated process. Their study analyzed failure reports to identify coordination patterns among team members that were validated through a survey of software professionals.
Investigating intermittent field failures in software systems is heavily reliant on the amount of information available pertaining to the failure. Therefore, the important and quality of failure reports cannot be overemphasized. Zimmerman et al. [52] conducted a survey amongst users and developers of Apache, Mozilla, and Eclipse to gain a better understanding of what the developers look for in failure reports, and what the users can provide with ease. They present their findings as recommendations on how best to design failure tracking system so that they are easy to use and yet provide the crucial information required by developers and testers in debugging a failure.
Nagappan et al. [54] analyzed five projects at Microsoft and evaluated several code complexity metrics as predictors of post-release failures. They performed cross-project analysis and found that there were no metrics that predicted failures universally across all projects. Therefore, they concluded that predictive factors are accurate when they are obtained and applied to the same project. Similarly, we extracted common word occurrences from intermittent failure reports and found that very few words overlapped across our two datasets. Therefore, our prediction models for both systems were significantly different.
Panjer [55] demonstrated that by mining change history of failures from a large open source software repository, one can predict failure lifetimes. The proposed models accurately predicted lifetimes for 34.9% failures. An extension of this study was performed on FreeBSD by Bougie et al. [56]. Their models were able to predict 19.49% of failure lifetimes accurately. Our prediction models based solely on failure report attributes had similar levels of accuracy, which we were later able to improve by incorporating common word occurrences in our models.
4.
EFFECTS OF HARDWARE CONFIGURATION ON
OCCURRENCE OF INTERMITTENT FAILURES
Our preliminary study on intermittent behavior in software systems explored the effect of hardware configurations on the observability of such failures. We define the term “observability“ as the number of times the intermittent fault propagated to the fore, and was thus “observed” as an error or a failure by the user. To increase the observability of software faults, we explore the effect hardware configurations and processor load have on intermittent failures and the nondeterministic behavior of software systems. We conducted two case studies of a set of reported intermittent Mozilla Firefox failures. Ten times per failure, we replicated the conditions that caused the reported failures on nine hardware configurations running Windows XP Service Pack 3 and measured the frequency with which the failure was observed. We also replicated the failure conditions ten times with four different processor loads (0%, 25%, 50%, and 75%).
4.1
Empirical Study
The goal of this study was to improve the observability of software faults by exploring the impact hardware configuration has on intermittent failures and the nondeterministic behavior of software systems. Therefore, the research questions of interest to us are:
RQ3: Is the observability of a software fault impacted by the capacity of the hard drive? If so, how?
RQ4: Is the observability of a software fault impacted by processor load? If so, how? We address these research questions through a study of selected set of failures from a large open-source application, Mozilla Firefox17. Firefox was chosen because it is an active open-source project with a large repository of failures online, many of which have traceability to the code change that were made to fix the underlying faults. The rest of this section describes our procedures for selection of failures, study setup, observed measures, and threats to validity.
4.1.1
Step One: Identify Intermittent Failures
Our first step was to collect a set of reported failures with indications that these failures were intermittent and/or non-reproducible. We ran natural language queries on Mozilla's online repository of failures, Bugzilla18. We did not restrict our search to any particular version of Firefox. Additionally, no failures related to plug-ins or add-ons were considered, as these represent another factor of configuration outside the scope of this study. The search was, therefore, restricted to Firefox's core codebase. We analyzed hundreds of failure reports returned from our searches, and found 75 failures that matched our criteria. The natural language queries used variations on the keywords such as "timing", "page file", "operating system", "system dependent", "race condition", "deadlock", "concurrency", "pentium", "older machines", and "slow computers".
17 http://www.mozilla.com/en-US/firefox/ 18
Once we felt we had gathered a substantial number of intermittent failures, we attempted to reproduce each failure ten times on a machine running Windows XP. The machine used for testing failures had the same specification as reported on Bugzilla. In addition to being able to reproduce a particular failure, we also considered its present status on Bugzilla, which told us whether the failure had been fixed or not. From our initial set of 75 failures, we selected those that (1) exhibited nondeterministic behavior on our test machine by being intermittently reproducible; and (2) had already been fixed by the Mozilla developers. Using failures that have been fixed assures us that there are identified code changes that can be studied to better understand why the failures were only observable on certain hardware configurations. Using these criteria we narrowed down our sample size to 11 failures. Each failure is described in detail in Section 4.2 along with an explanation of its code fix.
4.1.2
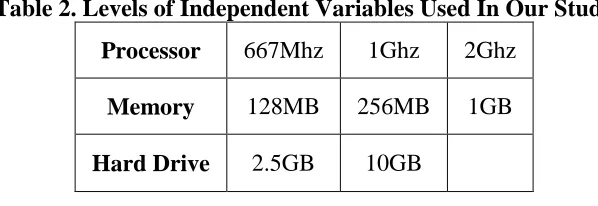
Step Two: Determine Hardware Configurations
Table 2. Levels of Independent Variables Used In Our Study Processor 667Mhz 1Ghz 2Ghz
Memory 128MB 256MB 1GB Hard Drive 2.5GB 10GB
The application under test was the open-source web browser Mozilla Firefox. The operating system on all configurations was chosen to be Microsoft Windows XP Professional Service Pack 3. While the operating system itself is a potential factor in observability, this study is focusing only on the effect the underlying hardware has on observability. According to Net Applications19, Windows XP is the most popular operating system in use today with an estimated market share of 71.8%, and the Windows family of operating systems together has 93% of market share20. This large market share was the primary motivation in choosing Windows XP for this study.
Hardware configurations were constructed as virtual machine images using the freely-available VMWare ESXi Server v4.021 software. The three factors of our study were manipulated by using the VMWare vSphere v4.022 client application. Although it can be debated how accurately a virtual machine models a real one, we believe such differences are not significant and outside the scope of this study. The ESXi server provides adequate controls for controlling processor speed and memory of a Windows system.
19 http://marketshare.hitslink.com/operating-system-market-share.aspx?qprid=10 20 Both statistics are true for the time the study was conducted i.e., 2009
21 http://www.vmware.com/products/esxi/
22
4.1.3
Step Three: Hardware Configuration Testing
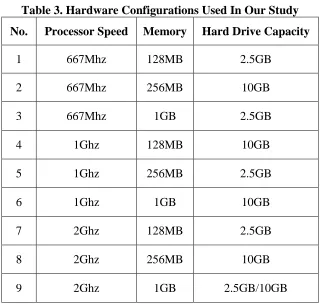
A full-factorial design of the factors listed in Table 2 results in 18 total combinations. However, using only pairwise interactions [11], the total number of combinations was reduced by half (see Table 3). Pairwise testing enables us to reduce the actual number of test cases by testing only the two-way interaction of variables rather than exhaustively testing all of their possible combinations. Empirical results show that faults are rarely dependent on larger combinations of values, but are more dependent on pairwise interactions of different variables [11]. All of the variables are evenly distributed in the nine combinations shown in Table 3.
Table 3. Hardware Configurations Used In Our Study No. Processor Speed Memory Hard Drive Capacity
1 667Mhz 128MB 2.5GB
2 667Mhz 256MB 10GB
3 667Mhz 1GB 2.5GB
4 1Ghz 128MB 10GB
5 1Ghz 256MB 2.5GB
6 1Ghz 1GB 10GB
7 2Ghz 128MB 2.5GB
8 2Ghz 256MB 10GB
9 2Ghz 1GB 2.5GB/10GB
4.1.4
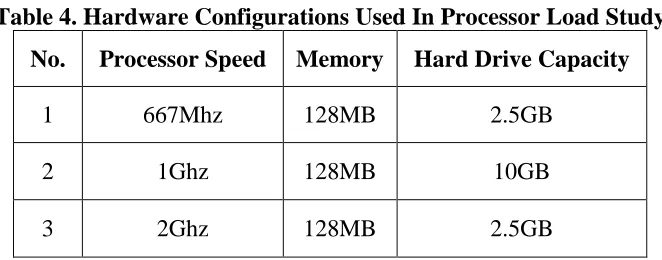
Step Four: Processor Load Testing
failures was run ten times on three configurations with four processor loads making the total number of test runs 120 for each failure.
Table 4. Hardware Configurations Used In Processor Load Study No. Processor Speed Memory Hard Drive Capacity
1 667Mhz 128MB 2.5GB
2 1Ghz 128MB 10GB
3 2Ghz 128MB 2.5GB
4.1.5
Establishing a Baseline
To establish a base of measurement for the observability of failures in Firefox's codebase, a further 12 random failures were selected and tested on the slowest virtual machine configuration i.e., a configuration with processor speed of 667 MHz, 128 MB memory, and 2.5 GB hard drive capacity. The failures chosen for the baseline test all had failure descriptions that indicated the failures were not intermittent.
4.1.6
Observability Data Collection and Tools
per second. The sequence of events fired by the application under test was monitored using an event-capturing tool. Finally, we manipulated processor load using a free utility (CPU Grabber) that simulates load for Win9x/2000 systems. All the preceding performance measures constitute the dependent variables for our study.
The tools used for this purpose included:
Spy++823 - An event-capturing utility that ships with Microsoft Visual Studio. Helpful in monitoring behind-the-scenes activity of a windows application.
VMMap924 - Provides a map of virtual memory for analyzing an application’s memory usage.
Perfmon1025 - A windows system diagnostic utility used for monitoring total processor usage as well as process-specific measurements.
CPU Grabber26 – A utility that lets us simulate processor load. Part of Microsoft DirectShow SDK Framework.
4.1.7
Threats to Validity
Internal validity involves determining effect of other factors that can influence study results without the researcher’s knowledge. As this study specifically focuses on nondeterministic behavior of software, any factors that affect the software under test are a risk. This risk was mitigated by using a clean virtual image with only the operating system and Firefox installed. Since testing Firefox involves sending messages on the network,
23 http://msdn.microsoft.com/en-us/library/aa242713(VS.60).aspx 24 http://technet.microsoft.com/en-us/sysinternals/dd535533.aspx 25 http://technet.microsoft.com/en-us/library/bb490957.aspx 26
network traffic and other noncontrollable factors could make up some of the unexplained variance in the ANOVA models. Also, the tests were run manually. For a few of the failures, this manual timing lead to some unexplained variance in the ANOVA models.
Threats to external validity are conditions that limit the generalization of the results. The primary threats in this study are the use of a single subject program and the use of a small set of failures. Future studies are needed to better understand how prevalent these issues are in Firefox and other types of software.
Threats to construct validity arise when measurement instruments do not properly capture what they are intended to capture. In this study, people were used to physically observe the failure, either through directly viewing the deviant behavior or indirectly observing the failure through the data collection tools. Subtle changes in the failure could be missed by the observers.
4.2
Selected Failures
Based on the criterion mentioned in the preceding section, we arrived at our sample size of 11 failures for in-depth study. This section describes each of those failures in greater detail along with their code fixes.
type a query results in the typed text appearing on the search box in the google tab. This behavior occurred since there was only one focus controller object defined in source code for the entire window. This was part of Firefox’s underlying Gecko engine and needed significant modifications. Instead a workaround was put in place to avoid this behavior that simply blocked all focus-stealing calls by checking if the tab requesting focus was also the active tab at that time.
Failure # 200119: This failure occurred when a Certificate Revoke List (CRL) is configured to be automatically updated in Firefox version 1.0. This configuration lead to random crashes of the application when a user attempted to exit. Although this failure was intermittent in our tests initially, it was later found to be always observable upon visiting a particular website. The fix for this failure involved refactoring the code and removing some redundant method calls.
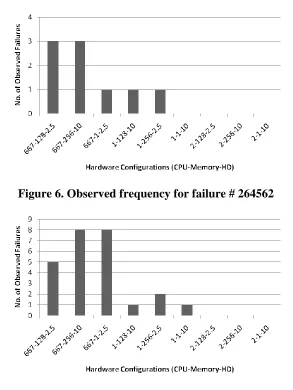
Failure # 264562: This failure involved the "Find As You Type"27 or incremental find functionality in Firefox. Upon pressing Ctrl-T to open a new tab and pressing some keystrokes in quick succession causes the find bar to appear at the bottom of the window, even though there is a blank page loaded in the browser. This failure was only reported on machines that had low processor speeds. The fix for this failure was to simply block all user input when no web page had been loaded in the browser window.
Failure # 314369: This failure has to do with the difference in minimum marquee speeds between Microsoft Internet Explorer and Firefox. In Internet Explorer, the minimum speed for a marquee is 60ms while in Firefox it is 40ms. This failure could be regarded as a
27
case of always failing, but failing differently (since marquee speeds were different each time the test was run). Some marquees in test cases exhibited inconsistent speeds and their behavior had to be mended in the source code fix to conform to standards similar to that of Internet Explorer.
Failure # 332330: This failure occurred when Ctrl-N and Alt-D were pressed in quick succession of each other. Normally this action would result in shifting of focus to the Firefox address bar but, instead, it triggered the Open Location dialog box. . Similar to the failure # 124750, this failure was also observed on systems with low processor speeds. Furthermore, this failure occurred only when a user's homepage was set to about:blank. Analyzing the underlying source code, we found that a variable gURLBar (representing the address bar) was uninitialized for cases when homepage was set to about:blank to improve application performance during startup. The fix was to assign the gURLBar its usual value regardless of a user’s homepage setting.
Failure # 363258: This failure was related to the inaccurate millisecond resolution used in earlier versions of Firefox on Windows XP. The millisecond resolution by default was 15 or 16ms which made profiling applications and add-ons for Firefox inaccurate. The fix involved doing a new implementation of the timer with a resolution of 1ms. This was another failure that was deemed deterministic since each test run produced different results i.e., the failure was always observed, just differently each time.
corresponded to the execution of instructions. The test case had three alerts in all, and one of them corresponded to SVG load event, the appearance of which indicated a normal flow of execution (and hence, the non-observavility of the fault). The fix was to use an event dispatcher to make sure the SVG load event was not ignored and was always captured by a listener.
Failure # 396863: This failure resulted in two sub-menus of the same menu-item being open at the same time. Normally, when focus moves away from one sub-menu, it closes after a set time or earlier if another sub-menu is opened. On a particular build of Firefox containing this failure, the mouse has to be moved quickly from an item in the first sub-menu to the second sub-menu so that both are open at the same time. The fix corrected the behavior of the timer responsible for opening and closing sub-menus.
Failure # 410075: This failure is timing-related and is observed when T and Ctrl-K in quick succession on Firefox's main window. By default, Ctrl-T opens a new tab and Ctrl-K moves focus to the search box at the top-right of the window. When pressed in quick succession, these sequence of keystrokes result in focus moving back to the address bar instead of staying in the search box. The fix to this was to remove a timeout in legacy code that was causing the focus to shift back to the address bar after a specified time interval, and hence, was overriding Ctrl-K.
incremental search feature. This failure was observed when multiple tabs were open in Firefox and a tab search was run form the All-Tabs window quickly followed by pressing the Enter key. These actions result in focus switching to the presently selected tab in the All-Tabs window rather than the first tab returned in the search results. The fix to this failure involved waiting for the search to be over before shifting focus to the appropriate tab.
Failure # 494116: This failure resulted in audio and video on a system running Microsoft Windows to go out of synchronization. The failure report described the failure as intermittent and that it was observed on normal as well as high processor load. The fix changed the method a Windows system’s audio timers were requested to ensure that audio and video were always in synchronization.
4.3
Results and Analysis
This section presents the analysis of study observations carried out on different hardware configurations and processor loads.
4.3.1
Hardware Configuration Study
Table 5. ANOVA Results for Failure Observability Data Failure ID Significant
Factor P-value Std. Dev.
R-Sq. (%)
R-Sq adj. (%)
124750 Processor 0.038 0.745 89.73 72.60
380417 Memory 0.057 0.650 89.41 71.76
396863 Memory 0.004 0.186 98.33 95.54
410075 Processor 0.15 1.773 76.92 38.45
494116 Processor 0.014 0.600 94.58 85.56
264562 Processor 0.037 0.600 90.97 75.93
332330 Processor 0.011 1.100 95.91 89.08
Figure 1 displays the results for failure # 124750. The figure shows a downward trend in the number of occurrences of this failure as configurations increase in terms of processor speed, memory, and hard drive capacity. The ANOVA results in Table 5 suggest a strong dependence on processor speed across all configurations. More than 70% of the observed variation in the data was due to processor speed alone.
Figure 2 displays the results for failure # 380417. The ANOVA results for this failure suggest a dependence on memory more than processor speed. The shape of the observed behavior suggests a decreased rate of occurrence with increasing memory and processor speed. The rate of occurrence is highest for cases with 128MB memory setting, hence its low p-value in the ANOVA results. Processor speed, being less significant, has a p-value of 0.235 and lastly, hard drive is statistically insignificant with a p-value of 0.727.
Figure 2. Observed frequency of failure # 380417
Figure 3. Observed frequency for failure # 396863
Figure 4 shows the observed behavior for failure # 410075. The ANOVA results suggest a dependence on both processor speed and hard drive factors. The failure description (see Section 4.2) implies it being dependent only on processor speed, but the ANOVA results show that both hard drive and processor speed have low statistical significance p-values of 0.150 each. Memory is also found to be statistically insignificant with a p-value of 0.453.
Figure 5 shows the observed behavior for failure # 494116. There is a strong dependence of this failure on processor speed (with a p-value of 0.014) and it was only observable on the first three configurations i.e., configurations that had a processor speed of 667MHz. These slower configurations were the only ones that had difficulty in playing audio and video smoothly together for the duration of the test. Memory and hard drive were not significant for this failure, with p-values of 0.614 and 0.466 respectively.
Figure 5. Observed frequency for failure # 494116
Figure 6. Observed frequency for failure # 264562
Figure 7. Observed frequency for failure # 332330
CPU Grabber at 25%. Under higher load, both of the failures showed signs of nondeterminism, which prompted us to explore this aspect of the failures in greater detail.
In summary, we found that five of the eleven failures selected displayed nondeterministic behavior and were observed intermittently on our test configurations. Our ANOVA results suggest that processor speed and memory capacity were the major contributing factors to such behavior. Except for failure # 410075, all p-values for our intermittent failures were significant (i.e., they were close to or less than 0.05). Additionally, there were several failures that were observed more frequently on the slowest configuration as compared to other configurations with more processor speed and memory. In terms of our research questions, we found that observability of software faults is impacted significantly by both processor speed and memory. We did not find evidence of hard drive capacity impacting the observability of any failure amongst our selected set of failures.
4.3.2
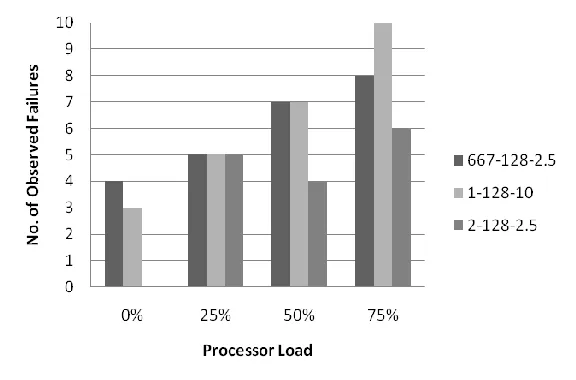
Processor Load Generation Study
This section describes the results for the processor load study conducted on our selected failures.
Figure 8. Observed frequency of failure # 124750 under simulated processor load
Table 6. ANOVA Results for Failure Observability Data Using Load Generation Failure ID Significant
Factor P-value Std. Dev.
R-Sq. (%)
R-Sq adj. (%)
124750 Processor Load 0.007 1.29 89.00 79.84
264562 Processor Speed 0.053 0.64 77.10 58.02
332330 Processor Speed 0.044 2.95 72.79 50.11
380417 Processor Load 0.001 1.11 92.57 86.39
396863 Processor Speed 0.097 1.25 58.55 24.00
410075 Processor Load 0.001 0.86 92.74 86.69
494116 Processor Speed 0.016 0.44 85.86 74.07
75% processor loads for the other two configurations. Processor load proved to be more effective on the slowest configuration, which is reflected in the ANOVA results. The most significant factor for this failure is processor speed (with a p-value of 0.053) followed by processor load (with a p-value of 0.094).
Figure 9. Observed frequency of failure # 264562 under simulated processor load
Figure 10. Observed frequency of failure # 332330 under simulated processor load
Figure 11. Observed frequency of failure # 380417 under simulated processor load
Figure 12 shows observed behavior for failure # 396863 under simulated processor load. As mentioned in Section 4, this failure was most prone to the effects of manual testing. The results are similar to the preceding study with the most significant factor being processor speed. The failure occurred due to a malfunctioning timer call (see Section 4.2 for details), and increased loads did not have an effect on the observability of this failure, expectedly.
Figure 13 shows observed behavior for failure # 410075 under simulated high processor load. For all configurations, the observability of the failure rises sharply to the point that it becomes always observable for 50% load (in some cases) and at 75% load (for all cases). The ANOVA results also show a strong dependence on processor load for this failure (with a p-value of 0.001) even though processor speed was still statistically significant (with a p-value of 0.178).
Figure 13. Observed frequency of failure # 410075 under simulated processor load
Figure 14. Observed frequency of failure # 494116 under simulated processor load
In summary, our results indicate that processor load has a significant impact on the observability of software faults. Our ANOVA results suggest both processor speed and load are responsible for exposing nondeterministic behavior of software. Except for failure # 396863, all p-values obtained in our ANOVA results were statistically significant (i.e., they were close to 0.05 level). There were two failures that were not observed on any configuration, but later became observable under higher processor load. Software engineers can, therefore, use our approach to better observe intermittent failures and nondeterministic behavior of software systems.
4.4
Baseline Failure Analysis
newly-introduced Places toolbar functionality in Firefox and occurred in builds released close to each other. The nondeterministic behavior of these failures arose due to inconsistencies in implementation of data structures underlying Places toolbar (specifically, the functionality governing folders and separators). The failures and their fixes were not related to processor speed, memory, or processor load.
4.5
Conclusions
We summarize the findings for our hardware configuration study in terms of the research question we stated earlier.
4.5.1
Is the observability of a software fault impacted by processor speed? If
so, how?
4.5.2
Is the observability of a software fault impacted by the amount of
memory? If so, how?
Our results show that memory capacity also influences the observability of software faults, similar to processor speed. Two of the seven failures that displayed nondeterministic behavior in our hardware configuration study were strongly dependent on memory. In both cases, our ANOVA results were statistically significant.
4.5.3
Is the observability of a software fault impacted by the size of the hard
drive? If so, how?
Our observations did not indicate that observability of software faults was impacted by hard drive capacity. There was one failure (failure # 410075) where hard drive capacity had the highest p-value of the three factors (0.150), which is not statistically significant.
4.5.4
Is the observability of a software fault impacted by processor load? If
so, how?
5.
CLASSIFICATION OF INTERMITTENT FAILURES
This study was primarily aimed at broadening the knowledge about intermittent failures that we encounter in present-day software systems. There are a number of classification schemes that exist in literature, most notably the IEEE Classification of Software Anomalies [18], the Orthogonal Defect Classification scheme [17] proposed by IBM, and a comprehensive taxonomy of failures by Beizer [61]. However, the classification scheme that we propose in this study is different from the preceding schemes or any other such schemes, since our scheme specifically seeks to classify intermittent software failures. To our knowledge, no such classification scheme exists in the literature. Classification schemes have been known to help improve software processes in an organization, which also serves as the prime motivation for the development of our scheme i.e., improvement of software process with respect to intermittent failures.
5.1
Study
The goal of this research was to reduce the effort spent on debugging intermittent failures by increasing the knowledge about them, and by providing actionable insight into their causes and underlying faults. Thus, we were interested in the following research questions:
We address these research questions by carrying out a detailed analysis of failure reports from an industrial software system developed by ABB Inc. and an open source system, Mozilla Firefox.
5.1.1
Systems Under Test
We used an industrial and an open source system for this study. The industrial system under test for our study was a large real-time desktop utility28 produced by ABB. The failure tracking database for this industrial system referred to intermittent failures as “Not Repeatable”. The proportional distribution of final failure status in the failure tracking database is shown in Figure 15. A total of 10.2% of all failures in the said database were closed as being “Not Repeatable”. The failure reports for such failures contained important clues about the nature of the failures, and the amount of effort spent investigating the cause of the failure by developers and testers.
Figure 15. Distribution of failure statuses in the ABB system
28
In this study, we use the term intermittent to refer to “Not Repeatable” failures in the industrial system. We found a number of failure reports that had initially been marked as intermittent by the investigating team, but after further investigation (either immediately or a after a future occurrence of the failure) were changed to some other status. Other statuses that the reports were later changed to included “Not a Problem”, which represented cases when the investigating team eventually decided that the failure report did not actually constitute a problem in the system, and that the customer had used a system in an incorrect way.
For the open source system, we chose Mozilla Firefox for our study. We had gathered a total of 82 intermittent failure reports for Mozilla Firefox. We used intermittent failure reports from both the industrial system and Mozilla Firefox as basis of our classification scheme as well as for identification of common preconditions that expose intermittent failures. We present more details about these processes in the following sections.
5.1.2
Data Collection
reports refer to all failure reports that described regular reproducible failures. In other words, this group consisted of reports that could not be ascribed to the preceding two groups. The failure reports in intermittent and previously intermittent groups were of primary interest to us for this study.
For Mozilla Firefox, we had gathered 82 intermittent failure reports from Bugzilla as part of our hardware configuration study (Section 4) [62]. Bugzilla does not have a separate status for intermittent failures. We, therefore, gathered failure reports by running natural language queries on Bugzilla based on variations of different keywords such as "timing", "page file", "operating system", "system dependent", "race condition", "deadlock", "concurrency", "pentium", "older machines", and "slow computers". We observed that the incidence rate of intermittent failures was similar to the industrial system i.e., 11.5%. We read a total of 710 reports that were returned from our searches, and manually identified 82 of them as being intermittent.