INVESTIGATION
Integration of New Genes into Cellular Networks,
and Their Structural Maturation
György Abrusán1 Synthetic and Systems Biology Unit, Institute of Biochemistry, Biological Research Centre of the Hungarian Academy of Sciences, Szeged H-6701, Hungary
ABSTRACTIt has been recently discovered that new genes can originatede novofrom noncoding DNA, and several biological traits including expression or sequence composition form a continuum from noncoding sequences to conserved genes. In this article, using yeast genes I test whether the integration of new genes into cellular networks and their structural maturation shows such a continuum by analyzing their changes with gene age. I show that 1) The number of regulatory, protein–protein, and genetic interactions increases continuously with gene age, although with very different rates. New regulatory interactions emerge rapidly within a few million years, while the number of protein–protein and genetic interactions increases slowly, with a rate of 2–2.2531028/year and 4.831028/year,
respectively. 2) Gene essentiality evolves relatively quickly: the youngest essential genes appear in proto-genes 14 MY old. 3) In contrast to interactions, the secondary structure of proteins and their robustness to mutations indicate that new genes face a bottle-neck in their evolution: proto-genes are characterized by high b-strand content, high aggregation propensity, and low robustness against mutations, while conserved genes are characterized by lower strand content and higher stability, most likely due to the higher probability of gene loss among young genes and accumulation of neutral mutations.
T
HE established view is that new genes evolve primarily by duplications and recombination,i.e., by reorganiza-tion of existing domains of other genes (Long et al.2003; Kaessmann 2010). Recent studies, however, highlighted that genes can also emerge from noncoding DNA:de novo emer-gence of genes has been demonstrated in a number of cases inDrosophila(Levineet al.2006; Begunet al.2007; Zhouet al. 2008), humans (Toll-Riera et al. 2009; Knowles and Mclysaght 2009; Wu et al. 2011; Xieet al.2012), rodents (Heinen et al. 2009; Murphy and Mclysaght 2012), yeast (Caiet al.2008; Carvuniset al.2012), and viruses (Rancurel
et al.2009; Sabathet al.2012). While orphan genes—genes with no homologs—are common in genomes (Tautz and Domazet-Loˇso 2011), proving that a gene emergedde novo
is not straightforward, as the presence of a nonfunctional parent sequence also has to be demonstrated, their presence can be convincingly demonstrated only in species where also
close relatives have been sequenced. However, the fact that they have been detected in several model organisms indi-cates that their emergence is not exceptionally rare, and may be an ongoing process in many, if not most, genomes.
Althoughde novoorigination of genes is not questioned anymore, little is known about its frequency and the sub-sequent fate of these genes in the genome,i.e., whether they are subject to turnover, how rapidly new protein–protein interactions are formed (Lynch 2012) and integrated into regulatory networks (Ding et al.2010; Chen et al.2012), and also whether structural changes affect the novel pro-teins. Real proteins are not random structures; i.e., they can be characterized with distinct biophysical properties like stability or aggregation propensity (DePristo et al. 2005; Monsellier and Chiti 2007), although, quite surprisingly, some of their basic features, like the presence of secondary structural elements (a-helices and b-strands), are already formed in random sequences (Schaefer et al. 2010). Ge-nome-wide studies of transcription in several species indi-cate that a large fraction of genome, including the noncoding part, is transcribed in most species (Kapranov
et al. 2007; Nagalakshmi et al.2008; Xuet al. 2009), and some of the noncoding transcripts are associated with ribo-somes and occasionally translated (Wilson and Masel 2011).
Copyright © 2013 by the Genetics Society of America doi: 10.1534/genetics.113.152256
Manuscript received April 15, 2013; accepted for publication August 27, 2013; published Early Online September 20, 2013.
Supporting information is available online athttp://www.genetics.org/lookup/suppl/ doi:10.1534/genetics.113.152256/-/DC1.
A recent large-scale study in yeast demonstrated the exis-tence of a continuous change in the level of expression, selective constraints, and codon adaptation index from recently emerged “proto-genes” to highly conserved, ancient genes (Carvuniset al.2012), and suggested that genes can be placed in a continuum from nongenic sequences to conserved genes, andde novoemergence of genes may be as common as emer-gence by the classic duplication–divergence mechanism. This is also supported by the phylogenetic pattern of gene emer-gence in vertebrates (Neme and Tautz 2013), indicating that young genes are typically short and that their length, number of exons, and domains change gradually over time.
This study has two goals. The first is to examine as broadly as possible what the fate of the new translatable open reading frames (ORFs) is after their emergence,i.e., to test how rapidly they are integrated into regulatory, protein– protein, or genetic interaction networks, whether they are stable in the genome, and whether there are characteristic sequence or structural changes in the process of their func-tionalization. The second is to test whether the observed patterns also support the theory proposed by Carvunis
et al. (2012), namely that nongenic sequences and well-characterized genes form a continuum and that no sharp boundaries exist between them.
Materials and Methods
Categorization of yeast genes into age groups
Similarly to Carvunis et al.(2012), genes ofSaccharomyces cerevisiae were divided into 11 groups according to their evolutionary conservation within fungi. Conservation level 0 corresponds to unannotated genes that were identified by Carvuniset al.(2012) and are longer than 50 amino acids. Genes with conservation level 1 are genes that were anno-tated as genes by the Saccharomyces Genome Database (Cherryet al.2012) but have no orthologs in other species, and higher conservation levels indicate the presence of orthologs in other fungi (see Figure 1); i.e., conservation level Nmeans that the orthologs of the gene are present in any species of the branch rooted at the Nth bifurcation (Figure 1), but not in species that split earlier from the
Saccharomyces lineage. Following Carvunis et al. (2012), I use the term proto-genes for genes that are present only in
S. cerevisiaeand its closest relatives (conservation levels 0–4). The classification of genes into proto-genes (conservation levels 0–4) was taken directly from Carvuniset al.(2012); the sequences of proto-genes with conservation level 0 (which are absent in theSaccharomyces Genome Database) were obtained using the genomic coordinates provided by the same study, using the R56 (20070406) release of the genome. Only sequences with a minimum length of 50 amino acids were used in the analysis. Conserved genes were clas-sified into conservation groups (Figure 1) as in Carvunis
et al.(2012) using the fungal gene orthology data set pro-vided by Wapinskiet al.(2007;http://www.broadinstitute.
org/regev/orthogroups). The same orthology data set was used to determine gene losses inS. paradoxusandS. mika-tae(seeResults).
The age estimates of the main branching events of the phylogeny of fungi (Figure 1) were obtained using TimeTree (Hedgeset al.2006), except forS. castellii, which split from the Saccharomyces lineage 100–150 MYA, after the whole genome duplication of yeasts (Cliftenet al.2006). For nodes without age estimates such estimates either are unavailable or conflict with the phylogeny of the species.
Data sources
The yeast genome and protein sequences were downloaded from the Saccharomyces Genome Database (Cherry et al.
2012); recent duplications were removed from the protein data set by clustering them at 80% amino acid similarity with uclust (Edgar 2010).
Thefitness effect of yeast genes (i.e., the effect of single-gene deletion on growth) was obtained from Deutschbauer
et al.(2005). Yeast protein–protein interactions and genetic interactions were downloaded from the BioGRID (v. 3.1.91) database (Stark et al. 2011); regulatory interactions were downloaded from the YEASTRACT database (Abdulrehman
Figure 1 A schematic phylogenetic tree of fungal species and conserva-tion of yeast genes (modified from Carvuniset al.2012). The main bi-furcation events on theSaccharomyceslineage are numbered, from 0 to 10, and age estimates were obtained using TimeTree (Hedges et al.
2006), except forS. castellii, which split from theSaccharomyceslineage 100–150 MYA, after the whole-genome duplication of yeasts (Cliften
et al.2006). Yeast genes were classified according to their conservation level, which corresponds to the phylogenetic spread of their orthologs; for example, a yeast gene with conservation level 5 means that it has ortho-logs inS. castelliibut not in the fungal species that split earlier from the
Saccharomyceslineage, while conservation level 7 means that the yeast gene has orthologs either inDebaryomyces hanseniiorC. albicans. Con-servation level 0 marks the putative ORFs identified by Carvuniset al.
et al. 2011). The strength of genetic interactions (genetic interaction score, e) was obtained from Costanzo et al.
(2010); the largest interaction data set with the “lenient cutoff” (P , 0.05) was used in the analysis, because it includes also the weak interactions. Each gene was charac-terized with the average of the |e| values of its significant genetic interactions, which was calculated separately for proto-genes, and conserved genes. The number and strength of protein–protein, genetic, and regulatory interactions for each gene was determined with Perl scripts, developed in house. (See supporting information,Table S1.) Due to their low expression and low conservation, the BioGRID database is probably significantly biased against proto-genes thus I included only those genes in the analysis that have interac-tions in the databases, even if the majority of genes in the conservation group has no reported interactions (this is the case with protein–protein and genetic interactions for con-servation levels 1–3).
Since in Saccharomyces cerevisiaeRNAi is absent, thefi t-ness effect of individual genes, genetic interactions, and epistasis between genes is determined with the deletion of genes (see Deutschbauer et al. 2005) as opposed to RNAi knockdown used in many mutlicellular organisms (Dixon
et al.2009). However, this also means that in the case of over-lapping genes, deletions target more than one gene, and thus neitherfitness measurements nor estimates of the strength of genetic interactions are accurate. In consequence, in the anal-yses involving fitness, genetic interactions, and epistasis, overlapping genes were excluded from the data set.
Determination of secondary structure and mutagenesis of proteins
In the structural analysis, in addition to the sequences with conservation levels 0–10 I used amino acid sequences that were generated randomly, with the same length and amino acid frequencies as the youngest proto-genes with conserva-tion levels 0–1. The secondary structures of the sequences were determined with PSSpred (http://zhanglab.ccmb.med. umich.edu/PSSpred/), aggregation propensity with Tango (Fernandez-Escamillaet al.2004) (seeTable S1). Since pro-tein sequences with different conservation levels have very different numbers of protein homologs, and secondary struc-ture prediction includes homology search, to avoid biases, PSSpred was run without the use of the homology search step (psi-blast), which reduces the accuracy of secondary structure prediction from 81 to 69%.
The mutagenesis of the yeast proteins was based on Schaefer et al. (2010) and was performed as follows (see also Figure 6). Each sequence was mutated gradually in 70 steps, and in each step 1% of the residues was changed in the sequence. Since protein sequences do not evolve entirely randomly, to simulate realistic mutations, new residues were
Figure 2 Integration of new genes into regulatory networks. Proto-genes acquire regulatory interactions rapidly; already genes with conservation level 1 are co-regulated with thousands of genes (A), (B) are regulated by several transcription factors (B), and also rapidly gain regulatory motifs (feed-forward loops) (C). The difference between proto-genes and con-served genes largely disappears by conservation level 4, representing14
introduced in a context specific manner, using the csbuild tool of the CS-BLAST suite (Biegert and Söding 2009). In each step, the secondary structure of the mutated sequence was determined, and the fraction of residues with a similar secondary structure to the original secondary structure (Q3 value) was calculated. For each yeast protein sequence, the mutagenesis was repeatedfive times independently, and the average of the five replicates was used in the analyses. To save computing time, from genes with conservation level 10, only 10% of the sequences were mutated (which were cho-sen randomly).
Results
Rapid emergence of regulatory interactions
The functionalization of a new gene means that, in addition to evolving a translatable open reading frame, it needs to become transcriptionally active,i.e., acquire a promoter and must be co-regulated with the genes it interacts with or other genes that are expressed in the same life stages or environmental conditions. Studies of novel retrogenes indi-cate that regulatory elements of new genes can be acquired from nearby genes or even from more distant locations (Kaessmannet al.2009; Kaessmann 2010). Using the YEAS-TRACT database (Abdulrehmanet al. 2011) I analyzed the integration of proto-genes into the yeast regulatory network by quantifying the number of genes that share the same transcription factors (TFs), thus are co-regulated, the num-ber of TFs regulating the genes, and the emergence of a sim-ple network motif, the feed-forward loop. The results show that the integration of genes into the regulatory network happens gradually, but very quickly; while young proto-genes with conservation levels 1–3 are co-regulated with a significantly smaller number of genes than genes with conservation level 5–10 (P , 0.05 for all comparisons, ANOVA, Bonferronipost hoctests, Figure 2A), the genes in the youngest group (conservation level 1) are already co-regulated with thousands of other genes, and the oldest proto-genes with conservation level 4 (14 milion years old) are not significantly different from most older groups (conservation levels 5,6, 8, 10,P.0.05, ANOVA, Bonferroni
post hoctests). A comparable pattern is visible for the number of transcription factors regulating the genes (Figure 2B) and proto-genes with conservation level 1–3 are regulated by sig-nificantly less transcription factors than conserved genes, or even proto-genes with conservation level 4 (P , 0.05, ANOVA, Bonferroni post hoc tests); however, already the youngest group (conservation level 1) is regulated by several transcription factors.
Regulatory networks are characterized with significantly overrepresented patterns of TFs, termed network motifs, which are capable of performing distinct regulatory func-tions (Leeet al.2002; Odom et al.2006). One of the most important such motifs is the feed-forward loop (FFL), which consists of three genes: two TFs, one of which regulates the other, and both regulating the same target gene. Depending
on the type of interactions between their components, FFLs can speed up or delay the response of target genes (Mangan and Alon 2003). I identified all FFL-like motifs in the net-work of YEASTRACT TFs and tested whether the number of FFLs regulating a gene changes with gene age. Due to the high connectivity of the network and overlaps between motifs, a large number of FFLs can be identified in YEASTRACT. Nevertheless, I found a similar, increasing pattern as with the number of TFs; i.e., conserved genes are regulated by proportionally more FFLs than proto-genes (P , 0.05, ANOVA, Bonferroni post hoc tests, Figure 2C), indicating a gradual and rapid acquisition of regulatory motifs that enable complex regulatory behaviors.
Essential genes are already present among proto-genes
Recent findings in Drosophilaindicate that essential genes (i.e., genes in which deletion mutants or knockouts are not viable) can evolve rapidly (Chen et al. 2010) even though they are most common among ancient genes. Using thefi t-ness data set provided by Deutschbaueret al.(2005) I tested how much time is necessary for the emergence of essential genes in yeast. The results show that the youngest essential genes (YEL035C,YPL124W) are present among the proto-genes with conservation level 4, with homologs inS. baya-nus(Figure 3), which split from theS. cerevisiaelineage14 MYA. However, essentiality may evolve even faster: the de-letion of several other proto-genes (already 7 in genes with conservation level 1) have lethal phenotypes, which, how-ever, is likely to be due to their overlap with conserved genes. Determining their independent fitness effect would require
fitness estimates that are independent from the effect of the genes they overlap with,e.g., obtained by RNAi introduced to yeasts (Drinnenberg et al.2009).
Protein secondary structure and aggregation propensity
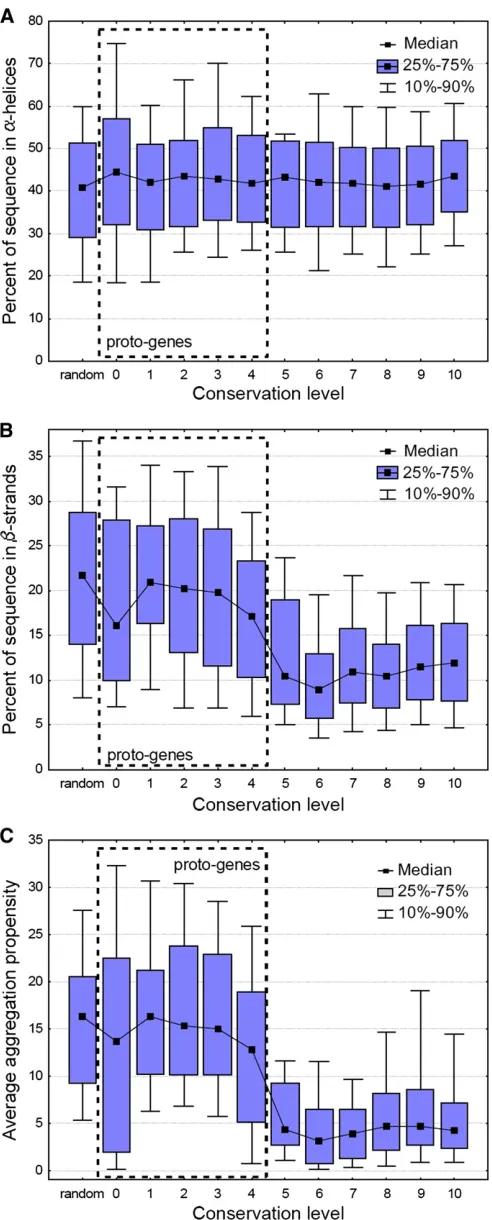
The analysis of secondary structure motifs in genes with different conservation level shows a surprising pattern. The abundance of a-helices is not influenced by the age of the proteins; helices take up40% of the sequence, regardless of conservation level, even in random amino acid sequences (Figure 4A,P.0.05 for comparisons between proto-genes and conserved genes, Bonferronipost hoctests, ANOVA). In contrast, the amount of predicted b-sheets is highest in proto-genes and random sequences (20%) and shows a de-cline to10% with increasing level of conservation (Figure 4B, P,, 0.001 for all comparisons between proto-genes and conserved genes, Bonferroni post hoc tests, ANOVA). This suggests that eitherb-strands are evolutionarily unsta-ble, and gradually disappear as the protein sequence accu-mulates neutral mutations, or their declining abundances are caused by natural selection. One selective force can be aggregation propensity (Monsellier and Chiti 2007), as it depends largely on the presence of b-strands (Jahn et al.
2010). Predicted aggregation propensity shows an even stronger pattern than b-strands; the average aggregation propensity of random sequences and proto-genes is almost three times higher than that of conserved genes (Figure 4C,
P,,0.001, for all comparisons between proto-genes and conserved genes, ANOVA).
Turnover of proto-genes
Functional noncoding sequences are short lived and subject to rapid turnover in mammalian genomes (Ponting et al.
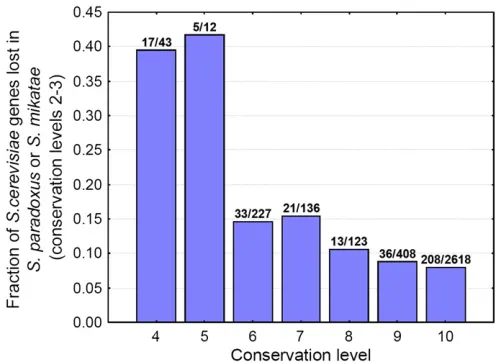
2011). If natural selection is the cause of b-strand loss, it may manifest itself as a gradual loss of strands due to muta-tions, or the loss of entire genes with high strand content. I examined the importance of the latter mechanism by testing how the probability of gene loss depends on the age of the gene. I used genes from conservation levels 4–10, and using the orthogroup data set provided by Wapinskiet al.(2007) I quantified gene losses in the youngestSaccharomyces spe-cies,S. paradoxusandS. mikatae(conservation levels 2–3). The results show that relatively young genes with conserva-tion levels 4–5 are lost at significantly higher frequencies in these species than are more conserved genes (40% is lost as opposed to 7–10%,P,0.05 for all comparisons,x-square tests, Figure 5), which corresponds well with the pattern of
b-strand loss and indicates that the turnover of proto-genes is likely to contribute to the observed structural change.
Robustness of secondary structures against mutations
To test the effect of mutation accumulation on the second-ary structure and robustness of yeast proteins, I performed
in silicomutagenesis studies. I followed a procedure that was based on Schaeferet al.(2010); mutations were introduced gradually into the protein sequences, and I examined how
Figure 4 Changes in secondary structure and aggregation propensity with gene age. While the amount ofa-helices does not depend on pro-tein age (A), the amount ofb-strands declines significantly between con-servation levels 4 and 6 (B). Aggregation propensity, which is partly caused by the presence ofb-strands, shows an even stronger trend than
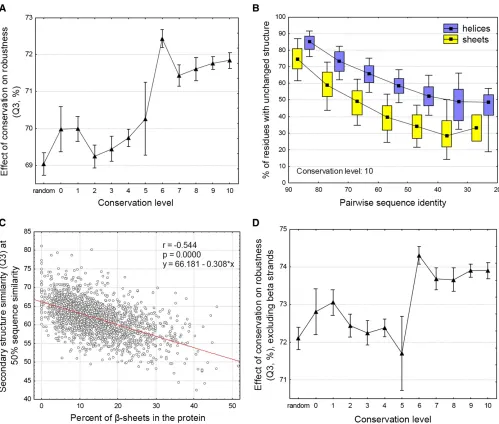
rapidly the original secondary structure degrades with the change of the amino acid composition of the sequence (see Figure 6 andMaterials and Methodsfor details). The results show that proto-genes are more sensitive to mutations than are older genes;i.e., their secondary structure changes faster with sequence change than the secondary structure of con-served genes (Figure 7A, P,, 0.001, Bonferroni post hoc
tests, ANCOVA with conservation level as categorical predic-tor and sequence divergence as continuous predicpredic-tor). How-ever, as their structural composition is also different from that of more conserved genes (Figure 4), this may be a by-product of compositional differences. The comparison of the muta-tional robustness of a-helices and b-sheets indicates that
b-sheets decay considerably faster from random mutations than a-helices (Figure 7B,P,,0.001, ANCOVA), and the robustness of proteins for mutations is negatively correlated with their b-strand content (Figure 7C,P ,, 0.001, R =
20.54). This suggests that b-strands are more difficult to maintain over longer evolutionary periods than a-helices, and their reduced amount in conserved genes may also be the result of the accumulation of neutral mutations. Repeat-ing the stability analysis only for the nonstrand regions of the proteins indicates that proto-genes remain more sensitive for mutations (Figure 7D,P,,0.001, Bonferronipost hoctests, ANCOVA), even after the exclusion of b-strands from the analysis; thus the higher robustness of old genes compared to proto-genes is not merely a by-product of their lower
b-strand content.
The number and strength of genetic and protein–protein interactions increases with the age of genes
Proteins typically perform their function in association with other proteins and form protein complexes. Physical inter-actions between proteins are largely determined by their
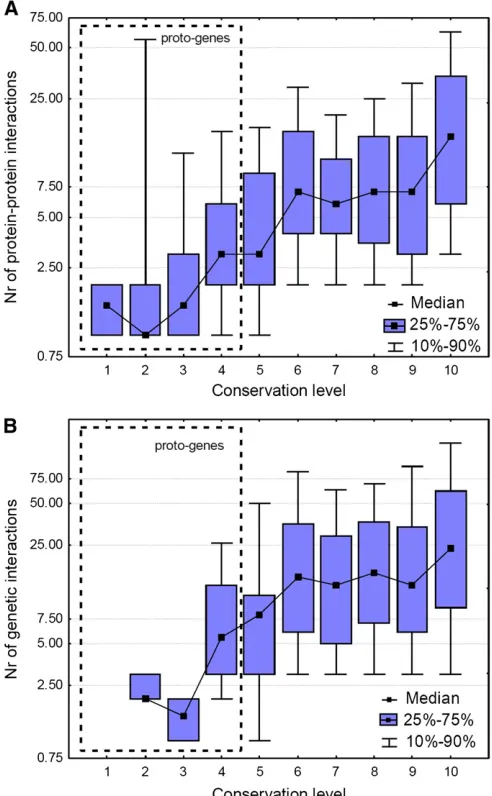
structure (Zhanget al.2012), and it has been demonstrated that the interacting surfaces can frequently be characterized by a similar arrangement of secondary structure elements (Tuncbaget al.2008; Zhanget al. 2010; Gao and Skolnick 2010). The size and age of protein complexes are highly variable, and currently there is no consensus on their rate of evolution (Qianet al.2011; Lewiset al.2012). In a pre-vious study Capra et al. (2010) have demonstrated that yeast genes younger than the whole-genome duplication are less integrated into protein–protein interaction networks than are older genes. I tested how the age (conservation level) of yeast proteins influences the number of their phys-ical interactions and whether it mirrors changes in the sec-ondary structure of proteins. Unlike secsec-ondary structure elements, protein–protein interactions increase gradually with the age of proteins (Figure 8A) and this appears to be a monotonous process; using conservation levels 6 and 10 for the estimate, the median number of interactions increases at a rate of 2–2.2531028/year (7/311 MY and
15/760 MY).
Genetic interactions mean that the synergistic effect of genes i and jon fitness (fij) is different than expected by
their multiplicative effects:fij=fifj+e, ande6¼0, wherefj
denotes the effect of genejonfitness, andethe magnitude of epistasis between the two genes (Dixon et al. 2009; Costanzoet al.2010). An extreme example is the synthetic lethal phenotype, where the independent deletion of two genes in both cases results in viable phenotypes, but their double deletion mutant is lethal. I tested whether the num-ber of genetic interactions depends on gene age and also found a positive relationship between the two (Figure 8B): the number of genetic interactions increases at a rate of 4.8 3 1028/year (15/311 MYA); however, it appears to
level off at conservation level 6 (311 MYA). Similarly to the number of genetic interactions, their strength changes with the age of the genes: the magnitude of epistasis (|e|) of the interactions of proto-genes is significantly lower than that of conserved genes (P ,, 0.001, Mann–Whitney
U-test, Figure 9).
Discussion
Overall, the integration of new genes into cellular networks supports the hypothesis of Carvuniset al.(2012) that a con-tinuum exists between conserved genes and proto-genes. The fastest process is the integration of proto-genes into regulatory networks (Figure 2): already the youngest proto-genes are regulated by several TFs, co-regulated with a large number genes, and many are regulated by network motifs (FFLs). The oldest proto-genes which appeared14 MYA are almost as well integrated into the regulatory net-work as the much more ancient fraction of the yeast pro-teome, which appeared before the S. cerevisiae–S. pombe
split. Although this analysis focused on the topological fea-tures of the entire regulatory network (i.e., ignored that under different environmental conditions or life stages only
subsets of the genes are expressed), this is in agreement with observations reporting that the acquisition of regula-tory sequences by new (retro)genes can happen rapidly (Kaessmannet al.2009) and horizontally transferred genes in bacteria acquire regulatory interactions within few mil-lion years (Lercher and Pál 2008) and also with thefindings that the proportion of proto-genes in proximity to known TF binding sites changes little with conservation level (Carvunis
et al. 2012). The fact that youngest essential genes are present already among proto-genes (Figure 3), which is in agreement with experimentalfindings reporting differences between the sets of essential genes between yeast strains (Dowell et al. 2010), also indicates that proto-genes gain functions rapidly. Unlike regulatory evolution, the acquisi-tion of protein–protein interactions (PPI) is a dramatically slower process, which does not appear to level off with pro-tein age, at least not within the range of examined conser-vation levels (Figure 8). The observed rate of PPI gain is at least an order of magnitude faster than the loss of interac-tions, which was estimated to occur at a rate of 1029(Lewis et al.2012) to 1.6–2.6310210(Qianet al.2011). In
addi-tion, as the interaction databases are incomplete, the rate of PPI gain is likely to be underestimated. In the case of genetic interactions the increase in the number of new interactions is less pronounced above conservation level 6 (311 MYA, Figure 8), although the oldest group (conservation level 10) is still characterized with a significantly higher number of interactions than genes with conservation levels 6–9. Unlike PPIs, genetic interactions also allow the measurement of the strength of interactions (e), which indicates stronger epistasis between conserved genes than that between proto-genes; thus the change is not only quantitative but also qual-itative (Figure 9).
In contrast, the structural maturation of new genes shows a different pattern: the secondary structures and structural stability of proteins indicate that proto-genes and conserved genes form two relatively distinct groups: proto-genes with highb-strand content, high aggregation propensity, and low robustness against mutations and conserved genes with lower strand content and higher stability. Proto-genes with conservation levels 0–3 are not much different from random sequences (with similar amino acid frequency), and the transition between the two states falls between conservation levels 4 (14 MYA) and 6 (311 MYA), thus requiring considerably more time than regulatory evolution (Figures 4 and 7). There are at least two mechanisms that may cause this shift; selection against highb-strand content or a neutral process. Although selection favoring mutations that re-duce aggregation propensity of proto-genes may seem
Figure 6 An overview of the analysis of protein structural robustness, on the example of yeast ORF YDR103W. (A) The tertiary structure of the protein (PDB id: 4F2H).a-helices are highlighted with blue andb-strands with yellow. (B) The sequence of the protein was gradually mutated in 70 steps; in each step 1% of the residues was changed, and in each step the secondary structure was determined. The change in the location of heli-ces and sheets that occurs with the mutagenesis is indicted with the respective colors. As sequence similarity to the original sequence declines, fewer and fewer residues are part of the same secondary structure as in
an attractive explanation for the reduction seen in
b-strands, and thefitness cost of misfolding-induced aggre-gation was even demonstrated experimentally in yeast (Geiler-Samerotte et al. 2011), the tests of selection by Carvunis et al. (2012) reported weak purifying selection in proto-genes, and not strong adaptive evolution. Alternatively, the reduction of strand content and aggregation propensity may reflect that, despite being already partly integrated into regulatory networks, a considerable fraction of proto-genes does not make it to higher conservation levels and are lost relatively quickly after their appearance. This is also suppor-ted by phylostratigraphic studies, which show that the
high-est number of founder genes typically form a peak in the youngest evolutionary strata (Tautz and Domazet-Loˇso 2011), implying that proto-genes are subject to some form of turnover, similarly to what has been recently shown for functional noncoding sequence in mammals (Meader et al.
2010). Gene deletion and inactivation studies show that 80–90% of genes in eukaryotes and prokaryotes can be lost individually without a significant fitness effect (Korona 2011), at least under laboratory conditions, and it has been suggested that genes that are lost easily during evolution are less important, i.e., have lower expression levels, fewer protein–protein interactions (Krylov et al. 2003), or higher
Figure 7 Structural robustness of proteins. (A) The robustness of secondary structures for mutations depends on their conservation level. Proto-genes and ancient genes show a highly significant difference (ANCOVA,P,,0.001 for comparisons between proto-genes and conserved genes, Bonferroni
evolutionary rate (Zhang and He 2005). The analysis of gene loss in this study indicates that proto-gene turnover exists; young genes with lower conservation levels (4–5) are lost considerably more easily in S. paradoxus and S. mikatae
than ancient genes (Figure 5), which are more integrated into cellular networks. An alternative explanation for the decay ofb-strands is that it is a neutral process, and while the amount ofa-helices is maintained by selection, the loss of strands due to neutral mutations is not compensated.
The robustness of secondary structure to mutations shows a similar shift between conservation levels 4 to 6 as
b-strand content and aggregation propensity: proto-genes are less robust than conserved genes, even if one takes into
consideration their higherb-strand content (Figure 7). The amount of mutations proteins can accumulate without a change in their structure is one of the key determinants of their capacity to produce evolutionary innovations, be-cause more robust proteins can better tolerate innovative but destabilizing mutations (Bloom et al. 2006b; Ferrada and Wagner 2008). The pattern observed in the yeast pro-teome is in line with experimental findings on individual proteins, which suggest that robustness against mutations promotes evolvability (Bloom et al.2006b) and that evo-lution favors mutational robustness (Bloom et al. 2007; Bershtein et al. 2008). Additionally, large-scale analyses of folding energies (DG) of protein structures also indicate that ancient, eukaryote-wide proteins are thermodynami-cally more stable and robust against mutations than younger ones present across metazoans or vertebrates (Toll-Riera
et al. 2012). Moreover, the lower tolerance of b-strands for mutations predicts that strands, at least in conserved proteins, should evolve at lower rates than helices or coils, which was indeed found in yeast (Bloomet al.2006a), al-though this effect is weaker than the effects of other struc-tural traits like solvent accessibility.
To conclude, the results show a somewhat contradictory picture of the evolution of new genes in yeast: the integra-tion of proto-genes into cellular networks shows a contin-uum, although the rates of regulatory evolution and the gain of protein and genetic interactions are very different. In con-trast, from the structural point of view, new genes do seem to face a bottleneck: proto-genes and conserved genes form relatively distinct groups, with different b-strand content, aggregation propensity, and robustness for mutations. This, with thefinding that young genes are lost much more easily than conserved ones, indicates that, even if they already have some functionality, young genes are still unstable in the genome.
Figure 9 Genetic interactions of proto-genes show weaker epistasis than of conserved genes (P,,0.001, Mann–WhitneyU-test). For each proto-and conserved gene the mean of their absolute genetic interaction scores (|e|) were calculated; thus the histograms represent both the positive and negative epistatic interactions.
Figure 8 The dependence of protein–protein and genetic interactions from gene age. Note that they-axis is logarithmic and that only those genes were included that have interactions, to correct for research biases. (A) The number of protein–protein interactions increases continuously with conservation level; new protein–protein interactions emerge at a rate 2–2.2531028/year. (B) The number of genetic interactions increases at
a rate of4.831028; however, the rate of change slows down above
Acknowledgments
I thank Balázs Papp and the referees for useful comments and suggestions. This study was supported by the Hungarian Scientific Research Fund (OTKA) grant PD83571 to G.A. The author declares that he has no competing interests.
Literature Cited
Abdulrehman, D., P. T. Monteiro, M. C. Teixeira, N. P. Mira, A. B. Lourençoet al., 2011 YEASTRACT: providing a programmatic access to curated transcriptional regulatory associations in Sac-charomyces cerevisiaethrough a web services interface. Nucleic Acids Res. 39: D136–D140.
Begun, D. J., H. A. Lindfors, A. D. Kern, and C. D. Jones, 2007 Evidence for de novo evolution of testis-expressed genes in theDrosophila yakuba/Drosophila erectaclade. Genetics 176: 1131–1137.
Bershtein, S., K. Goldin, and D. S. Tawfik, 2008 Intense neutral drifts yield robust and evolvable consensus proteins. J. Mol. Biol. 379: 1029–1044.
Biegert, A., and J. Söding, 2009 Sequence context-specific profiles for homology searching. Proc. Natl. Acad. Sci. USA 106: 3770– 3775.
Bloom, J. D., D. A. Drummond, F. H. Arnold, and C. O. Wilke, 2006a Structural determinants of the rate of protein evolution in yeast. Mol. Biol. Evol. 23: 1751–1761.
Bloom, J. D., S. T. Labthavikul, C. R. Otey, and F. H. Arnold, 2006b Protein stability promotes evolvability. Proc. Natl. Acad. Sci. USA 103: 5869–5874.
Bloom, J. D., Z. Lu, D. Chen, A. Raval, O. S. Venturelli et al., 2007 Evolution favors protein mutational robustness in suffi -ciently large populations. BMC Biol. 5: 29.
Cai, J., R. Zhao, H. Jiang, and W. Wang, 2008 De novo origination of a new protein-coding gene inSaccharomyces cerevisiae. Ge-netics 179: 487–496.
Capra, J. A., K. S. Pollard, and M. Singh, 2010 Novel genes exhibit distinct patterns of function acquisition and network integra-tion. Genome Biol. 11: R127.
Carvunis, A.-R., T. Rolland, I. Wapinski, M. A. Calderwood, M. A. Yildirimet al., 2012 Proto-genes and de novo gene birth. Na-ture 487: 370–374.
Chen, S., Y. E. Zhang, and M. Long, 2010 New genes in Drosoph-ila quickly become essential. Science 330: 1682–1685. Chen, S., X. Ni, B. H. Krinsky, Y. E. Zhang, M. D. Vibranovskiet al.,
2012 Reshaping of global gene expression networks and sex-biased gene expression by integration of a young gene. EMBO J. 31: 2798–2809.
Cherry, J. M., E. L. Hong, C. Amundsen, R. Balakrishnan, G. Binkley
et al., 2012 Saccharomyces Genome Database: the genomics resource of budding yeast. Nucleic Acids Res. 40: D700–D705. Cliften, P. F., R. S. Fulton, R. K. Wilson, and M. Johnston,
2006 After the duplication: gene loss and adaptation in Sac-charomyces genomes. Genetics 172: 863–872.
Costanzo, M., A. Baryshnikova, J. Bellay, Y. Kim, E. D. Spearet al., 2010 The genetic landscape of a cell. Science 327: 425–431. DePristo, M. A., D. M. Weinreich, and D. L. Hartl, 2005 Missense
meanderings in sequence space: a biophysical view of protein evolution. Nat. Rev. Genet. 6: 678–687.
Deutschbauer, A. M., D. F. Jaramillo, M. Proctor, J. Kumm, M. E. Hillenmeyeret al., 2005 Mechanisms of haploinsufficiency re-vealed by genome-wide profiling in yeast. Genetics 169: 1915– 1925.
Ding, Y., L. Zhao, S. Yang, Y. Jiang, Y. Chenet al., 2010 A young Drosophila duplicate gene plays essential roles in
spermatogen-esis by regulating several Y-linked male fertility genes. PLoS Genet. 6: e1001255.
Dixon, S. J., M. Costanzo, A. Baryshnikova, B. Andrews, and C. Boone, 2009 Systematic mapping of genetic interaction net-works. Annu. Rev. Genet. 43: 601–625.
Dowell, R. D., O. Ryan, A. Jansen, D. Cheung, S. Agarwalaet al., 2010 Genotype to phenotype: a complex problem. Science 328: 469.
Drinnenberg, I. A., D. E. Weinberg, K. T. Xie, J. P. Mower, K. H. Wolfeet al., 2009 RNAi in budding yeast. Science 326: 544– 550.
Edgar, R. C., 2010 Search and clustering orders of magnitude faster than BLAST. Bioinformatics 26: 2460–2461.
Fernandez-Escamilla, A.-M., F. Rousseau, J. Schymkowitz, and L. Serrano, 2004 Prediction of sequence-dependent and muta-tional effects on the aggregation of peptides and proteins. Nat. Biotechnol. 22: 1302–1306.
Ferrada, E., and A. Wagner, 2008 Protein robustness promotes evolutionary innovations on large evolutionary time-scales. Proc. Biol. Sci. 275: 1595–1602.
Gao, M., and J. Skolnick, 2010 Structural space of protein-protein interfaces is degenerate, close to complete, and highly con-nected. Proc. Natl. Acad. Sci. USA 107: 22517–22522. Geiler-Samerotte, K. A., M. F. Dion, B. A. Budnik, S. M. Wang, D. L.
Hartlet al., 2011 Misfolded proteins impose a dosage-dependent
fitness cost and trigger a cytosolic unfolded protein response in yeast. Proc. Natl. Acad. Sci. USA 108: 680–685.
Hedges, S. B., J. Dudley, and S. Kumar, 2006 TimeTree: a public knowledge-base of divergence times among organisms. Bioin-formatics 22: 2971–2972.
Heinen, T. J. A. J., F. Staubach, D. Häming, and D. Tautz, 2009 Emergence of a new gene from an intergenic region. Curr. Biol. 19: 1527–1531.
Jahn, T. R., O. S. Makin, K. L. Morris, K. E. Marshall, P. Tianet al., 2010 The common architecture of cross-beta amyloid. J. Mol. Biol. 395: 717–727.
Kaessmann, H., 2010 Origins, evolution, and phenotypic impact of new genes. Genome Res. 20: 1313–1326.
Kaessmann, H., N. Vinckenbosch, and M. Long, 2009 RNA-based gene duplication: mechanistic and evolutionary insights. Nat. Rev. Genet. 10: 19–31.
Kapranov, P., A. T. Willingham, and T. R. Gingeras, 2007 Genome-wide transcription and the implications for ge-nomic organization. Nat. Rev. Genet. 8: 413–423.
Knowles, D. G., and A. McLysaght, 2009 Recent de novo origin of human protein-coding genes. Genome Res. 19: 1752–1759. Korona, R., 2011 Gene dispensability. Curr. Opin. Biotechnol. 22:
547–551.
Krylov, D. M., Y. I. Wolf, I. B. Rogozin, and E. V. Koonin, 2003 Gene loss, protein sequence divergence, gene dispens-ability, expression level, and interactivity are correlated in eu-karyotic evolution. Genome Res. 13: 2229–2235.
Lee, T. I., N. J. Rinaldi, F. Robert, D. T. Odom, Z. Bar-Josephet al., 2002 Transcriptional regulatory networks in Saccharomyces cerevisiae. Science 298: 799–804.
Lercher, M. J., and C. Pál, 2008 Integration of horizontally trans-ferred genes into regulatory interaction networks takes many million years. Mol. Biol. Evol. 25: 559–567.
Levine, M. T., C. D. Jones, A. D. Kern, H. A. Lindfors, and D. J. Begun, 2006 Novel genes derived from noncoding DNA in
Drosophila melanogasterare frequently X-linked and exhibit tes-tis-biased expression. Proc. Natl. Acad. Sci. USA 103: 9935– 9939.
Long, M., E. Betrán, K. Thornton, and W. Wang, 2003 The origin of new genes: glimpses from the young and old. Nat. Rev. Genet. 4: 865–875.
Lynch, M., 2012 The evolution of multimeric protein assemb-lages. Mol. Biol. Evol. 29: 1353–1366.
Mangan, S., and U. Alon, 2003 Structure and function of the feed-forward loop network motif. Proc. Natl. Acad. Sci. USA 100: 11980–11985.
Meader, S., C. P. Ponting, and G. Lunter, 2010 Massive turnover of functional sequence in human and other mammalian genomes. Genome Res. 20: 1335–1343.
Monsellier, E., and F. Chiti, 2007 Prevention of amyloid-like ag-gregation as a driving force of protein evolution. EMBO Rep. 8: 737–742.
Murphy, D. N., and A. McLysaght, 2012 De novo origin of protein-coding genes in murine rodents. PLoS ONE 7: e48650. Nagalakshmi, U., Z. Wang, K. Waern, C. Shou, D. Raha et al.,
2008 The transcriptional landscape of the yeast genome
de-fined by RNA sequencing. Science 320: 1344–1349.
Neme, R., and D. Tautz, 2013 Phylogenetic patterns of emergence of new genes support a model of frequent de novo evolution. BMC Genomics 14: 117.
Odom, D. T., R. D. Dowell, E. S. Jacobsen, L. Nekludova, and P. A. Rolfe et al., 2006 Core transcriptional regulatory circuitry in human hepatocytes. Mol. Syst. Biol. 2: 2006.0017.
Ponting, C. P., C. Nellåker, and S. Meader, 2011 Rapid turnover of functional sequence in human and other genomes. Annu. Rev. Genomics Hum. Genet. 12: 275–299.
Qian, W., X. He, E. Chan, H. Xu, and J. Zhang, 2011 Measuring the evolutionary rate of protein-protein interaction. Proc. Natl. Acad. Sci. USA 108: 8725–8730.
Rancurel, C., M. Khosravi, A. K. Dunker, P. R. Romero, and D. Karlin, 2009 Overlapping genes produce proteins with un-usual sequence properties and offer insight into de novo protein creation. J. Virol. 83: 10719–10736.
Sabath, N., A. Wagner, and D. Karlin, 2012 Evolution of viral proteins originated de novo by overprinting. Mol. Biol. Evol. 29: 3767–3780.
Schaefer, C., A. Schlessinger, and B. Rost, 2010 Protein secondary structure appears to be robust under in silico evolution while protein disorder appears not to be. Bioinformatics 26: 625–631.
Stark, C., B.-J. Breitkreutz, A. Chatr-Aryamontri, L. Boucher, R. Oughtred et al., 2011 The BioGRID Interaction Database: 2011 update. Nucleic Acids Res. 39: D698–D704.
Tautz, D., and T. Domazet-Loˇso, 2011 The evolutionary origin of orphan genes. Nat. Rev. Genet. 12: 692–702.
Toll-Riera, M., N. Bosch, N. Bellora, R. Castelo, L. Armengolet al., 2009 Origin of primate orphan genes: a comparative genomics approach. Mol. Biol. Evol. 26: 603–612.
Toll-Riera, M., D. Bostick, M. M. Albà, and J. B. Plotkin, 2012 Structure and age jointly influence rates of protein evo-lution. PLOS Comput. Biol. 8: e1002542.
Tuncbag, N., A. Gursoy, E. Guney, R. Nussinov, and O. Keskin, 2008 Architectures and functional coverage of protein-protein interfaces. J. Mol. Biol. 381: 785–802.
Wapinski, I., A. Pfeffer, N. Friedman, and A. Regev, 2007 Natural history and evolutionary principles of gene duplication in fungi. Nature 449: 54–61.
Wilson, B. A., and J. Masel, 2011 Putatively noncoding transcripts show extensive association with ribosomes. Genome Biol. Evol. 3: 1245–1252.
Wu, D.-D., D. M. Irwin, and Y.-P. Zhang, 2011 De novo origin of human protein-coding genes. PLoS Genet. 7: e1002379. Xie, C., Y. E. Zhang, J.-Y. Chen, C.-J. Liu, W.-Z. Zhou et al.,
2012 Hominoid-specific de novo protein-coding genes origi-nating from long non-coding RNAs. PLoS Genet. 8: e1002942. Xu, Z., W. Wei, J. Gagneur, F. Perocchi, S. Clauder-Münsteret al.,
2009 Bidirectional promoters generate pervasive transcription in yeast. Nature 457: 1033–1037.
Zhang, J., and X. He, 2005 Significant impact of protein dispens-ability on the instantaneous rate of protein evolution. Mol. Biol. Evol. 22: 1147–1155.
Zhang, Q. C., D. Petrey, R. Norel, and B. H. Honig, 2010 Protein interface conservation across structure space. Proc. Natl. Acad. Sci. USA 107: 10896–10901.
Zhang, Q. C., D. Petrey, L. Deng, L. Qiang, Y. Shi et al., 2012 Structure-based prediction of protein-protein interac-tions on a genome-wide scale. Nature 490: 556–560.
Zhou, Q., G. Zhang, Y. Zhang, S. Xu, R. Zhaoet al., 2008 On the origin of new genes in Drosophila. Genome Res. 18: 1446–1455.
GENETICS
Supporting Information
http://www.genetics.org/lookup/suppl/doi:10.1534/genetics.113.152256/-/DC1
Integration of New Genes into Cellular Networks,
and Their Structural Maturation
György Abrusán
Table S1 Data used in calculations