ISSN (Online) : 2319 - 8753
ISSN (Print) : 2347 - 6710
I
nternationalJ
ournal ofI
nnovativeR
esearch inS
cience,E
ngineering andT
echnologyAn ISO 3297: 2007 Certified Organization, Volume 2, Special Issue 1, December 2013
Proceedings of International Conference on Energy and Environment-2013 (ICEE 2013)
On 12th to 14th December Organized by
Department of Civil Engineering and Mechanical Engineering of Rajiv Gandhi Institute of Technology, Kottayam, Kerala, India
ROAD USER EFFECTS MODEL CALIBRATION IN
HDM-4
–
A CASE STUDY
Aswathy Das A, Bino I. Koshy, Jeena Pradeep
M. Tech Student, Rajiv Gandhi Institute of Technology, Kottayam, Kerala India Professor, Rajiv Gandhi Institute of Technology, Kottayam, Kerala India
General Manager (Transport Planning), CDM Smith India Pvt. Ltd., Bangalore, Karnataka India
ABSTRACT
This article reports the results of study done on calibration of Highway Development and Management Model (HDM-4) for conducting economic analysis. HDM-4 developed by the World Bank is considered as the best management tool for managing pavements worldwide. However the calibration of the model is inevitable to represent the existing situation as the results of analysis will be based on the calibration accuracy and as well as on how well the model represents the realistic condition. This paper focuses on the Road User Effects Modelling in HDM-4 and validation of the model using Road User Cost Knowledge System (RUCKS).
NOMENCLATURE RUC Road User Cost
RUE Road User Effects
RUCKS Road User Cost Knowledge System TTC Travel Time Cost
VOC Vehicle Operating Cost
1. INTRODUCTION
1.1 Cost Components in Transportation System
In broad terms, the society costs pertaining to the highway development, to be considered in this analysis includes:
Agency costs: Capital cost, recurrent cost for maintenance (annual & periodical), residual value at the end of analysis period.
Road user costs: Vehicle operating cost, travel time cost, accident cost.
Benefit Component in Transportation System
The objective of a good transportation system is to provide an efficient, quick and safe transportation to its users. And this is counted as the benefit of transportation. The various possible forms of benefits can be summarized as follows (IRC: SP-30, 1993):
Road user benefits: This type of benefit includes, saving in VOC, saving of travel time, saving in terms of accident cost, saving in the cost of maintenance etc.
Social benefits: This type of benefit includes, benefit due to improvement in administration, health,
education, agriculture, industry, trade, environmental standards etc.
2. METHODS OF ECONOMIC EVALUATION
The following are the various methods of economic evaluation of highway projects:
Rate of return methods Benefit Cost (B/C) ratio method o First Year Rate of Return method Discounted Cash Flow (DCF) methods o Net Present Value (NPV) method o Internal Rate
of Return (IRR) method
IRR method seems to be the most preferred economic analysis tool. Investments in Road infrastructure development may not be evaluated using only traditional appraisal methods such as the Net Present Value (NPV), Internal Rate of Return (IRR), Annual Rate of Return (ARR), Payback Method etc. This is due to the fact that road infrastructure comes with other social and economic benefits that are difficult to quantify in monetary terms [2].
Selecting the optimal alternative in transportation projects can be a very complex affair. The analysts must consider numerous options and take into consideration the baseline data and projections of traffic
flows with and without the project; the project‟s impact on generated demand and the project‟s impact on
existing services. Even in relatively straightforward projects, such as roads, there are a wide range of options to consider, including the design of the road (whether or not to pave, how thick the pavement, how wide and how straight the road, etc.), limitations on vehicle size and weights, on access, and so on. Thus with new developments in technology computer models and programs were used for the economic analysis so that the complex task of analysis becomes much easier.
3. ECONOMIC ANALYSIS USING SOFTWARES
There are a number of softwares available for the economic analysis of road projects including MicroBENCOST, Cal B/C, Redbook, RED, HDM-III, HDM-4, RUCKS etc.
facilitate the adoption of HDM-4 as the standard tool for project analysis, work programming and long term strategic analysis of road network requirements. The technical modules permit extensive calibration of the models used in HDM-4 in order to cover the range of environment experienced world-wide. In addition, the HDM-4 software modules can be replaced, if necessary to customize their use within existing road agency management information systems [3-4].
The Highway Development and Management Model (HDM-4) Version 1.3 was released in January 2002 which is the recommended software for evaluating highway investment options.
4. NEED FOR CALIBRATING HDM-4
As part of the International Study of Highway Development and Management Tools (ISOHDM), a compendium was compiled of the countries where HDM had been applied. HDM or its relationships has been applied in over 100 developed and developing countries having markedly different technological, climatic and economic environments. Since the model simulates future changes to the road system from current conditions, the reliability of the results is dependent upon two primary considerations:
How well the data provided to the model represent the reality of current conditions and other influencing factors, in the terms understood by the model; and,
How well the predictions of the model fit the real behaviour and the interactions between various factors for the variety of conditions to which it is applied.
Thus before analysis, the system will have to be calibrated to the existing conditions or the prevailing conditions of the study area or country [5].
5. DATA COLLECTION
A huge number of inputs are needed for analysis in software. Data collection includes primary data and secondary data.
Primary data
Primary data includes the classified volume count survey, road side interview survey, and pavement condition survey was collected for the project stretch of State Highway-1 of Kerala.
Secondary data
The inputs needed in HDM-4 are enormous and for each representative vehicle the basic data like the following were collected from secondary sources.
Basic characteristics: This includes
Physical: Passenger car space equivalent, number of wheels, number of axles Tyres: Tyre type, base number of recaps(retread), retread cost
Utilization: Annual km, working hrs, average life, private use, passengers, work-related trips Loading: Equivalent Single Axle Load Factor (per vehicle), operating weight
Economic unit costs: This includes
Vehicle resources: new vehicle, replacement tyre, fuel, lubricating oil, maintenance labour, crew wages, annual overhead, annual interest
Time value: passenger working time, passenger non-working time, cargo.
6. STEPS FOR CALIBRATION OF HDM-4
configured and calibrated for local use. Since HDM-4 has designed to be used in a wide range of environments, calibration of HDM-4 provides the facility to customize system operation to reflect the norms that are customary in the environment under study [5].
Calibration of the HDM model focuses on the two primary components which determine the physical quantities, costs and benefits predicted for the analysis, namely:
Road User Effects (RUE); and
Road Deterioration and Maintenance Effects (RDME)
The degree of local calibration appropriate for HDM is a choice that depends very much on the type of application and on the resources available to the user. For example, in planning applications the absolute magnitude of the RUE and road construction costs need to match local costs closely because alternative capital projects with different traffic capacities or route lengths are evaluated on the comparison of the total road transport costs. In road maintenance programming, on the other hand, the sensitivity of RUE to road conditions, particularly roughness, and all the road deterioration and maintenance predictions are the most important aspects [6].
6.1 Road User Effects (RUE)
Road user effects (RUE) comprise of vehicle operating costs (VOC), travel time, accident costs, vehicle emissions (noxious gases and noise), and developmental effects. The use of appropriate calibration factors in HDM-4 pavement deterioration models will facilitate more reliable and rational prediction of pavement deterioration for the road network under considerations [6].
Hence for calibration of Road User Effects, travel time of different vehicles need to be obtained.
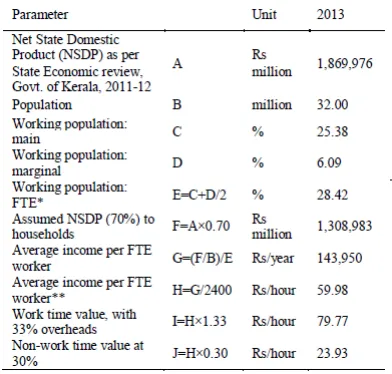
TABLE 1. VALUE OF TRAVEL TIME FOR BUS (WORK TIME VALUE AND NON- WORK TIME VALUE)
Govt. of Kerala, 2011-12
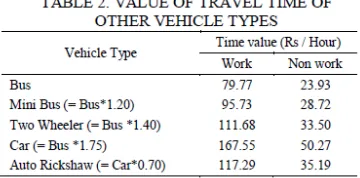
Table 1 represents the calculation of Value of Travel Time from Net State Domestic Product (NSDP) for Bus. From the time value of bus passenger the time value of mini bus, two wheelers, car and auto rickshaw was calculated. Table 2 represents Value of Travel Time for other types of vehicles.
6.2 Road Deterioration and Maintenance Effects (RDME)
Road Deterioration and Maintenance Effects (RDME) are comprised of the deterioration of the pavement and the impact of maintenance activities on pavement condition and the future rate of pavement deterioration [6].
In this study focus is on Road User Effects (RUE) calibration rather than the Road Deterioration and Maintenance Effects (RDME). Hence the calibration factors of HDM-4 pavement deterioration models derived for Indian conditions by Jain et al (2005) [7] are being used and is as represented in Table 3.
TABLE 3. CALIBRATION FACTORS OF HDM-4 PAVEMENT DETERIORATION MODELS
Sl. no Model Description Calibration Factors 1 Cracking Initiation Kcia = 0.43
2 Cracking Progression Kcpa = 1.25
3 Ravelling Initiation Kvi = 0.37
4 Ravelling Progression Kvp = 0.52
5 Potholing Initiation Kpi = 0.45
6 Potholing Progression Kpp = 0.95
7 Roughness Progression Kgp = 0.85
VALIDATION OF HDM-4
After any calibration it is indeed necessary to validate the calibrated model for the purpose of accuracy. For the validation of RUC model being calibrated in HDM-4, RUCKS is used. RUCKS is an excel format
software available which uses the „Macros‟ application in Microsoft Excel. For calibrating RUC in
HDM-4 separate software is currently being released by World Bank. However for the present study HDM-4 Version 1.3 only is used.
Inputs to RUCKS
accuracy for the values obtained from RUCKS than HDM-4. However a comparison can be done for the
purpose of validation. For this purpose the base case or „do-minimum‟ scenario is considered.
Comparison of Results
Road User Costs is an important consideration in the justification of highway investments, comparison of alternative designs, projects and programs ordering within limited budget and analysis of policy and regulation. The determination of road user cost is a key element in evaluating the highway projects [8]. For the purpose of validation the road user costs obtained from both RUCKS and HDM-4 can be compared. Road User Cost is the combined value of Vehicle Operating Costs and Travel Time Costs. So comparing RUC is similar to comparing VOC or TTC. However for decreasing the chances of error in prediction, Vehicle Operating Costs can be compared as it includes much more variables than Travel Time Cost. Thus for the present study VOC of both the softwares are compared.
Vehicle Operating Cost Values from HDM-4 and RUCKS
The variation of VOC in HDM-4 over RUCKS is indicated in Table 4 and Figure 1.
TABLE 4. VOC VALUES AND VARIATION IN HDM-4 AND RUCKS
FIGURE 1. VOC VALUES FROM HDM-4 AND RUCKS
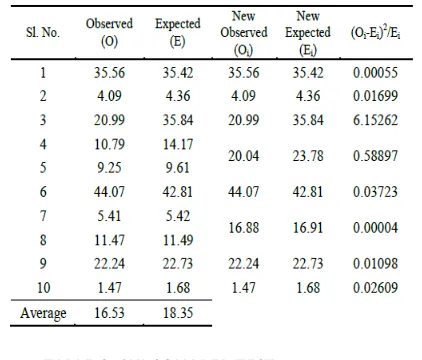
TABLE 5. COMPONENT PERCENTAGE OF ROAD USER COST TABLE 6. CHI-SQUARED TEST
should be more for passenger vehicles i.e., in the range of 70% or more and VOC around 30% or below. While for commercial vehicles this TTC component should be below 5% and VOC should be above 95%.
Table 5 shows the percentage of VOC and TTC for each vehicle type. From the table above its clear that the percentage of VOC and TTC for bus is not matching with the thumb rule in case of values form RUCKS. But the percentage matches in case of 4 showing a correction needed only for RUCKS. As this project uses HDM-4 there is no need for correction. Thus, the software is being calibrated and can be used for economic analysis.
Observed values more than the average value of observations need to be clubbed in case of Chi- Square test. Thus values 4 and 5 are clubbed as a single observation and 7 and 8 as another single observation as in Table 6.
6. CONCLUDING REMARKS
The study ended up in identification of a tool for conducting economic analysis of road improvement schemes. While validating the values obtained in HDM-4 using RUCKS, 8 vehicle types were found to have only very minor variation in values while 2 vehicle types (Bus, Mini LCV) especially Bus, was found to have remarkable variation. A variation of value up to 25% was considered acceptable for the validation. However the percentage of RUC that goes into VOC for bus is acceptable in case of HDM-4. Thus the calibration of Road User Cost in HDM-4 was found to be acceptable.
REFERENCES
[1] IRC: SP-30. 1993. “Economic Evaluation of Highway Projects in India.” Indian Road Congress.
[2] Adu, J., 2009. “Financing and Evaluation ofInvestments in Road Infrastructure Development.” Thesis, The Institute of Distance
Learning, Kwame Nkrumah University of Science and Technology.
[3] Kerali, H. R., Robinson, R., and Paterson, W. D. O., 1998. “Role of the New HDM-4 in Highway Management.” 4th Int. Conf. on Managing
Pavements
[4] Kerali, H. R., Odoki, J. B., Wightman, D. C., and Stannard, E. E., 1998. “Structure of the new Highway Development and Management
Tools (HDM-4).” 4th Int. Conf. on Managing Pavements
[5] Bennett, C. R., and Paterson, W. D. O., 2000. A Guide to Calibration and Adaptation, Highway Development and Management Series, Vol. 5, International Study of Highway Development and Management, World Roads Association, Paris
[6] Bennett, C. R., and Greenwood, I. D. 2001. Modelling Road User and Environmental Effects in HDM-4, Highway Development and Management Series, Vol. 7, International Study of Highway Development and Management, World Roads Association, Paris
[7] Jain, S. S., Aggarwal, S., and Parida, M., 2005. “HDM-4 Pavement Deterioration Models for Indian National Highway Network.” J. Transp.
Eng. 2005.131: pp 623-631.
[8] Ahmad, A., Jain, S. S., and Parida, M. 2013. “Updating Road User Cost and its Implication.” 2nd Int. Conf. on Emerging Trends in