DOI: 10.1534/genetics.106.064311
Quantitative Trait Loci
3
Maternal Cytoplasmic Environment Interaction
for Development Rate in
Oncorhynchus mykiss
Krista M. Nichols,*
,1Karl W. Broman,
†Kyle Sundin,* Jennifer M. Young,* Paul A. Wheeler*
and Gary H. Thorgaard*
,‡*School of Biological Sciences and Center for Reproductive Biology, Washington State University, Pullman, Washington 99164-4236, †Department of Biostatistics, Johns Hopkins University, Baltimore, Maryland 21205-2179 and‡School of Biological Sciences and
Center for Reproductive Biology, Washington State University, Pullman, Washington 99164-4236 Manuscript received August 2, 2006
Accepted for publication October 2, 2006
ABSTRACT
Effects of maternal cytoplasmic environment (MCE) on development rate in rainbow trout were evaluated within a quantitative trait loci (QTL) analysis framework. Previous research had identified QTL for development rate in doubled haploid (DH) progeny produced from a cross between the Oregon State University (OSU) and the Swanson (SW) River rainbow trout clonal lines. In this study, progeny for QTL mapping were produced from a cross between the OSU and Clearwater (CW) River clonal lines. Doubled haploids were produced from the OSU3CW F1by androgenesis using eggs from different females (or
MCEs); with androgenesis, the maternal nuclear genome was destroyed by irradiation and diploidy was restored by blocking the first embryonic cleavage by heat shock. All embryos were incubated at the same temperature and development rate quantified as time to hatch. Using a linkage map constructed primarily with AFLP markers, QTL mapping was performed, including MCE covariates and QTL3MCE effects in models for testing. The major QTL for development rate in the OSU3SW cross overlaps with the major QTL found in this OSU3CW cross; effects at this locus were the same across MCEs. Both MCE and QTL3MCE effects contribute to variability in development rate, but QTL3MCE were minor and detected only at small-effect QTL.
M
ATERNAL effects, or the influence of maternal resources and behavior on the environment and phenotype of developing embryos and young, can have significant implications for the evolution of develop-mental phenotypes in all taxa (for review, see Mousseauand Fox 1998). Female mate choice, maternal care,
maternal allocation of resources, maternal transfer of cytoplasmic factors to eggs and young, and the influ-ence of environment on female reproduction all have important implications for the survival of developing offspring. Maternal effects play an important role in the early development of salmonid fishes (Einum and
Fleming 2000, 2004; Brown et al. 2006; Pakkasmaa
et al. 2006; Wang et al. 2006), contributing both
en-vironmental and additive genetic effects to variability in offspring phenotype. Most studies in salmonids have focused on the maternal effects of egg size on the viabil-ity, survival, growth, and size of embryos and post-emergence fry (Bams 1967; Hutchings 1991; Einum
and Fleming1999, 2000). Maternal egg size appears to
have the greatest effects on size and growth during early embryonic development (Heath et al. 1999), but
investigators have failed to find a correlation between
egg size and development rate (Fergusonet al. 1985;
Einum and Fleming 1999). Furthermore, egg size
alone does not encompass many maternally derived egg components that may significantly affect development rate. More recently, using the same rainbow trout clonal line system described herein, variation in mitochon-drial haplotype in a constant nuclear background has shown significant association with variation in develop-ment rate, suggesting that the mitochondrial haplotype alone can influence the rate of development (Brown
et al. 2006). Here, we aim to determine if the egg source, or maternal cytoplasmic environment (MCE) in total, significantly affects the expression of quantitative trait loci (QTL) associated with development rate in
Oncorhynchus mykiss. Maternal cytoplasmic effects could include, but are not limited to, maternal hormones, mi-tochondrial DNA, and maternally derived RNA de-posited in the egg yolk.
The rate of development in the early life history of salmonids has important implications for fitness with respect to emergence timing and optimal conditions for foraging, predator avoidance, and migration (Einum
and Fleming2000; Sundstromet al.2004, 2005).
Sal-monid fishes suffer severe mortality when they emerge from the gravel nests in which they are fertilized (Elliot 1989). Emergence timing is also influenced
by spawning date in salmonids, but embryonic
1Corresponding author: Department of Biological Sciences, Purdue
University, 915 W. State St., West Lafayette, IN 47907. E-mail: [email protected]
development rate, thought to be adapted to local ther-mal environments (Tallman 1986; Beacham 1988;
Hebert et al. 1998), also has significant effects on
emergence size and timing. Fish that hatch earlier have a size advantage over fish that hatch later (Masonand
Chapman 1965), but timing of emergence must be
carefully balanced with conditions for food availability (Sundstromet al.2004, 2005). In addition to
correla-tion of development rate and early life history traits, investigators have observed a correlation among faster development rate, growth, and age at sexual maturity (Allendorfet al.1983).
Previous research has shown significant variation in the development rates among strains of rainbow trout (Fergusonet al.1985; Robison et al.1999).
Consider-able additive genetic variance for development rate has been revealed through quantitative genetic studies (Smoker 1986; Beacham 1988; Hebert et al. 1998),
and heritability has been reported as high as 0.23 in steelhead trout,O. mykiss(McIntyreand Blanc1972).
Many studies have shown that variation in development rate and survival prior to hatch is also significantly in-fluenced by maternal effects (McIntyre and Blanc
1972; Blancand Poisson1983; Smoker1986; Brown
et al.2006). Although a few experiments have revealed the role of single regulatory loci in development rate in some populations of fishes (Allendorf et al. 1983;
DiMicheleand Powers1991), the number and nature
of genetic loci influencing variation in embryonic devel-opment rate in other populations has only recently been investigated. More recently, a major QTL segregating for development rate, contributing up to 25% of the phenotypic variation, has been identified in a two dif-ferent crosses between clonal lines of rainbow trout (O. mykiss) (Robisonet al.2001; Martinezet al.2005;
Sundinet al.2005). Alleles in this genome region from
the male grandparent in both studies significantly increase the rate of development, shortening the time from fertilization to hatch.
The external fertilization and ease with which salmo-nid gametes can be handled to manipulate chromosome set numbers provide an excellent system for studying the effects of maternal cytoplasmic environment on developmental phenotype, independent of the direct transfer of maternal nuclear genes. Androgenetically derived isogenic strains of rainbow trout have been produced from outbred populations of interest in two generations (Younget al.1996). These lines have been
crossed to produce segregating doubled haploid indi-viduals by androgenesis in the second generation from F1hybrids and have provided the resources for linkage mapping and quantitative trait locus analysis of develop-mental phenotypes (Younget al. 1998; Robison et al.
2001; Nicholset al.2003). With androgenesis, the
ma-ternal nuclear genome is destroyed by irradiation (May
and Grewe 1993), irradiated eggs are fertilized and
activated with sperm, and diploidy is restored by
block-ing the first embryonic cleavage with a heat or pressure shock (Araiet al.1979; Parsonsand Thorgaard1984;
Bongerset al.1994; Younget al.1996). Androgenesis
with sperm from hybrids between lines with divergent phenotypes and different egg sources makes it possible to investigate the contribution of maternal cytoplasmic effects on the expression of QTL in doubled haploid families, independent of the direct transmission of the maternal nuclear genome.
In this study, we investigated whether development rate QTL exhibit significantly different additive effects in different MCEs. Robisonet al.(2001) revealed a
sin-gle QTL of large effect and a few QTL of small effect segregating for development rate in doubled haploid progeny produced from a cross between a hatchery-derived Shasta-type rainbow trout obtained from Oregon State University (OSU) and a semiwild strain of rainbow trout from the Swanson River, Alaska (SW). A difference in development rate also exists between the OSU clonal line and another clonal line derived from a Clearwater River steelhead trout (CW); introgression of this region using advanced backrosses of OSU3CW have shown the same region contributing to a significant proportion of variation in development rate (Sundinet al.2005).
Using doubled haploids produced from different egg sources, we have conducted a QTL analysis of develop-ment rate in a cross between OSU and CW to test the hypothesis that QTL by maternal cytoplasmic environ-ment interaction (QTL3MCE) significantly affect var-iation in development rate.
MATERIALS AND METHODS
Crosses and culture:Clonal line production: O. mykissclonal lines have been developed from outbred populations of in-terest in two generations by gyno- and androgenesis (Young
et al. 1996) and are maintained at the Washington State University Trout Hatchery. O. mykiss clonal families and F1
hybrids between these families were further propagated from existing clonal lines to characterize differences in develop-ment rate between two clonal lines and within isogenic families of clonal hybrids. The OSU clonal line is a Shasta-type rainbow trout line originating from an outbred stock maintained at a research hatchery at Oregon State University (Corvallis, OR). The OSU line was developed from genetic females by two rounds of gynogenesis, and thus all individuals in this line are genetic females (XX). The CW line originated from a hatchery stock of steelhead trout from the Clearwater River at the Dworshak National Fish Hatchery (Ahsahka, ID). The CW line was developed by androgenesis in two generations and all individuals are YY genetic males. For this study, OSU and CW clonal rainbow trout families were propagated by androgenesis at Washington State University in December 1999, as described by Younget al.(1996). Briefly, eggs from three outbred females
DNA inheritance, and embryonic development proceeded as in normal diploid embryos. One additional group of OSU clones (O3O) was made on December 7, 1999, by fertilizing clonal OSU eggs (from one female) with sperm from a sex-reversed clonal OSU male to evaluate differences in develop-ment rate between clones propagated by androgenesis and traditional fertilization. F1 hybrids were produced from the
same eggs as O3O clones on December 7, 1999.
Doubled haploid production: Doubled haploid progeny used for linkage and QTL analysis were produced from hybrids from a cross between the OSU and CW clonal lines. Eggs from one OSU female were fertilized with sperm from one CW male to produce a family of F1progeny. Sperm from the resulting F1
male hybrid clones was used to produce doubled haploid progeny by androgenesis, as described by Younget al.(1998).
Outbred eggs were obtained from Troutlodge in December 1999 and from the Spokane State Fish Hatchery (Washington Department of Fish and Wildlife, Spokane, WA) in January 2000. Eggs from each of three outbred females from Trout-lodge (TL) and from each of six outbred females from the Spokane (SP) hatchery were irradiated with gamma irradia-tion to destroy the maternal nuclear DNA. Irradiated eggs were fertilized with sperm from the same F1hybrid male on
December 8, 1999, and on January 18, 2000, respectively. During embryonic development, the first embryonic cleavage was blocked by heat shock to restore diploidy. Families of doubled haploids are named according to the population (TL or SP) followed by a number indicating the female within populations used to produce the families (1–3 for TL and 1–6 for SP); unique names correspond to individual MCEs.
Culture: Fertilized eggs for clonal lines, hybrids, and dou-bled haploid families were maintained in recirculating stack egg incubators in a climate-controlled chamber. Water tem-perature was maintained at 11°and was monitored either by StowAway XTI temperature loggers every 9 min or manually by thermometer at each check on the embryos. Each cross and family was separately maintained in multiple enclosed boxes in the incubator within the same incubator tray. Previous evalua-tions of embryonic development rate among divergent clonal lines have not exhibited statistically significant box effects on the time to hatch (B. Robison, personal communication).
Embryos were maintained in constant darkness, except during periodic removal of inviable embryos.
Phenotyping:Embryonic development rate was quantified as time to hatch, which correlates with the relative rate of ap-pearance of important development stages (Fergusonet al.
1985). Once eye pigmentation was visible, embryos were trans-ferred to individual wells in an 80-well box within the stack incubators (Robisonet al.1999). Both clonal line and doubled
haploid embryos were checked at 4-hr intervals once hatching began, as described by Robisonet al.(1999). At each interval,
hatched individuals were counted and moved to separate enclosed boxes so that female family (or MCE), cross, and hatch time were identical for all individuals in each box. Time to hatch (tth) was calculated for each fish as accumulated tem-perature units (ATU), where ATU (degree days)¼ (incuba-tion temperature)3(days from fertilization to hatch).
Notes on gross skeletal and yolk-sac deformities were made on each fish at swim-up at the time fin clips were taken for geno-typing. Deformities noted included abnormal curvature of the spine, craniofacial abnormalities, and yolk sac abnormalities.
Genotyping: Fin clips were taken nonlethally from swim-up fry when yolk-sac absorption was complete. Clips were pre-served in 95% ethanol. DNA was extracted with a Puregene DNA extraction kit (Gentra Systems, Minneapolis). Amplified fragment length polymorphic (AFLP) markers were screened on all individuals according to the methods of Voset al.(1995)
as modified by Robisonet al.(2001). FourteenEcoRI andMseI
primer sets were used. These primer sets contained syntenic markers mapped in our other crosses in the laboratory (Young
et al.1998; Robisonet al.2001; Nicholset al.2003), which all
share the OSU maternal parent. AFLPs are named according to the13 selective bases used for theEcoRI andMseI adapter primers. The number at the end of the marker name indicates either the AFLP size for those markers mapped in other crosses or an arbitrary number given to the band on the AFLP fingerprints. The final characters for syntenic loci indicate the parent in which the band was present (for those markers syntenic with those in other crosses): ‘‘o’’ for OSU, ‘‘a’’ for Arlee, ‘‘c’’ for Clearwater, and ‘‘s’’ for Swanson. Markers that are codominant end with an ‘‘o*.’’ ‘‘E’’ at the beginning of some of the names indicated theEcoRI six-cutter enzyme, following the convention of Younget al.(1998). In addition to AFLP
mark-ers, three other markers were genotyped. Two microsatellite markers,OMM1009(Rexroadet al.2001) andOmyFGT12TUF
(Nicholset al.2003), were genotyped by size separation on a
1.5% agarose gel. These markers were added to AFLP markers on the basis of inferred synteny from other rainbow trout maps in the region of the major development rate QTL. In addition, one known gene, growth hormone 1 (GH1; (Oakley and
Phillips1999), identified as a potential candidate gene for
development rate, was genotyped by the identity of a single nucleotide polymorphism (SNP) in intron C.GH1SNP geno-types were detected by the ABI SNaPshot technique (Applied Biosystems, Foster City, CA).
Statistical analyses: Summary statistics:Difference in time to hatch among clones was tested by one-way analysis of variance, and pairwise differences among clones was tested with a Tukey– Kramer test (PROC GLM, SAS Institute, Cary, NC). For the doubled haploid progeny, analysis of variance was conducted to test the significance of maternal population (TL and SP), MCE nested within population, and deformity effects on time to hatch. Tests for significance of population effects were made within a mixed model (PROC MIXED, SAS Institute), treating MCE as random effects nested within populations and estimat-ing the degrees of freedom for the denominator of the test sta-tistic using Satterthwaite’s method. Given no fixed differences between populations, least-squares means were used to test sig-nificance among all pairs of female families or MCEs in the dou-bled haploid (DH) analysis using a Tukey–Kramer test (PROC GLM, SAS Institute). Difference in the incidence of deformity among MCEs was tested using logistic regression (PROC LOGISTIC, SAS Institute). Type I error rate was set ata¼0.05. Genetic map construction:Prior to map construction, segre-gation distortion or deviation from expected 1:1 Mendelian segregation ratios was tested for each marker with ax2test (a¼
0.05). Markers with significant segregation distortion were checked for scoring errors and reliability and were corrected or, if unreliable, were removed from the analysis. For the com-bined data set of all families, markers for which,80% of in-dividuals were scored were removed prior to linkage analysis. Markers were grouped and then ordered into linkage groups using the Kosambi map function for the doubled haploid de-sign in Mapmaker for Mac (v. 2.0, Scott Tingey, Dupont Experimental Station, Wilmington, DE) and Mapmaker/EXP (Lander et al.1987). Linkage groups were formed by
placing each marker in the position giving the maximum like-lihood, taking the framework markers and all previously placed markers as fixed. Orders of the larger groups were then checked further by considering all possible orders of a sliding window of seven markers, keeping markers outside the window in a fixed order. The final map was drawn with Mapchart 2.1 (Voorips2002).
QTL analyses: QTL analyses for development rate were performed combining the analysis for all MCEs, using interval mapping and multiple QTL mapping within R/qtl (Broman
et al. 2003). Because R/qtl does not include a model for doubled haploids, a backcross model coding for the doubled haploids was used since models for both cross types utilize two genotypic classes for tests of significant QTL effects. Standard interval mapping (scanone) was performed testing for signif-icant single-locus effects, with MCE effects included as additive covariates in the model. Analysis was performed at the markers and on a 1-cM grid along the genome. Significant loci were identified as those with LOD scores exceeding the 95% upper tail of distributions generated by 1000 permutations of the data (Churchilland Doerge1994). The MCE effects were
preserved in this permutation test: the MCE to which a par-ticular phenotype was assigned was retained, and the genotype data were shuffled across all individuals.
We further performed a form of composite interval map-ping (Zeng1994): highly statistically significant loci were
in-cluded as marker cofactors in a scan for additional QTL on chromosomes that did not show significant QTL in standard interval mapping. Controlling for large-effect QTL in this way can reduce the residual variation and allow loci of more modest effect to be more clearly seen.
A two-dimensional, two-QTL scan was also performed. This allows the identification of interacting QTL with limited main effects, which would remain hidden in the single-QTL analysis, and also an assessment of evidence for multiple linked QTL that appear as a single peak in the single-QTL analysis.
Once single and interacting QTL were identified, QTL posi-tions were refined on the linkage groups using the approach used in multiple interval mapping (Kaoet al.1999), iteratively
refining the position of each QTL, one at a time, in the context of a multiple QTL model (with all other significant QTL, QTL3QTL interactions, and MCE covariates in the model) until the QTL positions converged. Positions with the greatest LOD score (and lowest significantP-value) on each linkage group with a significant QTL (from composite interval map-ping) were chosen as the starting positions for the refinement of QTL positions. To increase our power for the detection of locus by MCE (QTL3MCE) for very small-effect loci, tests for QTL3MCE effects were made only at significant QTL posi-tions, including MCE covariates and large-effect QTL as co-variates. To do this, the full model containing QTL, MCE, and QTL3 MCE effects were compared to the reduced model containing only QTL and MCE effects, subtracting the LOD scores. Significance of QTL3MCE interactions were deter-mined by permutation tests conducted only for the positions tested. The MCE effects were preserved in the permutations, but the QTL effects were eliminated, and so we use as the reference the distribution of the LOD score for the QTL3 MCE interaction in the absence of either the interaction or the marginal QTL effect. The fact that the main and interaction effects are orthogonal suggests that the null distribution of the QTL3MCE interaction LOD score will be approximately the same, whether or not a marginal QTL effect is present, and so this permutation test is appropriate.
To estimate the effects of multiple quantitative trait loci detected in our prior analyses, we utilized a drop-one-term multiple imputation analysis (Sen and Churchill 2001),
simultaneously estimating all significant epistatic, MCE, and
QTL3MCE effects. To do this, genome positions selected from our refined multiple interval mapping analysis, MCE covariates, and significant QTL3MCE effects were chosen for model testing. Multiple QTL models were used to test for the significance of the main effects of QTL and MCE, for inter-action effects between MCE and QTL, and for all possible epi-static interactions among QTL, evaluating the full-effects model in comparison with the reduced model with each term (and all higher-order terms including that term) dropped. Significant terms were evaluated in a reduced model and addi-tive effects (6standard errors) and percentage of variation explained were estimated. QTL analyses for the incidence of deformity, coded as a binary trait, were also performed as described above, utilizing the binary model for analyses.
To test whether or not QTL identified in this cross (OC) overlapped with those found by Robisonet al.(2001) in the
OSU3Swanson (OS) cross, 2-LOD support intervals for QTL position in OS were constructed and evaluated for overlap with 2-LOD support intervals for QTL position in this OC cross. Two-LOD support intervals have been shown to be.95% C.I. (Liu1998) and asymptotically represent 99.8% C.I. (Visscher
et al.1996).
RESULTS
Phenotypic differences among clonal lines:Analysis of variance for differences among clonal lines revealed a highly significant difference in the development rate between the OSU and CW lines. OSU clonal families de-veloped at a much slower rate, hatching later relative to the CW clonal families; F1hybrids were intermediate in the time to hatch (Table 1). No difference was observed between CW clonal families produced from the eggs of TL1 or TL3. OSU embryos produced from TL1 had sig-nificantly slower development rates than those pro-duced from TL3 eggs. However, the sample size for TL1 was very small for the OSU family (n¼13). No dif-ference was observed between the average development rate of androgenetic and intercrossed OSU (O 3 O) clones (Table 1). TL2 female eggs were inviable for both the clonal lines and the doubled haploids.
Phenotypic differences among DH families: Eight doubled haploid families produced from different out-bred egg sources were intermediate in development rate compared to OSU and CW clonal lines (Table 2). Population differences observed in the overall model were attributed to differences among individual MCE within the populations; when the hypothesis for pop-ulation main effect was tested using nested MCE as the error term, population-level effects were not observed (F¼2.77, d.f. ¼1,P¼0.1454). Given no fixed effect of population, MCE effects were tested. MCE, nested within population, was a significant source of variation in development rate (F¼10.64, d.f.¼6,P,0.0001). The presence or absence of deformity did not signifi-cantly contribute to the variability in time to hatch (F¼
SP5, and SP6 (Table 1). This observation is consistent with that observed between OSU clones produced with TL1 and TL3 eggs (above). A significant difference in the incidence of deformities was observed among MCE (Table 2;x2¼18.07, d.f.¼7,P¼0.0117).
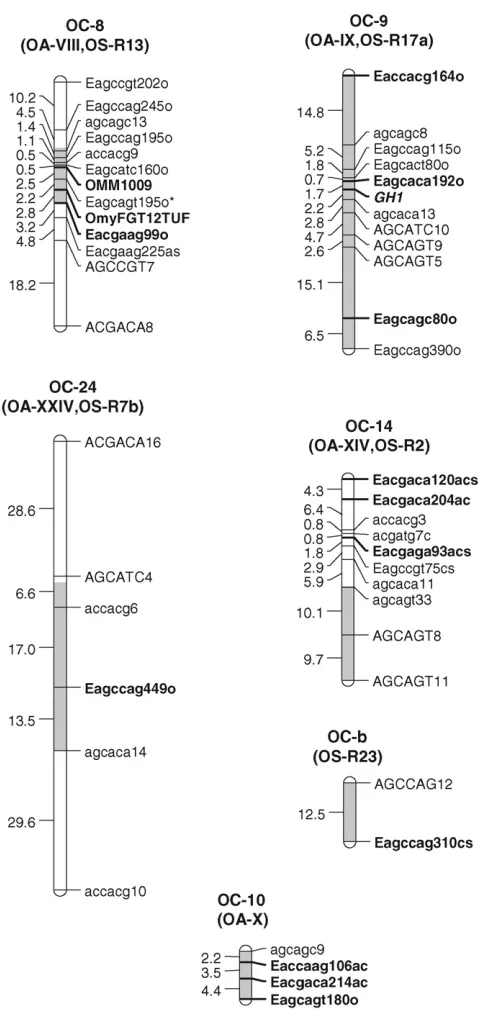
Genetic map construction: With 184 AFLP, two microsatellites, and one known gene in the linkage analysis, 28 linkage groups were identified (Figure 1). On the basis of the karyotypes of the OSU and CW lines, we would expect 29 linkage groups to result with linkage mapping. OSU has 60 chromosomes and CW has 58, and it is expected that 2 chromosomes from OSU would pair with the homologous fused pair of chromosomes from CW during meiosis (Ristowet al.1998; Phillips
et al.2005). This fusion results in the joining of markers from OA linkage groups IV and XXV into a single linkage group OC-4-25 in the OSU3CW cross. Of the total number of markers genotyped, 172 were mapped on the linkage groups identified and 15 remained
un-linked. The average intermarker distance was 9.7 cM. Of the 28 linkage groups, 26 match to linkage groups delineated from our OSU3Arlee (OA) doubled hap-loid mapping panel (Younget al.1998; Nicholset al.
TABLE 1
Development rate means for clonal lines and hybrids
Family N
Time to hatch (ATU) (mean6SEM)
CW clones (TL1) 70 291.361.0 (a)
CW clones (TL3) 35 292.461.3 (a)
OSU clones (TL1) 13 352.463.1 (b)
OSU clones (TL3) 54 339.161.5 (c)
OSU3OSU clones 47 334.961.0 (c)
F1hybrid clones 32 304.361.0 (d)
Tukey groupings of significantly different means are indi-cated by lowercase letters in parentheses in ‘‘Time to hatch’’ column. TL, eggs from Troutlodge; SP, eggs from Spokane Hatchery.
TABLE 2
Embryonic development rate means for doubled haploids produced from different outbred female
egg sources or MCEs
MCE N
Time to hatch (ATU)
(mean6SEM) % deformed
TL1 53 331.162.3 (a) 28.3
TL3 109 318.261.2 (bd) 18.4
SP1 82 321.161.0 (bc) 15.8
SP2 83 316.161.3 (bcd) 19.3
SP3 29 316.162.0 (bcd) 13.8
SP4 8 322.862.5 (abcd) 12.5
SP5 22 316.262.2 (bcd) 36.4
SP6 168 314.360.8 (d) 8.9
Tukey groupings for significant differences between means are indicated by lowercase letters within parentheses; shared letters indicate a nonsignificant difference between means. Development rate means are expressed as ATUs from fertiliza-tion to hatch. TL, Troutlodge females; SP, Spokane Hatchery females.
Figure 1.—OSU 3 CW doubled haploid linkage groups
2003) on the basis of shared AFLP and microsatellite markers. All but one linkage group upon which signif-icant QTL were identified have been matched to the OA map. The mapping of the sex phenotype in a small subset of these individuals that were grown to sexual maturity placed sex on the linkage group OC1 and shared AFLP markers in other mapping families of OSU3CW corroborate the synteny of the sex linkage groups of OA and OC (Felip et al.2005). In addition,
markers mapped from additional AFLP primer sets in additional studies with OC progeny indicated synteny of OC3, OC5, OC11, OC12, OC16, OC17, OC24, OC29, and OC31 with their homologous OA linkage groups (K. M. Nichols, unpublished data). Markers with
syn-teny between this OC map and the OSU 3 Swanson
(OS) map (Robisonet al.2001) have also been matched,
including markers on all linkage groups for which OS progeny showed significant development rate QTL. Of the 27 linkage groups from the OS cross (Robisonet al.
2001), 18 matched to linkage groups in this cross on the basis of syntenic AFLP markers. One additional linkage group, OC11, matched to the OS linkage group R22 on the basis of an additional marker mapped in another study with OC progeny (K. Nichols, unpublished data).
Only two linkage groups in this study, OC-a and OC-b, remained unmatched to linkage groups in the OA (Younget al.1998; Nicholset al.2003). Linkage group
OC8, upon which the largest QTL was identified in this cross, matched to linkage group OA-VIII and to the OS linkage group R13 (Figure 2). This linkage group is syntenic with linkage groups J and N in an unrelated outcrossed rainbow trout mapping panel on the basis of the syntenic microsatellite markers OMM1009 and OmyFGT12TUF (Nicholset al. 2003). Neither of the
other linkage groups identified with significant QTL in OS, R6, and R9 (corresponding to OC23 and OC-a in this cross, respectively), were syntenic with OC linkage groups for which significant QTL were identified;
how-ever, a reanalysis of this data accounting for tempera-ture environmental effects in the mapping families (Martinezet al.2005) show QTL for time to hatch on
OSU3 SW linkage groups R6, R13, and R17a. R17a is syntenic with linkage group OC-9 in this article.
QTL analyses:In the genomewide single-QTL scan, six significant QTL were identified. Simple interval mapping with MCE covariates revealed a major QTL on OC-8, calledtth-OC-8a(Figures 1 and 2). Composite interval mapping, including both major QTL,tth-OC-8a, and MCE effects as covariates, revealed additional small-effect QTL on OC-9, OC-10, OC-14, and OC-24 (Figures 1 and 2). The same QTL were identified in both the full data set, and a pruned data set that included only MCEs with a sample size ofn.50 (data not shown). No QTL were detected for presence/absence of deformity (data not shown). Tests for QTL3MCE at significant main-effect QTL revealed that two loci (tth-OC-14 and
tth-OC-b) exhibit minor, but significant, differences in genotypic effects among MCE (Figure 2) on the basis of permutation tests conducted at each significant locus.
Although QTL 3 MCE appears significant on OC-9
(Figure 2), the position showing this trend is not at the peak of the QTL for this linkage group. To increase the power to detect QTL3MCE interactions, we tested for such interactions only at the position with the greatest QTL effect, and so the QTL 3 MCE interaction in-volving tth-OC-9 was not included in the final model. Genotypic effects at the significant QTL 3 MCE loci (tth-OC-14andtth-OC-b) indicate that significant QTL3 MCE arise from QTL of no effect in some MCEs and of small effects in others (Figure 3). The MCE TL1 was the greatest contributor to evidence for a QTL 3 MCE interaction. TL1 have a much larger effect on QTL tth-OC-14andtth-OC-bthan all other MCEs, which have little or no additive effects at these loci (Figure 3). Two-dimensional scans for linked QTL on linkage groups for which significant QTL were detected revealed a
Figure2.—Composite interval mapping LOD
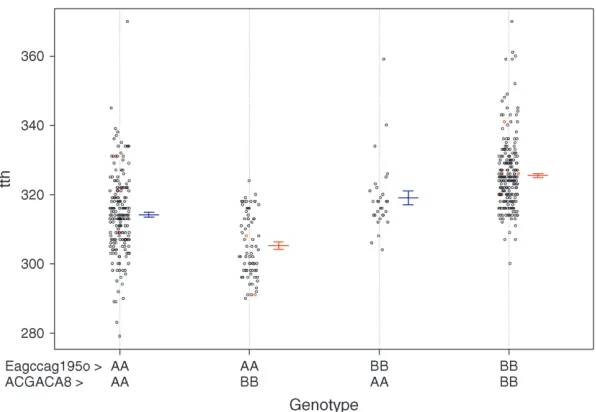
significant epistatic interaction (nonadditive gene ac-tion) between tth-OC-8a, and another QTL, tth-OC-8b, with only epistatic effects also on OC-8 (Figure 4); the joint QTL–QTL LOD score was 56.98 and the epistasis LOD score was 12.47. Gene–gene combinations of the CW genotype at tth-OC-8a and the OSU genotype at
tth-OC-8bon the end of the chromosome are associated with significantly earlier time to hatch relative to all other gene combinations (Figure 5). Two-dimensional scans on other linkage groups indicated that only one QTL existed on each of the other linkage groups and that no significant interactions existed among detected QTL. When all six QTL, identified from one- and two-dimensional scans, were included in a single model,
each was seen to contribute to variation in the pheno-type (Table 3). Furthermore, QTL3QTL interactions, MCE, and QTL3MCE interactions were also shown to play a role in variation in time to hatch, as seen in Table 3, which contains the results of an analysis in which each term in the model was omitted, one at a time. (Note that when a particular effect was omitted, all interactions containing the effect were also omitted; the term TL1 has 3 d.f., as the LOD score for TL1 concerns a comparison of the full model to the reduced model in which TL1 and its interaction with each of the OC-14 and OC-b loci were omitted.) All six-way and lesser epistatic interactions among QTL were tested, but only one two-way interaction among loci was identified. The
Figure3.—Additive effect means (6standard
errors of the mean) for QTL exhibiting signifi-cant QTL3MCE interaction effects.
Figure 4.—Two-dimensional scan for
P-values in Table 3 are pointwise and so do not include an adjustment for the selection of the model; a complete account of the model selection in the assess-ment of multiple QTL models is difficult, butP-values ,0.0001 indicate good evidence for the respective terms. As seen above, and further corroborated by these multiple QTL models, environmental effects from the female egg source (MCEs) were a significant source of variation in time to hatch, explaining up to 13.0% of the variation in time to hatch in the case of female TL1 (Table 3). QTL3 MCE effects were a significant, but minor, source of variation in time to hatch, explaining up to 1.45% of the variation in time to hatch (Table 3). The major QTL,tth-OC-8a, was responsible for the single
largest effect on time to hatch, accounting for 23.2% of the variation in phenotype. Differences in the genotypic means at this locus [OSU (BB)–CW (AA)] are 11.656 1.07 degree days; individuals with the CW genotype at this locus have a mean hatching time1 day earlier (at 11°) than individuals with the OSU genotype. The final reduced model, with only significant terms including
QTL, MCE, QTL3QTL, and QTL3MCE, explained
53.1% of the variation in time to hatch and was highly significant (LOD¼91.1, d.f.¼12,P,0.0001). These results suggest that the maternal cytoplasmic environ-ment can differentially affect the expression of minor-effect QTL for development rate and that MCE alone has a significant influence on development rate.
Figure5.—Joint genotypic or epistatic effects
of two loci on linkage group OC-8. Each point is an individual; red symbols were calculated from imputed genotypes in missing individuals. Means and standard errors of the means are plotted next to each cloud of points.
TABLE 3
Multiple QTL modeling analysis of variance for significant model terms
Model terms
Closest
marker d.f.a LOD % variation x2P-value
Genotypic effects
Term Position (cM) (ATU; degree days) SE
tth-OC-8a 16 Eagccag195o 2 48.41 23.2 ,0.0001 11.65 1.07
tth-OC-8b 51.9 ACGACA8 2 12.91 5.31 ,0.0001 0.6686 1.0674
tth-OC-9 18 Eagccag115o 1 1.84 0.722 0.004 2.158 0.782
tth-OC-10 10.1 Eagcagt180o 1 1.67 0.656 0.006 2.603 0.891
tth-OC-14 39 AGCAGT11 2 2.90 1.14 0.001 1.07 0.81
tth-OC-24 47 Eagccag449o 1 3.19 1.26 0.00012 2.876 0.813
tth-OC-b 11 Eagccag310cs 2 4.92 1.96 ,0.0001 1.337 0.976
tth-OC-8a3tth-OC-8b 16351.9 1 10.46 4.26 ,0.0001 15.02 2.15
TL1 3 29.46 13 ,0.0001 13.35 1.56
SP1 1 5.43 2.17 ,0.0001 5.271 1.057
tth-OC-143TL1 1 1.69 0.665 0.005 7.061 2.946
tth-OC-b3TL1 1 3.65 1.45 ,0.0001 11.18 3.47
SE, standard error of genotypic effects; ATU, genotypic effects expressed as accumulated temperature units; % variation, percentage of variation explained by model term and all higher-order terms containing that term.
a
Synteny with the major development rate QTL previously identified: The major QTL on OC-8 is in the same QTL region as that identified for time to hatch in the doubled haploid mapping population derived from a cross between OSU and Swanson clonal lines (Robisonet al.2001) on the basis of the overlap of the
2-LOD support interval for the OS cross with the 2-LOD support interval fortth-OC-8a in this cross (Figure 6). QTL mapping in the OSU3CW cross was conducted with a greater number of progeny (n ¼554) than the OSU3SW study (n¼170), and this increase in power shows a more precise localization of the QTL for time to hatch in this study. Additionally, minor-effect QTL for development rate were detected in the same region on linkage groups OC-9 in this cross and R17a in the OSU3 SW cross (data not shown) (Martinezet al.2005).
DISCUSSION
This QTL analysis of development rate has revealed that the major QTL segregating in the cross between the OSU line and a clonal line derived from the SW line (Robison et al. 2001) is likely also segregating in this
cross between OSU and a clonal line derived from the CW line (Sundinet al.2005). Fine-scale mapping and
identification of genes are needed to determine if indeed the same genes are responsible for
developmen-tal timing in these two crosses. This major QTL alone is responsible for 12° days, or 1 day shift for earlier development rate in individuals with the CW genotype relative to individuals with the OSU genotype at this locus. The fact that the same major QTL may be segregating in these two line crosses is not completely surprising, however, since the same female line (OSU) was used in both analyses. The most parsimonious explanation for the similar results in the two studies is that the OSU line has a constant effect at this QTL that causes a slower development rate relative to the paternal lines CW and SW, which have originated from geo-graphically distinct populations. Across the salmonid genome, great differences exist in male and female recombination rates. Males usually have much smaller recombination rates in the centromere regions, and greater recombination rates than females toward the telomeres (Sakamoto et al. 2000; Danzmann et al.
2005). However, the major QTL region for development rate is in an area of greatly reduced recombination in both males and females (Danzmann et al. 2005).
Furthermore,tth-OC-8acolocalizes to the same region as spawn-timing QTL in rainbow trout on the basis of synteny among rainbow trout linkage maps (O’Malley
et al.2002; Danzmannet al.2005; Lederet al.2006). The
greatly reduced recombination rate in this QTL region, together with colocalization of QTL for an important reproductive life-history trait suggests the possible exis-tence of a large gene complex in this region, responsible for the expression of multiple, correlated life-history traits in this species. Further detailed mapping and sequencing in this region is needed to address this hypothesis.
With a growing number of genes and ESTs mapped in rainbow trout, synteny among allO. mykisslinkage maps (Younget al.1998; Sakamotoet al.2000; Nicholset al.
2003; Danzmann et al. 2005) may reveal possible
can-didate genes for development rate in this region. One known gene,Clock, is currently mapped to this region (Danzmannet al.2005; Lederet al.2006).Clockplays a
well-known role in circadian rhythms in animals, and expression of this gene is likely entrained by oscillations in daily light cycles. Photoperiod is tightly associated with maturation, spawning, and developmental meta-morphosis in many organisms, including the salmonid fishes, but the role of this gene in the rate of develop-ment needs further exploration. Robison et al.(2001)
ruled out the possibility that liver PGM1, an allozyme variant associated with faster development rate in a hat-chery strain of rainbow trout (Allendorfet al.1983),
was associated with development rate divergence be-tween the OSU and SW clonal lines. Expression of liver PGM1 was not evaluated in this cross. Aside from the single major QTL identified in most maternal environ-ments in this study, five other QTL of much smaller effects were identified, and some of these show signif-icantly different effects among maternal cytoplasmic
Figure6.—Comparison of OSU3CW linkage group OC8
with syntenic OSU3 SW linkage group R13, with localized time-to-hatch QTL. The OSU 3 SW linkage group was re-drawn from Robisonet al.(2001). Cross-hatching indicates
environments. Only one QTL of smaller effect was found on a linkage group syntenic with small-effect QTL identified in more recent analyses of the Robison
et al.(2001) data (Martinezet al.2005). It is possible
that the two crosses have different genes of small-to-moderate effect modulating embryonic development rate or that maternal or other environmental factors play a significant role in the expression of small-effect loci.
Most studies that have tested the formal hypothesis of QTL by environment interaction by testing equal QTL effects across environments have utilized recombinant inbred lines (Fryet al.1998; Leipsand Mackay2000;
Vieiraet al.2000; Borevitzet al.2002). These lines
af-ford replication of individuals with identical genotypes (at all loci) in different environments for formal tests of equal additive effects among environments within the maximum-likelihood models developed for composite interval mapping ( Jiangand Zeng1995). Other studies
have evaluated QTL by environment interactions by performing QTL analyses in each single environment, overlaying the results on a common map to determine whether QTL identified in single environments are shared across environments. In this study, we have gen-erated doubled haploid individuals for our QTL anal-ysis. The generation time and space required for the propagation of each of these doubled haploid individ-uals into doubled haploid lines is a monumental task for rainbow trout; thus we must test initial hypotheses for significant QTL in the first generation of doubled hap-loids. Among the types of crosses that have been utilized for QTL mapping, the doubled haploid design is the most powerful (Beavis 1998; Martinez et al. 2002).
Rather than overlay results from multiple independent models, we formally tested MCE and QTL3MCE ef-fects within a single model. With this formal modeling approach, we have identified small-effect loci that show differential genotypic effects among maternal cytoplas-mic environments.
Our QTL3MCE results suggest that minor QTL are significant in some, but not all, maternal cytoplasmic environments. The differences observed in MCEs could be due to the disparity in sample sizes (and thus power). QTL effects have been shown to be distributed in a negative exponential fashion, such that QTL of large effect are relatively few, and QTL of very small effect relatively numerous (Lynchand Walsh1998 and
refer-ences therein). The power of QTL studies can signifi-cantly affect the ability to detect QTL of small-to-moderate effect and can lead to an upward bias in estimates of QTL effect and percentage of variance explained for the loci that are detected (Beavis 1998). This may have
been the case for MCEs with small sample sizes relative to SP6, but there are a few QTL of small effect identified in MCEs with smaller sample sizes that were not de-tected in SP6, suggesting significant environmental ef-fects on the expression of QTL in the different maternal cytoplasmic environments. The maternal cytoplasmic
effects in this study indicate differences in the magni-tude, rather than in the direction, of additive effects among mothers. These effects are not nearly as striking as the opposite effects of QTL in different environments observed in Drosophila (Leips and Mackay 2000;
Vieiraet al. 2000), but antagonistic pleiotropy is not
common in studies detecting significant QTL3 envi-ronment interaction (Fry et al. 1998; Borevitz et al.
2002).
Previous research on the maternal influence on off-spring in salmonids has focused primarily on dif-ferences in progeny survival, growth, and size with differences in female egg size. Differences observed in these characters have primarily been attributed to egg size or the amount of resources available to the develop-ing embryo (Smoker 1986; Hutchings 1991; Einum
and Fleming1999; Heathet al.1999; Vandeputteet al.
2002), but studies in brown trout (Einumand Fleming
1999) and brook trout (Hutchings 1991) have not
found significant correlations between egg size and de-velopment rate. While these studies may address mater-nal effects as a function of resource quantity in eggs, quality and quantity of other maternal cytoplasmic fac-tors that may be independent of egg size also play a large role in embryonic development.
Research in many organisms has shown that mito-chondrial haplotype (Gerberet al.2001; Brown et al.
2006), maternal hormones (Eisinget al.2001), and
ma-ternal mRNA in eggs (Nagler 2000) can influence
embryonic development. Variation in mitochondrial haplotypes can affect rate of development, oxygen con-sumption, growth, and fitness independent of nuclear genetic background as well as by interaction with the nuclear genome (Gerberet al.2001; Brownet al.2006;
and references therein). Androgens, corticosteriods, and thyroid hormones are among the maternally de-rived hormones with significant roles during embryonic development in vertebrates. Maternal androgens in bird eggs have been shown to influence hatching time, sur-vival, and behavior (Eising et al. 2001). Maternal
cor-ticosteriods have been shown to affect growth rate pulses in damselfish prior to hatching (McCormick
and Nechaev2002), but this study and a study in coho
salmon (Stratholtet al.1997) did not find differences
in hatching time or development rate as a result of maternal corticosteroids. Maternal thyroid hormones in eggs have long been known for their role in growth and metamorphosis in teleosts and other vertebrate animals (Dickhoffet al.1990 and references therein). In
rain-bow trout, maternal mRNA has been shown to direct the progression of embryonic development until gastru-lation when transcription of the embryonic nuclear genome begins (Nagler2000). Genomic imprinting or
species. In fact, on the basis of results from this study and numerous other fish species, the successful produc-tion of viable offspring from all-paternal (androgenesis) or all-maternal (gynogenesis) inheritance clearly shows that both genomes and the associated epigenetic differ-ences are not necessary for normal development in fish species in which it has been studied (McGowan and
Martin1997).
Despite the number of studies investigating the ef-fects of these maternal efef-fects on the fitness and physiol-ogy of developing organisms, few studies have examined these effects in a constant nuclear genetic background. Among the studies in fishes evaluating maternal effects on embryonic development rate, only two have tested maternal differences within a constant nuclear genetic background. Bongerset al.(1995) found differences in
the incidence of deformity and survival among embryos of different egg sources used to produce androgenetic clones of carp (Cyprinus carpio), as was observed in this study. These authors suggest the possibility that mater-nal RNAs in batches of eggs from different females might be differentially damaged by the irradiation used to destroy maternal nuclear DNA in the process of an-drogenesis. However, their experiment did not ascertain if differences observed among females in deformities and survival were due to reduced homeostasis due to the homozygous nature of the embryos, differences in mitochondrial–nuclear interactions, differences in egg nutritional quality, or differences in the quantity and nature of maternal factors deposited in the eggs. In our laboratory, Parsonsand Thorgaard(1984) found no
statistical differences in the survival of rainbow trout produced by gyno- or androgenesis, but sublethal effect differences on the time to hatch have not been evaluated (although we observed no significant difference in de-velopment rate between O3O and OSU androgenetic clones in this study). Separating components of mater-nal cytoplasmic factors into environmental and mito-chondrial genetic effects (either direct effects of the mitochondrial genome or mitochondrial–nuclear in-teraction) is difficult. However, using our rainbow trout clonal lines, Brownet al.(2006) were able to evaluate
differences in developmental rate and physiology in a constant nuclear and cytoplasmic (extramitochondrial) background with variable mitochondrial haplotypes. Variable oxygen consumption and rate of development were significantly associated with mitochondrial haplo-type, even in eggs produced from the same second-generation female clonal line (OSU line) possessing different mitochondrial genomes; in these females, mitochondria are different, but a constant nuclear back-ground minimizes maternal genetic effects, either by mtDNA–nuclear interaction or in the deposition of ma-ternal mRNA in the eggs. Each of these studies suggests that cytoplasmic factors may play a significant role in modulating nuclear genes associated with the rate of em-bryonic development rate. Further studies examining
the effects of mitochondrial haplotypes, hormones, and mRNA within a constant nuclear genetic background may elucidate the role and significance of each factor in modulating embryonic gene expression.
Although tth-OC-8a, uninfluenced by QTL 3 MCE interaction, has the largest contribution to the variance in the phenotype, this study suggests that maternal cyto-plasmic components can also affect the time to hatch, independent of the direct transmission of the maternal nuclear genome. The production of doubled haploid families from different females by androgenesis has provided a unique opportunity to assess the significance of maternal factors in the expression of QTL. Our re-sults suggest that future QTL analyses should be care-fully designed to consider or account for the effects of both maternal environmental factors alone and mater-nal3QTL interaction on phenotypic variability. It is not known whether the maternal effects observed here are the results of nongenetic maternal influences (age or nutritional status), whether the mother’s genome has directly and significantly affected the environment of the egg by differential deposition of mRNA or other cytoplasmic factors such as hormones, or whether ma-ternal mitochondrial–nuclear interactions exist. If the maternal effects observed in this study have been de-rived indirectly from nuclear or directly from mitochon-drial genes of the female, maternal influence may prove to be a significant selective agent in the survival of developing embryos and fry.
The authors thank Sara Johnson and Steve Patton for laboratory and hatchery assistance. Barrie Robison provided useful discussions on the quantitative genetic analysis of development rate as well as comments on drafts of this manuscript. Thanks to Marc Evans and Julia Sharp for discussions on statistical analyses. Caird Rexroad and Ruth Phillips generously provided aliquots of primers forOMM1009andGH1, re-spectively. Comments of anonymous reviewers significantly improved the manuscript. This research was funded by the National Science Foundation to G.H.T. (IBN-0082773), in part by National Research Initiative grant no. 2006-35205-16728 from the United States Depart-ment of Agriculture Cooperative State Research, Education, and Ex-tension Service to G.H.T., and in part by the National Institutes of Health to K.W.B. (R01, GM074244).
LITERATURE CITED
Allendorf, F. W., K. L. Knudsenand R. F. Leary, 1983 Adaptive
significance of differences in the tissue-specific expression of a phosphoglucomutase gene in rainbow trout. Proc. Natl. Acad. Sci.80:1397–1400.
Arai, K., H. Onozatoand F. Yamakazi, 1979 Artificial androgenesis
induced with gamma irradiation in masu salmon,Oncorhynchus masou.Bull. Fac. Fish. Hokkaido Univ.30:181–186.
Bams, R. A., 1967 Differences in performance of naturally and
ari-tifically propagated sockeye salmon migrant fry, as measured with swimming and predation tests. J. Fish. Res. Board Canada24:
1117–1153.
Beacham, T. D., 1988 A genetic analysis of early development in
pink (Oncorhynchus gorbuscha) and chum salmon (Oncorhynchus keta) at 3 different temperatures. Genome30:89–96.
Beavis, W. D., 1998 QTL analyses: power, precision, and accuracy,
Blanc, J. M., and H. Poisson, 1983 Parental sources of variation
in hatching and early survival rates ofSalmo trutta3Salvelinus fontinalishybrid. Aquaculture32:115–122.
Bongers, A. B. J., E. P. C. In’tVeld, K. Abo-Hashema, I. M. Bremmer,
E. H. Edinget al., 1994 Androgenesis in common carp ( Cypri-nus carpio) using UV irradiation in a synthetic ovarian fluid and heat shocks. Aquaculture122:119–132.
Bongers, A. B. J., J. B. Abarca, B. Z. Coulabi, E. H. Eding, J. Komen et al., 1995 Maternal influence on development of androge-netic clones of common carp, Cyprinus carpioL. Aquaculture
137:139–147.
Borevitz, J. O., J. N. Maloof, J. Lutes, T. Dabi, J. L. Redfernet al.,
2002 Quantitative trait loci controlling light and hormone re-sponse in two accessions of Arabidopsis thaliana.Genetics160:
683–696.
Broman, K. W., H. Wu, S. Senand G. A. Churchill, 2003 R/qtl:
QTL mapping in experimental crosses. Bioinformatics 19:
889–890.
Brown, K. H., R. W. Lee and G. H. Thorgaard, 2006 Use of
androgenesis for estimating maternal and mitochondrial genome effects on development and oxygen consumption in rainbow trout, Oncorhynchus mykiss. Comp. Biochem. Physiol.
143B:415–421.
Churchill, G. A., and R. W. Doerge, 1994 Empirical threshold
values for quantitative trait mapping. Genetics138:963–971. Danzmann, R. G., M. Cairney, W. S. Davidson, M. M. Ferguson,
K. Gharbiet al., 2005 A comparative analysis of the rainbow
trout genome with 2 other species of fish (Arctic charr and Atlan-tic salmon) within the tetraploid derivative Salmonidae family (subfamily: Salmoninae). Genome48:1037–1051.
Dickhoff, W. W., C. L. Brown, C. V. Sullivanand H. A. Bern,
1990 Fish and amphibian models for developmental endo-crinology. J. Exp. Zool.4:90–97.
DiMichele, L., and D. A. Powers, 1991 Allozyme variation,
develop-mental rate, and differential mortality in the teleostFundulus heteroclitus.Physiol. Zool.64:1426–1443.
Einum, S., and I. A. Fleming, 1999 Maternal effects of egg size in
brown trout (Salmo trutta): norms of reaction to environmental quality. Proc. R. Soc. Lond. B Biol. Sci.266:2095–2100. Einum, S., and I. A. Fleming, 2000 Selection against late emergence
and small offspring in Atlantic salmon (Salmo salar). Evolution
54:628–639.
Einum, S., and I. A. Fleming, 2004 Environmental unpredictability
and offspring size: conservative versus diversified bet-hedging. Evol. Ecol. Res.6:443–455.
Eising, C. M., C. Eikenaar, H. Schwabland T. G. G. Groothuis,
2001 Maternal androgens in black-headed gull (Larus ridibun-dus) eggs: consequences for chick development. Proc. R. Soc. Lond. B Biol. Sci.268:839–846.
Elliot, J. M., 1989 Mechanisms responsible for population
regula-tion in young migratory trout,Salmo trutta.I. The critical time for survival. J. Anim. Ecol.58:987–1002.
Felip, A., W. P. Young, P. A. Wheeler and G. H. Thorgaard,
2005 An AFLP-based approach for the identification of sex-linked markers in rainbow trout (Oncorhynchus mykiss). Aquacul-ture247:35–43.
Ferguson, M. M., R. G. Danzmann and F. W. Allendorf,
1985 Developmental divergence among hatchery strains of rainbow trout (Salmo gairdneri). I. Pure strains. Can. J. Genet. Cytol.
27:289–297.
Fry, J. D., S. V. Nuzhdin, E. G. Pasyukovaand T. F. C. Mackay,
1998 QTL mapping for genotype-environment interaction for fitness inDrosophila melanogaster.Genet. Res.71:133–141. Gerber, A. S., R. Loggins, S. Kumarand T. E. Dowling, 2001 Does
nonneutral evolution shape observed patterns of DNA variation in animal mitochondrial genomes? Annu. Rev. Genet.35:539– 566.
Heath, D. D., C. W. Foxand J. W. Heath, 1999 Maternal effects on
offspring size: variation through early development of chinook salmon. Evolution53:1605–1611.
Hebert, K. P., P. L. Goddard, W. W. Smokerand A. J. Gharrett,
1998 Quantitative genetic variation and genotype by envi-ronment interaction of embryo development rate in pink salmon (Oncorhynchus gorbuscha). Can. J. Fish. Aquat. Sci.55:2048– 2057.
Hutchings, J. A., 1991 Fitness consequences of variation in egg
size and food abundance in brook trout Salvelinus-Fontinalis. Evolution45:1162–1168.
Jiang, C. J., and Z. B. Zeng, 1995 Multiple trait analysis of
genetic mapping for quantitative trait loci. Genetics140:1111– 1127.
Kao, C.-H., Z. B. Zengand R. D. Teasdale, 1999 Multiple
inter-val mapping for quantitative trait loci. Genetics 152: 1203– 1216.
Lander, E., J. Abrahamson, A. Barlow, M. Daly, S. Lincoln et al., 1987 Mapmaker: a computer package for constructing genetic-linkage maps. Cytogenet. Cell Genet.46:642.
Leder, E. H., R. G. Danzmannand M. M. Ferguson, 2006 The
candidate gene, Clock, localizes to a strong spawning time quantitative trait locus region in rainbow trout. J. Hered.97:
74–80.
Leips, J., and T. F. C. Mackay, 2000 Quantitative trait loci for
life span in Drosophila melanogaster: interactions with genetic background and larval density. Genetics155:1773–1788. Liu, B. H., 1998 Statistical Genomics: Linkage, Mapping and QTL
Analysis.CRC Press, Boca Raton, FL.
Lynch, M., and B. Walsh, 1998 Genetics and Analysis of Quantitative Traits.Sinauer Associates, Sunderland, MA.
Martinez, V. A., W. G. Hilland S. A. Knott, 2002 On the use
of doubled haploids for detecting QTL in outbred populations. Heredity88:423–431.
Martinez, V., G. Thorgaard, B. Robison and M. J. Sillanpaa,
2005 An application of Bayesian QTL mapping to early de-velopment in double haploid lines of rainbow trout including environmental effects. Genet. Res.86:209–221.
Mason, J. C., and D. W. Chapman, 1965 Significance of early
emer-gence, environmental rearing capacity, and behavioral ecology of juvenile coho salmon in stream channels. J. Fish. Res. Board Can.
22:173–190.
May, B., and P. M. Grewe, 1993 Fate of maternal mtDNA following 60Co inactivation of maternal nuclear DNA in unfertilized
salmo-nid eggs. Genome36:725–730.
McCormick, M. I., and I. V. Nechaev, 2002 Influence of cortisol
on developmental rhythms during embryogenesis in a tropical damselfish. J. Exp. Zool.293:456–466.
McGowan, R. A., and C. C. Martin, 1997 DNA methylation and
genome imprinting in the zebrafish, Danio rerio: some evolu-tionary ramifications. Biochem. Cell Biol.75:499–506. McIntyre, J. D., and J. M. Blanc, 1972 A genetic analysis of
hatch-ing time in steelhead trout (Salmo gairdneri). J. Fish. Res. Board Can.30:137–139.
Mousseau, T. A., and C. W. Fox, 1998 The adaptive significance of
maternal effects. Trends Ecol. Evol.13:403–407.
Nagler, J. J., 2000 In vivotreatment with cycloheximide or
actino-mycin D inhibits early embryonic development in rainbow trout (Oncorhynchus mykiss). Fish Physiol. Biochem.22:61–66. Nichols, K. M., W. P. Young, R. G. Danzmann, B. D. Robison, C.
Rexroadet al., 2003 A consolidated linkage map for rainbow
trout (Oncorhynchus mykiss). Anim. Genet.34:102–115. Oakley, T. H., and R. B. Phillips, 1999 Phylogeny of salmonine
fishes based on growth hormone introns: Atlantic (Salmo) and Pacific (Oncorhynchus) salmon are not sister taxa. Mol. Phyloge-net. Evol.11:381–393.
O’Malley, K. G., T. Sakamoto, R. G. Danzmann and M. M.
Ferguson, 2002 Quantitative trait loci for spawning date and
body weight in rainbow trout: testing for conserved effects across ancestrally duplicated chromosomes. J. Hered.94:273–284. Pakkasmaa, S., O. P. Penttinenand J. Piironen, 2006 Metabolic
rate of Arctic charr eggs depends on their parentage. J. Comp. Physiol. B Biochem. Syst. Environ. Physiol.176:387–391. Parsons, J. E., and G. H. Thorgaard, 1984 Induced androgenesis
in rainbow trout. J. Exp. Zool.231:407–412.
Phillips, R. B., M. R. Morasch, P. A. Wheelerand G. H. Thorgaard,
2005 Rainbow trout (Oncorhynchus mykiss) of Idaho and Alaskan origin (2n¼58) share a chromosome fusion relative to trout of California origin (2n¼60). Copeia3:661–664.
Rexroad, C. E., III, R. L. Coleman, A. M. Martin, W. K. Hershberger
and J. Killefer, 2001 Thirty-five polymorphic microsatellite
markers for rainbow trout (Oncorhynchus mykiss). Anim. Genet.
Ristow, S. S., L. D. Grabowski, C. Ostberg, B. Robisonand G. H.
Thorgaard, 1998 Development of long-term cell lines from
homozygous clones of rainbow trout. J. Aquat. Anim. Health
10:75–82.
Robison, B. D., P. A. Wheelerand G. H. Thorgaard, 1999
Varia-tion in development rate among clonal lines of rainbow trout (Oncorhynchus mykiss). Aquaculture173:131–141.
Robison, B. D., P. A. Wheeler, K. Sundin, P. Sikka and G. H.
Thorgaard, 2001 Composite interval mapping reveals a major
locus influencing embryonic development rate in rainbow trout (Oncorhynchus mykiss). J. Hered.92:16–22.
Sakamoto, T., R. G. Danzmann, K. Gharbi, P. Howard, A. Ozaki et al., 2000 A microsatellite linkage map of rainbow trout ( On-corhynchus mykiss) characterized by large sex-specific differences in recombination rates. Genetics155:1331–1345.
Sen, S., and G. A. Churchill, 2001 A statistical framework for
quan-titative trait mapping. Genetics159:371–387.
Smoker, W. W., 1986 Variability of embryo development rate, fry
growth, and disease susceptibility in hatchery stocks of chum salmon. Aquaculture57:219–226.
Stratholt, M. L., E. M. Donaldsonand N. R. Liley, 1997 Stress
in-duced elevation of plasma cortisol in adult female coho salmon (Oncorhynchus kisutch) is reflected in egg cortisol content, but does not appear to affect early development. Aquaculture158:141–153. Sundin, K., K. H. Brown, R. E. Drew, K. M. Nichols, P. A. Wheeler et al., 2005 Genetic analysis of a development rate QTL in back-crosses of clonal rainbow trout,Oncorhynchus mykiss.Aquaculture
247:75–83.
Sundstrom, L. F., M. Lohmus, J. I. Johnssonand R. H. Devlin,
2004 Growth hormone transgenic salmon pay for growth po-tential with increased predation mortality. Proc. R. Soc. Lond. B Biol. Sci.271:S350–S352.
Sundstrom, L. F., M. Lohmusand R. H. Devlin, 2005 Selection
on increased intrinsic growth rates in coho salmon,Oncorhynchus kisutch.Evolution59:1560–1569.
Tallman, R. F., 1986 Genetic differentiation among seasonally
dis-tinct spawning populations of chum salmon,Oncorhynchus keta.
Aquaculture57:211–217.
Vandeputte, M., E. Quilletand B. Chevassus, 2002 Early
devel-opment and survival in brown trout (Salmo trutta farioL.): indi-rect effects of selection for growth rate and estimation of genetic parameters. Aquaculture204:435–445.
Vieira, C., E. G. Pasyukova, Z. B. Zeng, J. B. Hackett, R. F. Lyman et al., 2000 Genotype-environment interaction for quantitative trait loci affecting life span in Drosophila melanogaster.Genetics
154:213–227.
Visscher, P. M., R. Thompsonand C. S. Haley, 1996 Confidence
intervals in QTL mapping by bootstrapping. Genetics 143:
1013–1020.
Voorips, R. E., 2002 MapChart: software for the graphical
presenta-tion of linkage maps and QTL. J. Hered.93:77–78.
Vos, P., R. Hogers, M. Bleeker, M. Reijans, T.van deLeeet al.,
1995 AFLP: a new technique for DNA fingerprinting. Nucleic Acids Res.23:4407–4414.
Wang, I. A., E. H. Leder, W. W. Smoker and A. J. Gharrett,
2006 Timing of development during epiboly in embryos of second-generation crosses and backcrosses between odd- and even-broodyear pink salmon, Oncorhynchus gorbuscha. Envi-ron. Biol. Fishes75:325–332.
Young, W. P., P. A. Wheeler, R. D. Fieldsand G. H. Thorgaard,
1996 DNA fingerprinting confirms isogenicity of androgeneti-cally derived rainbow trout lines. J. Hered.87:77–81.
Young, W. P., P. A. Wheeler, V. H. Coryell, P. Keimand G. H.
Thorgaard, 1998 A detailed linkage map of rainbow trout
produced using doubled haploids. Genetics148:839–850. Zeng, Z. B., 1994 Precision mapping of quantitative trait loci.
Genetics136:1457–1468.