ABSTRACT
SALKAR, GAUTAM UDAY. Opposed Flow Oxy-Fuel Diffusion Flame Synthesis of One-Dimensional Vanadium Oxide Nanostructures on Solid Support. (Under the direction of Dr. Alexei Saveliev).
Vanadium oxide nanostructures have been produced in a lot of variety including nanorods, nanowires, nanochannels, nanotubes, etc. They have been synthesized using hydrothermal, flame spray pyrolysis and other methods. However these methods are complicated and costly. A novel flame gradient method offers a simple and efficient approach with the capability of mass production with minimum contamination since precursors and dopants are not employed. The opposed flow oxygen enriched air-methane flame provides the high temperature chemically reactive environment that facilitates the synthesis of vanadium oxide nanostructures on the probe inserted in the flame. The material from the bottom part of the probe gets oxidized, ablated and vaporized in the flame environment and ultimately the vanadium oxide vapors crystallize on the upper part of the probe to form nanostructures. Morphology of the synthesized one-dimensional vanadium oxide nanostructures is controlled by careful manipulation of the governing parameters such as axial position of the probe inserted in the flame, flame composition, residence time and strain rate. The synthesized structures are observed under the compound microscope initially and later using a scanning electron microscope (SEM) for further intricate structural details. Energy dispersive X-ray spectroscopy (EDS) is performed in order to investigate the chemical composition of the synthesized structures. The formation of V2O5 microchannels, nanochips, nanowalls and
Opposed Flow Oxy-Fuel Diffusion Flame Synthesis of One-Dimensional Vanadium Oxide Nanostructures on Solid Support
by
Gautam Uday Salkar
A thesis submitted to the Graduate Faculty of North Carolina State University
in partial fulfillment of the requirements for the degree of
Master of Science
Mechanical Engineering
Raleigh, North Carolina 2011
APPROVED BY:
_______________________________ ______________________________ William Roberts Andrey Kuznetsov
________________________________ Alexei Saveliev
DEDICATION
BIOGRAPHY
ACKNOWLEDGEMENTS
TABLE OF CONTENTS
LIST OF TABLES………viii
LIST OF FIGURES………ix
1. INTRODUCTION AND BACKGROUND... 1
1.1 Metal oxide nanoparticles... 1
1.2 Flame synthesis of transition metal oxide nanoparticles ... 2
1.2.1 Factors influencing the flame synthesis ... 4
1.2.2 Flame aerosol process ... 5
1.2.3 Flame spray pyrolysis ... 6
1.3 Flame synthesis of one-dimensional transition metal oxide nanostructures ... 7
1.3.1 Flame aerosol process ... 7
1.3.2 Flame spray pyrolysis ... 8
1.3.3 Plasma assisted flame synthesis ... 9
1.3.3.1 Atmospheric microwave plasma torch flame method ... 9
1.3.3.2 Radio frequency thermal plasma flame synthesis ... 10
1.3.4 Flame synthesis using flame gradient method ... 12
1.4 Properties and applications of vanadium oxide nanostructures ... 13
1.5 Thesis Objective and Outline... 14
2. EXPERIMENTAL SETUP ... 16
2.1 Burner and burner mount ... 16
2.2 Flow control system ... 20
2.3 Probe mount ... 24
2.4 Experimental procedure ... 26
2.4.2 Running ... 30
2.4.3 Shutdown ... 31
2.5 Post experiment observation process ... 32
3. OPPOSED FLOW DIFFUSION FLAME ... 33
3.1 Diffusion flames... 33
3.1.1 Counter flow diffusion flame ... 34
3.2 Flame structure for different flame conditions ... 38
3.2.1 Effect of oxygen enrichment ... 38
3.2.2 Effect of strain rate variation ... 41
4. RESULTS FOR SYNTHESIS OF VANADIUM OXIDE NANOSTRUCTURES .. 43
4.1 Flame parameters affecting the synthesis ... 43
4.2 General mechanism of material transport in flame environment ... 46
4.3 Influence of axial position of probe on the morphology of synthesized structures ... 48
4.3.1 Morphology observed under SEM... 48
4.3.2 Setting a standard for EDS ... 58
4.3.3 EDS characterization of the synthesized nanowalls ... 62
4.3.4 Analysis of effect of variation in axial position of the probe in the flame ... 64
4.4 Influence of oxidizer composition on the morphology of synthesized structures ... 65
4.4.1 Morphology observed under SEM... 65
4.4.2 EDS characterization of the soot and carbon nanofiber structures ... 70
4.4.3 Analysis of effect of variation in oxidizer composition ... 72
4.5 Influence of residence time on the morphology of the synthesized structures ... 73
4.5.2 Analysis of effect of residence time variation ... 77
4.6 Influence of acetylene addition on the morphology of the synthesized structures .... 78
4.6.1 Morphology observed under SEM... 78
4.6.2 Analysis of the effect of acetylene addition ... 84
4.7 Influence of variation of strain rate on morphology of the synthesized structures.... 85
4.7.1 Morphology observed under SEM... 85
4.7.2 Analysis of effect of strain rate variation ... 88
4.8 Presence of hydroxides in combination with vanadium pentoxide ... 89
4.9 Crystal growth mechanism ... 90
CONCLUSIONS………... 93
FUTURE WORK………...95
REFERENCES………..96
LIST OF TABLES
Table 1. Summary of experimental studies of gas phase synthesis [10] ... 3 Table 2. Effect of reduction of axial distance of probe from fuel nozzle end on
morphology of synthesized structures ... 65 Table 3. Effect of variation of oxidizer composition on the morphology of synthesized
structures ... 72 Table 4. Effect of variation of residence time of probe inserted in the flame on the
morphology of synthesized structures ... 77 Table 5. Effect of addition of acetylene in the fuel composition on the morphology of
LIST OF FIGURES
Fig. 1. Schematic diagram for experimental setup for ZnO nanorod formation by
atmospheric microwave plasma torch flame [23] ... 10
Fig. 2. Schematic representation of the experimental setup for ZnO nanorod formation by radio frequency thermal plasma flame [24] ... 11
Fig. 3. Schematic of the counter flow diffusion flame burner. ... 16
Fig. 4. Experimental setup viewed from the front ... 19
Fig. 5. Schematic of the flow control system showing gas line connections ... 21
Fig. 6. Mass flow controllers for methane, oxygen and acetylene and mass flow meter for air mounted on the cantilever plate ... 23
Fig. 7. Probe mount assembly viewed from the side... 25
Fig. 8. Microline custom made pressure regulator panel for methane ... 29
Fig. 9. A photograph of counter flow diffusion flame used in the experiment ... 29
Fig. 10. Schematic of a counter flow diffusion flame ... 34
Fig. 11. Photographs of the flames with varying oxidizer composition are shown for a strain rate of 20 s-1: (a) 21%O2+79%N2, (b) 30%O2+70%N2, (c) 50%O2+50%N2. ... 40
Fig. 12. Photographs of the flames with varying strain rates for 50%O2+50%N2 oxidizer composition are shown: (a) 20 s-1, (b) 40 s-1... 42
Fig. 13. Numerical profiles of temperature and major chemical species in opposed flow diffusion flame composed of 50%N2+50%O2 and 96%CH4+4%C2H2 [27]. ... 44
Fig. 14. Plot of variation in the temperature of the probe with change in diameter. ... 45
Fig. 15. Schematic of the probe showing the position of abnormal V2O5 peak like structure formation in relation to the flame position ... 46
Fig. 16. Schematic of probe cross-section showing the material ablated from the bottom of the probe and the region of V2O5 deposition and also abnormal peak formation on the exterior as compared to the interior surface of the probe... 47
Fig. 18. SEM image of nanowires seen growing on surface and tips of microchannel for
axial position 12 mm ... 50
Fig. 19. SEM images of hollow structures: (a) microchannel with hollow internal centre, (b) hollow gaps between overlapped microchannels ... 51
Fig. 20. SEM image of the chip like structures observed. ... 52
Fig. 21. SEM images of nanobeads of V2O5 which show their end to end linking forming small linear chains which are randomly dispersed over the probe surface: (a) Low magnification image, (b) High magnification image showing bead structures with clarity. ... 53
Fig. 22. SEM image of the microchannel seen in very few regions for the axial probe distance 11 mm ... 54
Fig. 23. SEM image of the nanowires growing at the tips of microchannels at axial position 11 mm... 55
Fig. 24. SEM image of nanowalls scattered over probe surface ... 56
Fig. 25. Magnified SEM image of nanowalls densely packed ... 56
Fig. 26. Magnified SEM images of few nanowalls showing clear morphology: (a) Morphology shows rough edges, (b) Morphology shows rough curves. ... 57
Fig. 27. SEM image of the V2O5 powder. ... 58
Fig. 28. EDS carried out on standard V2O5 powder sample at 5 keV ... 59
Fig. 29. EDS carried out on standard V2O5 powder sample at 10 keV ... 59
Fig. 30. EDS carried out on standard V2O5 powder sample at 20 keV ... 60
Fig. 31. EDS carried out on standard V2O5 powder sample at 30 keV ... 60
Fig. 32. EDS for 20 keV repeated and compared with the previous result at the same location for reducing any error... 61
Fig. 33. EDS for the nanowalls showing characteristic peaks for vanadium and oxygen in regions lightly covered by nanowalls ... 63
Fig. 34. EDS for the nanowalls showing characteristic peaks for vanadium and oxygen over densely packed nanowall regions. ... 63
Fig. 36. Magnified SEM images of nanochip showing their random shapes without
specific orientation. ... 67
Fig. 37. SEM image showing fluffy structure... 68
Fig. 38. SEM image showing nanofiber growth. ... 68
Fig. 39. SEM image of nanofiber formation alongside fluffy structure. ... 69
Fig. 40. EDS result for the synthesized nanofibers ... 70
Fig. 41. EDS result for the synthesized fluffy structures ... 71
Fig. 42. SEM image of microchannels for residence time 90 seconds. ... 73
Fig. 43. SEM image showing micron sized mounds for residence time 90 seconds ... 74
Fig. 44. SEM image of nanowire growth on microchannel for residence time 90 seconds. ... 74
Fig. 45. SEM image of nanobeads covering the probe surface for a residence time 60 seconds... 75
Fig. 46. SEM image of nanochips for a residence time 60 seconds. ... 76
Fig. 47. SEM image showing microchannel formation with acetylene addition and axial position 11 mm... 78
Fig. 48. SEM image of lung like synthesized structure without acetylene for axial position 11 mm. ... 79
Fig. 49. SEM image of lung like structure with higher magnification for axial position 11 mm ... 80
Fig. 50. SEM image of carbon nanotrees synthesized with acetylene addition for axial distance 10 mm. ... 81
Fig. 51. SEM image of nanowalls synthesized with acetylene addition for axial distance 10 mm ... 82
Fig. 52. SEM image of the synthesized nanowalls without acetylene for an axial position 10 mm ... 83
Fig. 53. SEM image showing microchannels and microbelts for strain rate 40 s-1. ... 85
1. INTRODUCTION AND BACKGROUND 1.1 Metal oxide nanoparticles
Materials that have their dimensions of the order of nanometers are called nanomaterials. These materials have special properties owing to their nanoscale nature. Nanomaterials have a very high surface to volume ratio that gives rise to certain characteristic properties which are not exhibited when the material exists at macroscale. Metal oxide nanomaterials are oxides of metals existing at nanoscale dimensions. Metal oxide nanomaterials possess unique electric, magnetic, chemical, physical and optical properties [1]. They have potential applications in biological, chemical, opto-electric and semiconductor industries. These materials have been used in catalysis [2], gas sensors [3], electrodes of lithium-ion batteries [4], semiconductors [5], lasers [6] and also have several bio-medical applications [7-9]. Several methods have been employed for the synthesis of metal oxide nanostructures [6]; some of which are:
• chemical vapor deposition • hydrothermal chemistry
• electrochemistry
• flame synthesis
The growth mechanisms for metal oxide nanomaterials are described primarily by three modes which are as follows [6]:
• vapor-liquid-solid (VLS)
• vapor-solid (VS)
• aqueous solution growth (ASG).
1.2 Flame synthesis of transition metal oxide nanoparticles
The synthesis of carbon nanostructures in flames has been extensively studied during the last two decades. This promoted the study of flames for the synthesis of transition metal oxide nanostructures. Both premixed and diffusion flames have been studied. In diffusion flames, the fuel and oxidizer diffuse into each other in the reaction zone producing the flame while fuel and oxidizer are mixed prior to their entry into the reaction zone in the case of premixed flames. Co-flow, inverse as well as counter flow configurations have been used in diffusion flames. In the co-flow and inverse flow configurations, the fuel and oxidizer flow in the same direction through concentric tubes. The difference is that in co-flow flames, the inner fuel flow is surrounded by oxidizer flow while in the inverse flow flames as the name suggests, the inner oxidizer flow is surrounded by the fuel flow. In the counter flow configuration, the fuel and oxidizer streams flow towards each other from opposite directions.
temperature and chemical species. Table 1 provides examples of nanoparticles synthesized with premixed, co-flow and counter flow configurations.
Table 1. Summary of experimental studies of gas phase synthesis [10]. Reactants Particles
Formed
Apparatus Particle Retrieval Method Particle Morphology Reference Iron carbonyl/ hexamethyl-disiloxane/CH4 /O2
Fe2O3 Premixed
burner
Deposition directly on TEM grids
Fe2O3
encapsulated in SiO2
spheres
[11]
TiCl4/CH4/
Ar/air
TiO2 Co-flow
diffusion burner Deposit onto glass fiber filters Agglomerates, primary particles ~11-105 nm [12]
Al(CH3)3/CH4/
O2/N2
Al2O3 Counter flow
diffusion flame Deposition directly on TEM grids Agglomerates, primary particles ~13-47 nm, sintered spheres ~ 20-60 nm
[13]
The advantages of flame synthesis over other methods are:
• The high temperature flame environment provides self-purity from microscopic
organisms that can contaminate the particles during the experimentation. • The flame itself provides the energy required to sustain the synthesis.
• In some cases the nanoparticles do not require any post processing like washing, etc
which minimizes the waste.
• There is a great amount of flexibility offered in the gas phase synthesis that allows
• The apparatus is compact and not bulky.
• Time required for synthesis is greatly reduced
• The process is inexpensive.
1.2.1 Factors influencing the flame synthesis
Flame synthesis is influenced by flame temperature, residence time, reactant composition, reactant mixing and precursor additive among other factors. Flame temperature depends on burner geometry, reactant composition and reactant mixing. Increasing the oxygen supply promotes oxidation and increases flame temperature. The increase in temperature increases the precursor decomposition and sintering is also increased [10]. If the increase in temperature is coupled with higher residence time, larger primary particles are formed while lower residence time gives rise to agglomerates of smaller particles. Higher gas velocities influence turbulent mixing due to which the fuel consumption is increased. Diluents soak up the heat released due to combustion. Increasing the amount of diluents delivered reduces the flame temperature. As the flame temperature gets reduced, the particle growth rate decreases [10].
individual agglomerates formed is increased and greater number of sites are available for particle growth [10].
1.2.2 Flame aerosol process
In flame aerosol process, the vaporized precursor is introduced in the flame. Typical experimental setup consists of a reactor, burner, flow system for gas delivery and a filter system. The reactor consists of a precursor unit where the precursor is vaporized. The carrier gas is bubbled through the container filled with the liquid precursor. The gas lines and the container are heated to ensure vapor state of the precursor. This is then fed into the flame. Research has shown that factors such as the particle residence time and flame temperature play a crucial role in the characteristics of the synthesized powders [14]. Reactant mixing is observed to affect the particle size by one order of magnitude resulting in the formation of finer particles in inverted diffusion flame than in co-flow diffusion flame [12, 15]. Moreover the choice of the precursor becomes vital when considerable heat is produced by the combustion of precursor [14]. Additives play an important role to control the primary particle size and the extent of agglomeration [14].
The application of external electric field charges the particles which are attracted towards oppositely charged electrodes and this promotes collision rate between various gaseous particles. The application of electric field influences flame temperature and structure of the flame which can be seen in the flattening of premixed oxy-methane flame which leads to an increase in the specific surface area of synthesized TiO2 powder [14]. In addition,
have high sensing ability for ethanol vapor [16]. Scaled up flame aerosol process is currently used in the industry for large scale production.
1.2.3 Flame spray pyrolysis
In the flame spray pyrolysis process, the liquid precursor is sprayed through nozzle, atomized and is either mixed with oxygen producing a flame or is injected into a flame. The experimental setup for flame spray pyrolysis consists of a system for generation and spray of liquid droplets which usually include ultrasonic or gas assisted pressurized atomizers, oxidant to carry out oxidation and a heat source [14]. The heat source is provided by the combustion of liquid droplets or by the evaporation of liquid droplets to vapor followed by combustion. The quenching ability of the reactors is higher due to increased shear rates required to atomize the liquid. The composition of the liquid fuel and the liquid precursor play an important role in growth of particles. Burning rates, droplet lifetime and fuel atomization are important factors governing particle synthesis.
1.3 Flame synthesis of one-dimensional transition metal oxide nanostructures
Synthesis of one-dimensional nanostructures of transition metal oxides has been a recent field of study. One-dimensional nanostructures include nanorods, nanotubes, nanowalls, nanoribbons, nanochannels and nanowires which are long enough to have their length as the predominant single dimension. Several methods such as vapor phase methods, solution phase methods, electrospinning, etc. have been developed. The successful application of the traditional flame synthesis methods such as flame aerosol and flame spray pyrolysis methods for the synthesis of transition metal oxide nanoparticles triggered the interest to explore their use for the synthesis of one-dimensional nanostructures of transition metal oxides. The flame synthesis includes gas phase synthesis and has also been extended to include synthesis using solid support. The precise control of factors such as flame temperature, residence time, reactant composition, reactant mixing and precursor additive affects the growth of the one-dimensional nanostructures. There is exhaustive research carried out on the flame synthesis of metal oxide nanoparticles as compared to one-dimensional metal oxide nanostructures. Flame aerosol and flame spray pyrolysis have been predominantly used for the synthesis of SnO2 [19] and ZnO2 nanorods [20], respectively. Plasma flame synthesis along with flame
gradient method are recent additions to the flame synthesis techniques employed for growth of one-dimensional metal oxide nanostructures. These approaches have unique advantages over the traditional flame methods.
1.3.1 Flame aerosol process
as chlorides of iron, lithium and zinc [19]. The precursor is then fed into the hydrogen-oxygen co-flow diffusion flame. Dopant concentrations and flame residence time affect the morphology of the synthesized nanowires. It is observed that the highest nanorod formation tendency is exhibited with Fe as the dopant species due to the high valency of Fe [19]. Increasing the Fe concentration and the flame residence time promotes the growth of SnO2
nanorods. SnO2 nanorods 200 nm in length and 20 nm in diameter are grown [19]. Using
argon and methane alternatively as the carrier gas with dopant species of gold acetate and aluminum acetate, SnO2 nanorodsare also grown using flame aerosol method [21]. The use
of methane provides greater control over high aspect ratio and average crystal size. Particle diameter increases from 19 nm using argon gas to 46 nm with the use of methane as the carrier gas thus increasing surface area.
1.3.2 Flame spray pyrolysis
In this method a liquid solvent containing appropriate precursors is atomized and sprayed into the flame through a nozzle. ZnO nanorods have been synthesized by flame spray pyrolysis method with a co-flow diffusion flame [20]. Indium, tin and lithium dopant species are used with concentration ranging from 1% to 10%. The effect of dopant concentrations on the metal oxide morphology is studied [20]. The nanorod formation is found to occur exclusively in the vapor phase. The nanorod formation mechanism depends on the dopant valency and their incorporation into the zinc crystal. Sn provides highest nanorod formation influence at lower concentrations than In. Lithium being of a lower valence does not alter the shape of ZnO. Flame spray pyrolysis has also been employed for the synthesis of SnO2
and their length ranges from 4 μm to about 200 μm. These homogenous structures are observed to grow preferentially as one-dimensional crystals [22]. These nanorods are observed to grow by layer-by-layer growth mechanism [22]. Limited research has been conducted in application of flame spray pyrolysis technique for the synthesis of one-dimensional metal oxide nanostructures.
1.3.3 Plasma assisted flame synthesis
The plasma assisted flame environment is utilized for the synthesis of metal oxide nanoparticles. The plasma assisted flame is able to achieve extremely high temperatures consequently accelerating the synthesis process and substantially reducing the production time. This approach is relatively recent compared to the traditional flame aerosol and flame spray pyrolysis methods.
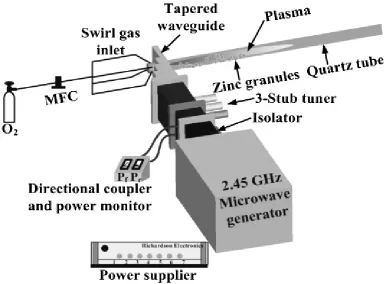
1.3.3.1 Atmospheric microwave plasma torch flame method ZnO nanorods are synthesized from Zn samples by their direct heating at atmospheric
granules placed in the quartz tube melt and vaporize in the plasma torch flame and reactions occur in the plasma phase to form ZnO nanowires.
Fig. 1. Schematic diagram for experimental setup for ZnO nanorod formation by atmospheric microwave plasma torch flame [23].
The ZnO nanorod formation occurs by the vapor-liquid-solid growth mechanism [23]. Since the temperatures achieved in this method are very high, it is observed that ZnO nanorod formation occurs in less than one second.
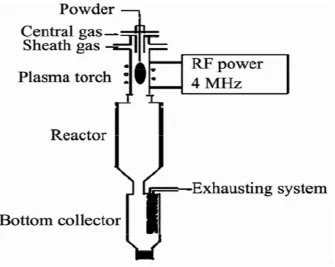
1.3.3.2 Radio frequency thermal plasma flame synthesis
plasma generator, reactor and a collector. The plasma generator consists of the plasma forming gas argon, surrounded by the sheath of nitrogen and oxygen. The plasma torch is energized by the radio frequency generator. The zinc powder acts as the source for zinc. The plasma phase reactions trigger the synthesis of the nanorods which are deposited in the bottom collector.
Fig. 2. Schematic representation of the experimental setup for ZnO nanorod formation by radio frequency thermal plasma flame [24].
1.3.4 Flame synthesis using flame gradient method
The flame gradient technique is based on incorporating the thermal and chemical gradients developed in flame. This method eliminates the need of dopants. The synthesis of particles in this method occurs in the flame volume which can be captured thermophoretically using a TEM grid. It also occurs on the solid support when it is inserted in the flame. The material feed probe is inserted in the flame at various axial locations within the flame. The thermophoretic sampling is carried out at various heights above the probe. Using this technique, ZnO nanorods are synthesized from zinc plated steel substrate inserted in a co-flow flame without the use of dopants [25]. From this method, ZnO nanowires are produced on the fuel as well as the oxidizer side of the flame. They are formed by vapor-solid growth mechanism. Nanorods of oxides of several metals such as iron [26] and molybdenum [27] have been synthesized using this technique on the solid support inserted in opposed flow diffusion flame. Additionally even volumetric flame synthesis has been carried out for molybdenum oxide [28].
flames where the thermal and chemical gradients vary in the axial direction which makes this kind of a flame essentially a one-dimensional flame.
1.4 Properties and applications of vanadium oxide nanostructures
The primary focus of the thesis is to employ the opposed flow diffusion flame to synthesize one-dimensional vanadium oxide nanostructures. Vanadium is a transition metal that maintains several oxidation states V3+, V4+, V5+ producing various stable oxides. Vanadium pentoxide (V2O5) exhibits the maximum oxidation state for vanadium and is highly stable
[29]. It exhibits unique properties based on its redox-chemistry as vanadium exists in multiple
valence states [30]. The structural diversity of vanadium oxides allows for internal degrees of freedom within the structure bringing about sudden transitions from metal to insulator phase [31] or even become superconducting [32]. These peculiar metal-insulator phase transitions are particularly observed for VO2 and V2O5 rendering these for use in the
semiconductor industry. Due to the unique physiochemical properties, vanadium oxides find uses in electric-field effect transistors [33] and chemical sensors [34]. Vanadium pentoxide nanostructures are particularly used for a variety of applications such as:
• Catalysis [35].
• Field Effect Transistors [36].
• Sensors [37].
• Spintronic devices [38].
• Solar cells [41].
• Increasing the electrical conductivity and modulus of elasticity of polyvinyl chloride
once added to it [42].
Vanadium oxide nanostructures have been usually synthesized using hydrothermal synthesis approach [43, 38] which avoids high temperatures which may cause difficulty in synthesis owing to the relatively low melting point of vanadium, 1910 °C and low melting points of vanadium oxides: 690 °C for V2O5 and 1967 °C for VO2. Nanoparticles of vanadium oxide
have been synthesized using flame spray pyrolysis [30] and of composites of mixed metal oxides such as V2O5/TiO2 and V2O5/SiO2 [44]. However one-dimensional vanadium oxide
nanostructures have not yet been grown using any of the flame synthesis methods. The crystal structure of V2O5 is shown in Appendix A.
1.5 Thesis Objective and Outline
2. EXPERIMENTAL SETUP 2.1 Burner and burner mount
A counter flow diffusion flame consists of two opposed flow streams of fuel and oxidizer. Methane is used as the fuel. The oxidizer consists of air with oxygen enrichment. The opposed jets of the reactants collide to create a stagnation plane and the flame exists at the stoichiometric contour. The counter flow diffusion flame burner is composed of bottom half and the top half as shown in the Figure 3.
The burner is mounted on to a BISLIDE assembly (VELMEX Inc). The BISLIDE assembly is mounted on a machined aluminum plate. The plate is then secured vertically on the top half of a cabinet using strut channels. The bottom half consist of two concentric cylinders. The inner cylinder carries the oxidizer mixture of air and oxygen. It is filled with glass beads so that the flow is stabilized and large eddy formations are avoided. The oxidizer mixture is delivered to the flame from the fine wire mesh at the exit of the nozzle. This fine mesh ensures that the flow is laminar and that the exit velocity profile is radially uniform. The annular space between the two concentric cylinders carries inert nitrogen which forms the outer inert shroud around the flame and thus contains it from spreading to the outside. The honeycomb structure is fitted into this annular space at the exit to ensure that the nitrogen gas flow is laminar and exit velocity profile is radially uniform.
hinder the effective heat transfer from exhaust gas to the cooling water. The two halves of the burner are connected using nuts and bolts.
Using a 2.54 cm (1 inch) optical slab, the gap between the exit nozzles of the fuel and oxidizer is adjusted. Once the gap is achieved, the slab is removed and the nuts are tightened so that a fixed 2.54 cm (1 inch) gap between the exit nozzles of the fuel and oxidizer is set precisely. At the top of the top half of the burner is the exhaust outlet. This is connected to the stainless steel exhaust pipe using a hose clamp. The other end of the exhaust pipe is then connected to stainless steel reducer cup at its smaller diameter end using a hose clamp and this connection is sealed using aluminum foil. The larger diameter end of the reducer cup is connected to the suction pipe using a hose clamp and this connection is sealed using an aluminum foil.
safely moved vertically covering a good measure of the available vertical travel on the BISLIDE.
The experimental setup is entirely mounted in the cabinet from Premier Metals. The primary components of the experiment as observed from the front which include the spring suspended burner mounted on BISLIDE, probe mount and probe holding assembly, cantilever panel mounted mass flow controllers and tube connections are shown in Figure 4.
Fig. 4. Experimental setup viewed from the front.
connected to the cabinet at its base. Each leveling leg assembly consists of a rubber cushioned base having an adjusting stud, one coupling nut, fully threaded stud and 2 heavy hexagonal nuts. The base of the cabinet has 4 threaded holes near its 4 corners each. In each corner hole, the fully threaded stud is inserted. It is turned until it protrudes sufficiently from the bottom of the hole. It is now fitted into the heavy hexagonal nut and the coupling nut through approximately half the length of the coupling nut. The heavy hexagonal nut is fitted onto the threaded stud of the rubber cushioned base and this is stud is now fitted into the coupling nut through the remaining half of its length. Once the coupling nut is fitted equally on both the threaded studs, the heavy hexagonal nuts are tightened to lock it in place. Now by turning the coupling nut the entire cabinet can be lifted off the ground and kept fixed in position for running the experiment. The relative horizontal tilt of the cabinet with respect to the ground is checked using a spirit level and adjusted using the coupling nuts. Similarly, the cabinet can be lowered until its wheels come in contact with the ground when it is required to move the experimental setup.
The components used for the experimental setup have been machined from the machine shop of the Department of Mechanical and Aerospace Engineering at North Carolina State University. SolidWorks Education Edition software has been used for all the machine designs of all the machined components in the experimental setup.
2.2 Flow control system
hood. The exhaust panel is a machined aluminum plate that is fixed to the exhaust hood. The side panel is a machined steel plate from Premier Metals fitted on the side of the cabinet. Polyethylene (PE), fluorinated ethylene propylene (FEP or Teflon) tubes from Thermo Fisher Scientific and high pressure braided polyvinyl chloride (PVC) tube from McMaster-Carr are used. The PE tubing is used for methane, acetylene, air and nitrogen gases while the FEP tubing is used for oxygen. The braided PVC tubing is used for the cooling water. The stainless steel, brass connections and valves are all obtained from Swagelok. The basic design of the flow control system showing the important gas flow line connections is provided in Figure 5.
The ball valves for methane, acetylene, nitrogen and oxygen gases are mounted on the exhaust panel. The side panel is further machined from the machine shop so that connectors for all the gases and toggle valves for methane, acetylene, oxygen and variable pressure valve for air are mounted on it. The tubing connections are used to connect these exhaust panel valves to the connectors mounted on the side panel. The tubing is further used to connect these connectors to the valves mounted on the side panel. In case of nitrogen, the tubing is used to connect the side panel connector to a nitrogen rotameter from Dwyer, mounted on an aluminum plate fitted at the base on the side of the cabinet.
The fuel gas cylinders for methane and acetylene are kept inside the fuel cylinder chambers. The pressure regulator consists of Microline custom made panel, mounted on the inside of the fuel cylinder chamber. The gas is then delivered through stainless steel pipe to the valve mounted on the exhaust panel. The oxygen and nitrogen cylinders are fastened to the optical table from Thorlabs, Inc. The pressure regulators are fitted on the cylinders and the tubes are used to connect the regulators to the valves mounted on the exhaust panel.
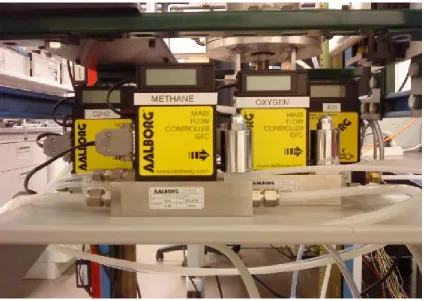
flow rates manually with a screw as required and also to easily read the displayed flow rate value. Figure 6 shows the mass flow controllers and mass flow meter mounted on cantilever plate.
Fig. 6. Mass flow controllers for methane, oxygen and acetylene and mass flow meter for air mounted on the cantilever plate.
chamber. The fuel mixing chamber is a brass tube attached vertically to the cabinet on the inside using hose clamp. The mixture enters from the top of the chamber and leaves from its bottom. Since the chamber is vertically mounted, there is wire gauze present at the bottom end of the chamber to prevent the glass beads from blocking the tubing at exit. The oxidizer mixing chamber is a stainless steel box that is placed at the base of the cabinet and held in position using strut channels and angle plates. The oxidizer mixture enters from the lower side and leaves from the top side of the oxidizer mixing chamber ensuring that the mixture fills the chamber evenly. Both the mixing chambers are filled with glass beads so that there is thorough mixing of the gases. The thoroughly mixed fuel and oxidizer mixtures now enter the top and bottom part of the burner respectively. The oxidizer mixture enters the bottom half of the burner by an elbow connection. Once again wire gauze is used on the end of the elbow inserted into the bottom half of the burner to prevent the glass beads from blocking the tubing. The fuel mixture enters the top half of the burner from the top. The tubing carrying nitrogen gas from the exit of the rotameter is connected to the side connection at the bottom half of the burner. The side connection is connected evenly in the 4 perpendicular directions in the horizontal plane to the outer concentric cylinder of the bottom half of the burner. This ensures that nitrogen gas evenly fills up the annular space.
2.3 Probe mount
attached to the base plate holes using screws. Their upper ends are fixed to the optical breadboard. The posts thus support the optical breadboard at a fixed height above the base plate. This height is essential to ensure that the probe can be inserted into the flame at the desired axial position. Thus the posts are carefully selected according to the measured height difference between the base plate and the probe positioning.
The probe holding assembly consists of lab jack, probe holder block, 2 positioning studs, probe holding tube, probe holding cap, probe shield and Teflon screw as shown in Figure 7.
Fig. 7. Probe mount assembly viewed from the side.
positioning studs can be vertically inserted perpendicular to the probe holding tube. The studs lock the block in position on the lab jack. The probe holding tube is allowed to slide through the machined hole in the block and can be locked in position using the Teflon screw through another perpendicular machined hole in the horizontal plane on the side of the block. The probe holding cap is a stainless steel reducer whose smaller diameter end has a shot punched bead. When the smaller diameter end is inserted into the inner diameter of the tube, it fits into the probe holding tube and remains fixed so that it does not move relative to the probe holding tube. The larger diameter end has the same outer diameter as the outside diameter of the probe holding tube. The probe holding cap has a 1.1 mm diameter hole running through its entire length at its centre. The probe material wire is also of 1 mm diameter which protrudes out from this central hole in the probe holding cap. The probe shield is a stainless steel tube slightly larger in diameter than the outer diameter of the probe holding tube. This ensures that it slides freely over the probe holding tube. It is machined to appropriate length so that it can cover the probe entirely during its withdrawal and also facilitate the cutting of the withdrawn probe for analysis. The probe shield protects the synthesized nanostructures on the probe during the withdrawal from the non-uniform flame boundary envelope.
2.4 Experimental procedure
2.4.1 Startup
The flame composition for the strain rate of 20 s-1 is taken as the standard stable laminar air-methane diffusion flame condition irrespective of the actual flame composition and strain rate for which the experiment is to be run. Once this flame is achieved the flow rates and strain rates are varied as required for the particular experimental run. The outlet pressure for all the gases is fixed at 300 kPa absolute (30 psig). Initial check up is carried to ensure that all the valves on the experimental apparatus are closed. The cooling water supply and return are turned on. The cooling of the top half of the cylinder is manually felt to ensure that effective cooling of the top half of the burner carrying the hot exhaust continues normally. The carbon tape from SPI is cut and applied on the scanning electron microscope (SEM) cylinder specimen mount from Ted Pella, Inc. It is placed in the specimen storage box from SPI which is kept dry by inserting SPI desiccant capsules.
flow controller is turned until the flow rate for the standard flame condition is achieved. The Microline custom pressure regulator panel for methane is shown in Figure 8.
Fig. 8. Microline custom made pressure regulator panel for methane.
Since combustible methane gas is dangerous if it spreads into the lab, it is essential that the standard flame condition is achieved without much delay. This is done very quickly in short steps with intervals, increasing the flow rate steadily in each step. At the end of each step, methane is given sufficient time to escape into the exhaust. The flame torch from Bernzomatic is tested for its operating condition away from the experimental apparatus. Once the standard flame condition is achieved, using the flame torch the mixture contained within the exit nozzles of fuel and oxidizer is lit. The rotameter is turned on so that the nitrogen shroud concentrically envelopes the flame and effectively contains it from spreading to the outside. The ignited stable flame photograph using a photo camera (30D, Canon Inc) is shown in Figure 9.
2.4.2 Running
of the probe can be changed by using the digital caliper with the lab jack. The standard flame is ignited and the procedure is repeated.
2.4.3 Shutdown
after the completion of the experimental run to ensure sufficient cooling of the burner. The cooling water supply and return valves are then closed.
2.5 Post experiment observation process
The initial observation of each probe sample after the experiment is carried out, is under the Zeiss Stemi 2000-C compound microscope where it is observed for any significant macroscopic effects that are visible to the naked eye. Any noticeable color change indicates the occurrence of chemical changes on the vanadium probe in the flame environment. Silvery shining coating with yellowish tinge on the vanadium probe starkly indicates typically the presence of vanadium oxide V2O5. If the synthesis has occurred on microscale level rather
than nanoscale, then the coating and its peaks protruding out on the probe surface can be seen vaguely by the naked eye and very clearly under the compound microscope. It is then observed under the scanning electron microscope to account for the microscale and nanoscale effects of the flame gradient synthesis. In addition, energy dispersive X-ray spectroscopy (EDS) is carried out on the samples which show promising nanostructures to identify the chemical composition of the synthesized species. This is then compared against the EDS output of a standard 99.99% V2O5 powder sample from Sigma-Aldrich. The peaks for the
3. OPPOSED FLOW DIFFUSION FLAME 3.1 Diffusion flames
In diffusion flames, the fuel and oxidizer are not initially mixed. The reaction occurs due to diffusion of fuel and oxidizer in proper proportions in the flame zone. A dimensionless number known as the Damköhler number (Da) is defined as the ratio of diffusion time to the chemical reaction time.
Da = diffusion time
reaction time (3.1)
diffusion flame is a strained flame and it is therefore convenient to use the strain rate to study these flames.
3.1.1 Counter flow diffusion flame
Fig. 10. Schematic of a counter flow diffusion flame.
The counter flow diffusion flame is modeled as two axisymmetric opposed jet flows shown in Figure 10. The flame is characterized by several parameters which include the strain rate, fuel and oxidizer flow rate and flame composition. We assume a very basic definition of strain rate ε such that the stagnation plane for the opposed gas streams is assumed to lie at
component can be ignored. Thus the counter flow diffusion flame is treated as essentially one-dimensional in the axial direction. Thus the temperature, chemical species and velocity gradients vary axially. This simplifies the governing equations of the counter flow diffusion flame. Then the strain rate in its simplest form is given by,
ε = v L
2 (3.2)
where L is the length between the fuel and oxidizer nozzle ends and v is the exit velocity of the fuel or oxidizer jets from their respective nozzles.
The assumptions made for the analysis of counter flow diffusion flame are:
1) Steady, laminar and axisymmetric boundary layer ∂ ≪∂x ∂ ∂y in transport .
2) Radiation, kinetic energy, potential energy, viscous dissipation and body forces are neglected.
3) The ideal gas laws are applicable.
4) There is only Fickian diffusion Dij=Dji=D .
5) There is global one-step chemistry. 6) Finite rate kinetics.
7) Constant pressure. 8) Lewis number Le=1.
conservation of momentum equation is neglected because it relates velocity to pressure, but pressure is already assumed to be constant.
dyd (ρv)≈- 2ρε
(3.3)
ρvdYi dy =
d dy ρD
dYi
dy + ωi where i=1,2,…N species (3.4)
ρCpv dT dy=
d dy λ
dT
dy - ωihi ° N i=1
where i=1,2….N species
(3.5)
where ρ is the density, v is the axial velocity, Yi is the mass fraction of species i, D is the
diffusivity, ωi is the mass production rate of species i per unit volume, Cp is the specific heat
at constant pressure, T is the temperature, ε is the strain rate, λ is thermal conductivity, hi° is
the enthalpy of formation of species i and y is the axial direction co-ordinate. The Shvab-Zeldovich and Howarth-Dorodnitsyn transformations are performed simultaneously and a normalized conserved scalar θi and stretched axial dimension η are introduced. This yields N
linear convection-diffusion equations and a single non linear equation with Arrhenius rate kinetics as shown in Eq. (3.7) and (3.8) respectively. In this case D1 is Damköhler first
number and is given by Eq. (3.6).
D1 = AYf,-∞
νf'
Yo,νo'+∞
d2θi dη2 + 2η
dθi
dη = 0 (3.7)
d2αT dη2 + 2η
dαT
dη =-D1Yf
νf'
Yo
νo'
exp -αa αT (3.8)
where Y ≡f Yf
Yf,-∞, Y ≡o Yo
Yo,+∞, αa=
CpEa
qRu, q=
heat of reaction
kg of oxidizer , Ru is the universal gas
constant, Ea is activation energy and A is the pre-exponential constant in Arrhenius equation.
The boundary conditions applied to the Eq. (3.7) and (3.8) are given in Eq. (3.9).
η→ -∞, θi = 1, αT= αT,-∞ η→∞,θi = 0, αT= αT,+∞
(3.9)
There is no analytical solution to the non linear Eq. (3.8) and hence activation energy asymptotics are used to solve it numerically. The exact solution to the linear convection-diffusion equation is given by Eq. (3.10).
θi=
1
2erfc(η) (3.10)
The flame is always assumed to be at the stoichiometric condition and hence in terms of the stretched axial dimension η, the flame is at the position ηst. For hydrocarbon-air diffusion
combustion, θst< 1 2. Thus the flame sits on the oxidizer side below the stagnation plane
3.2 Flame structure for different flame conditions
By changing the composition of the reactants and strain rate, different flame conditions are achieved. The standard air-methane flame is always ignited initially during the experiment run. The specific changes in the flame condition are carried out after the standard flame has been established. During the shutdown, the flame is brought back to its standard flame condition and stabilized before shutdown.
The standard flame is always set for strain rate of 20 s-1. It is composed of 100% air by volume without any oxygen enrichment as its oxidizer composition and 100% methane by volume without any acetylene dilution as the fuel composition. Thus the methane and air flow rates are same since the fuel and oxidizer nozzle diameters are same. The simplest definition of strain rate is used in Eq. (3.2) which ignores the density difference between reacting components. The additional changes to the flame composition are then carried out carefully.
3.2.1 Effect of oxygen enrichment
3.2.2 Effect of strain rate variation
The opposed flow diffusion flame shows the two blue oxidative and yellow soot zones distinctly. With changing the strain rate, the fuel and oxidizer nozzle exit velocities increase. The overall heat release rate increases [50]. However with the increased velocities of the opposed jets, the reaction zone of the flame gets squeezed and flattens the oxidative flame front. This causes the peak flame temperature to drop as the reaction zone shrinks. This is observed in Figures 12 (a, b) where the blue reactive oxidation zone is found to become thinner. The explanation for this seemingly contradictory result involves overall and specific heat release rates. The heat release rate is an extensive property and hence it increases with increasing the gas velocities by increasing the strain rate. However the intensive property to characterize the reactivity of the flame is the specific heat release rate which decreases with increasing strain rate [51]. Thus increasing strain rate causes the specific heat release rate and hence reactivity of the flame to decrease, due to which the flame loses heat and eventually extinguishes when heat loss cannot be sustained. The soot production decreases with increasing strain rate as the flame temperature decreases [45]. This is observed as the yellow zone diminishes and shines less brightly. Figures 12 (a, b) show the varying flame images with different strain rates of 20 s-1 and 40 s-1 respectively, for 50%O2+50%N2 volume
composition of the oxidizer. An excel sheet is used for the determination of flow rates and velocities of the reactants for a given strain rate and given reactant composition by volume. Different flame conditions are achieved by varying the volume composition of the reactants along with the strain rate. Appendix B shows the excel sheet used for the flame composed of 50%O2+50%N2 as the oxidizer composition and 96%CH4+4%C2H2 as the fuel composition
Fig. 12. Photographs of the flames with varying strain rates for 50%O2+50%N2 oxidizer
4. RESULTS FOR SYNTHESIS OF VANADIUM OXIDE NANOSTRUCTURES 4.1 Flame parameters affecting the synthesis
The probe flame interaction producing nanomaterials of metal oxide is achieved by utilizing the axial gradients of chemical species and temperature in the opposed flow diffusion flame [27]. The flame possesses distinct blue oxidation and yellow soot and pyrolysis zones as seen in Figures 11 (a-c) and 12 (a, b). The flame environment thus changes form a hydrocarbon rich zone near the fuel nozzle end to oxygen rich zone at the oxidizer nozzle end [27]. The flame synthesis is affected by the variation of probe position, residence time, reactant composition and strain rate. The variation in these parameters affects the synthesis in the following ways:
• By changing the probe position axially within the flame, the effect of the variation in
chemical and thermal gradients on the synthesis is taken into account.
• The change in the residence time incorporates the available time for crystal growth.
• The variation in the reactant composition and strain rate affects the axial gradients of
temperature and chemical species.
Fig. 13. Numerical profiles of temperature and major chemical species in opposed flow diffusion flame composed of 50%N2+50%O2 and 96%CH4+4%C2H2 [27].
The probe is heated by convection from the flame and cools by radiation. The energy balance is shown in Eq. (4.1). The conductive heat transfer through the probe material is neglected due to the small diameter of the probe.
hA T − T −σεA T = 0
(4.1)
The temperature of the probe can be evaluated from the relation in Eq. (4.2)
T = T −σεTh (4.2)
where h is the heat transfer coefficient, Ap is the surface area of the probe, σ is the
The heat transfer coefficient is evaluated from the Eq. (4.3).
h =kd Nu (4.3)
where Nu is the Nusselt number, k is the thermal conductivity of the fluid and d is the diameter of the probe. This shows that the temperature of the probe is always lower than the flame temperature. It begins approaching the flame temperature only in the limit of the infinitely small diameter. The probe temperature decreases with increasing diameter. Assuming the flame temperature of 2400 oC, the temperature difference is ~1000 K for probes which are 1 mm in diameter which is clearly observed in Figure 14.
4.2 General mechanism of material transport in flame environment
The lower surface of the inserted metal probe shows a slightly worn out pattern indicating loss of material from this region which undergoes oxidation. The synthesized V2O5 structures
are observed to cover the entire upper surface of the probe. The outer part of the probe shows abnormal peak like structures. Figure 15 provides a schematic of probe, showing the position of abnormal peak like structures.
Fig. 15. Schematic of the probe showing the position of abnormal V2O5 peak like structure
formation in relation to the flame position.
The highly oxidative environment of the flame results in the oxidation of vanadium to form V2O5. The high temperature at the lower surface of the probe vaporizes V2O5. It is
transported from the high temperature oxidation zone at the bottom to the slightly cooler temperature zone downstream. In this process the material gets transported axially not only through gradients of temperature but also of chemical species. Since this transport occurs from the oxidation zone, chemical species with oxygen content are predominant in chemically affecting the transported species. The probe cross-section showing deposits of V2O5 which are observed under SEM for understanding their morphology and also areas of
Fig. 16. Schematic of probe cross-section showing the material ablated from the bottom of the probe and the region of V2O5 deposition and also abnormal peak formation on the
exterior as compared to the interior surface of the probe.
These V2O5 vapors crystallize on the upper cooler surface of the probe. Thus V2O5
nanostructures and microstructures get formed. The mild discoloration of the outer end of the oxidized probe could be seen with the naked eye along with abnormal peaks projecting outward on the probe surface at its outer end when viewed under the Zeiss compound microscope in certain experiments where the oxidative environment was intense. This happens at the outer part of the probe since this part is subjected to the outer curving of the flame. The peaks are prominent at the exterior of the surface of the probe and they progressively become shorter in the interior of the probe surface. Their formation is dependent on the interaction between the probe surface and the outer curved part of the flame. The V2O5 deposits occurring in the interior region of the probe are viewed under SEM
4.3 Influence of axial position of probe on the morphology of synthesized structures 4.3.1 Morphology observed under SEM
The initial test condition selected is using low strain rate 20 s-1 and oxidizer composition by volume is 50%O2+50%N2. These parameters are selected based on the previous results for
solid support synthesis of tungsten oxide and molybdenum oxide nanorods which were performed at this strain rate and oxidizer composition [52]. The fuel composition selected is 100%CH4 initially. The addition of acetylene in the proportion 96%CH4+4%C2H2 is carried
out in the later experiments which did not yield similar results with vanadium as have been previously observed with tungsten and molybdenum [52]. The length between the fuel and oxidizer nozzle exits is kept fixed at 2.54 cm (1 inch). The axial position of the probe selected is 12 mm from the fuel nozzle end and residence time selected is 60 seconds.
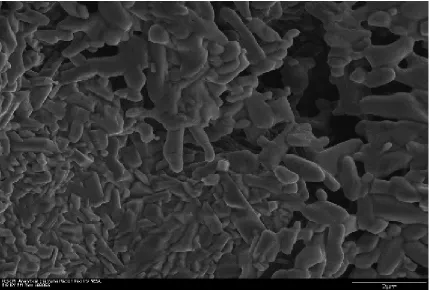
Deposits of nanomaterials could be seen with naked eyes projecting out on the surface of the probe. Channel like structures and striations of slight yellowish tinge indicating predominantly V2O5 are observed under the Zeiss compound microscope. Under the SEM,
thick network of channels is observed. These are long rectangular channels usually 10-20 μm
Fig. 17. SEM images of highly oxidized probe: (a, b) Dense overlapping and interconnected network of V2O5 microchannels.
growth is random such that the channels appear to be star shaped spreading about in all directions in their growth from the centre. Several such star like structures are observed scattered over the probe surface. Most of these channels are solid channels filled with material throughout when viewed in their cross-section plane. However in very few places, small hair like nanowires of about 30-80 nm in thickness and about 1.5-5 μm in length could
be seen growing on the surface of the microchannels, as shown in Figure 18. The dense network of channels is due to the intense synthesis in the combustion environment resulting in the synthesized structural dimensions being of microscale than nanoscale. A small percentage of channels are internally hollow channels, as shown in Figure 19 (a). Some of the other hollow structures observed are due to the gaps about 8-10 μm in dimensions existing in between the overlapped microchannels and microplates seen in Figure 19 (b).
Thus the axial position of the probe is shifted away from the high temperature oxidation zone of the flame toward the fuel nozzle end by 1 mm making the new axial position of the inserted vanadium probe at 11 mm from the fuel nozzle end. The other flame parameters are kept constant.
Under the SEM, a dense overlapping layer of rectangular chips about 300-400 nm in thickness and about 1 μm in length could be seen predominantly near the outer end of the probe as shown in Figure 20. Similar crystallite structures of slightly larger microscale dimensions are also observed in hydrothermal synthesis [53], [54] and by using the spin coating and annealing procedure [55]. The experimental result obtained by the flame gradient technique has been able to replicate these results at a nanoscale which is unique. This once again demonstrates the advantage of flame gradient technique where careful manipulation of parameters results in fine tune control of the morphological aspects to the order of nanoscale.
Over the remaining surface of the probe, oblong structures made of about 2-4 bead like components could be seen scattered randomly. The beads are about 500-700 nm in length and about 150-300 nm in diameter. 2-4 of these beads are linked end to end or are piled and appear like oblong structures dispersed over the probe surface as seen in Figures 21 (a, b).
Fig. 21. SEM images of nanobeads of V2O5 which show their end to end linking forming
Spherical nanoparticles of V2O5 about 50 nm in diameter attached to each other in branches
have been synthesized [30]. These bead like structures bear no resemblance to the clusters of spherical nanoparticles but rather appear to be primordial building blocks for the formation of the chip like structures. These beads get linked to each other or even merge into each other producing the nanochips. Near few of the rectangular chip like structures, channels about 1-3 μm in thickness and about 20-40 μm long are observed as shown in Figure 22. Over these
channels, nanowires about 3μm long and 50-70 nm in diameter could be seen projecting
outwards as observed in Figure 23. However these structures do not dominate the probe surface.
Fig. 23. SEM image of the nanowires growing at the tips of microchannels at axial position 11 mm.
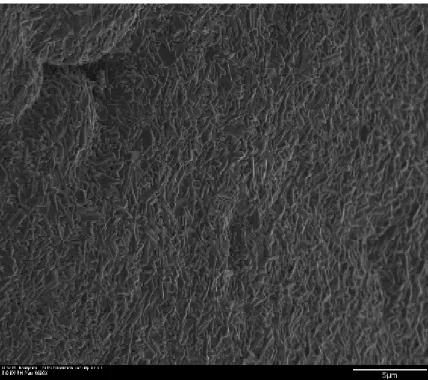
Fig. 24. SEM image of nanowalls scattered over probe surface.
The walls appear to have rough curves as well as rough edges while in some cases they appear to be pointed as needles. These nanowalls are typically 60-120 nm in thickness and about 1-2 μm in length and height as seen in Figures 26 (a, b).
The synthesized nanowalls may also contain soot or may be composed of hydrocarbons entirely. In order to identify the chemical composition of the synthesized nanowalls, energy dispersive X-ray spectroscopy (EDS) is carried out. These results are then compared with the X-ray spectrum obtained from a standard V2O5 powder sample of 99.99% purity from Sigma
Aldrich. The setting of the standard is explained in the next Section.
4.3.2 Setting a standard for EDS
The EDS is carried out at various locations within the V2O5 powder to minimize the error due
to peculiarities at some locations. Also at each location, EDS is carried out multiple times with longer real time capture of X-rays to ensure that large number of counts of the X-rays are detected. Usually the real time employed for capture of X-rays is around 300-400 seconds to ensure X-ray count to be around 20,000. This minimizes the error due to lower count of detected X-rays. The SEM image of the sample used as the standard is provided in Figure 27. EDS is carried out at various energies from 5, 10, 20 to 30 keV and the results are shown in Figures 28-31.
Fig. 28. EDS carried out on standard V2O5 powder sample at 5 keV.
Fig. 29. EDS carried out on standard V2O5 powder sample at 10 keV.
Fig. 30. EDS carried out on standard V2O5 powder sample at 20 keV.
Fig. 31. EDS carried out on standard V2O5 powder sample at 30 keV.
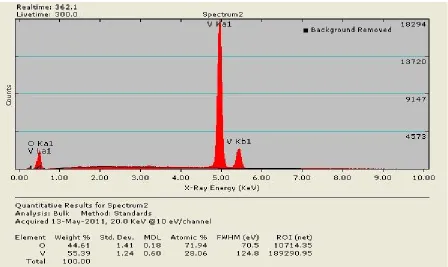
The effect of increasing voltages is clearly seen in Figures 28-31. The lower energies of 5 and 10 keV are not able to penetrate deep into the sample but can scan more area of the sample. As a result they are only able to better pick up the lower energy X-rays for vanadium specifically the one occurring at La1. However the higher energy X-rays occurring at Ka1 and Kb1 for vanadium are not detected with the use of 5 keV and are not smoothly detected by 10 keV energies. Once the energy is increased to 30 keV, only the higher energy X-ray is detected while the lower energy X-ray for vanadium is barely picked up in comparison. Therefore it is decided to select 20 keV for EDS for it resolves both these high and low energy X-rays problems for vanadium. Figure 32 shows the EDS with 20 keV where both the low energy and high energy X-rays for vanadium are detected clearly.
The overlap of X-rays for oxygen and low energy X-ray for vanadium poses a difficulty in determining the definitive presence of either vanadium or oxygen or both. However since this sample is 99.99% purity V2O5, it can be reasonably assumed that the low energy X-ray
detected corresponds to both vanadium as well as oxygen. This assumption can only be made safely if the composition of the standard sample is known with certainty.
Now at the same location on the powder, for 20 keV, another reading for EDS is taken to check for any drastic variations in the detected X-ray spectrum as shown in Figure 32. The ray spectrum observed shows the characteristic spikes observed at the locations where X-rays are detected for vanadium and oxygen. The earlier spike occurs at lower energy X-ray within 0.0 to 1.0 keV, while the other spike is close to 5.0 keV at higher energy X-ray. The lower energy spikes are difficult to observe due to the large difference in the number of counts detected at lower and higher energy X-rays. The atomic percentage for both the cases is also very similar within the standard deviation. Thus X-ray spectrum shown in Figure 32 is set as the standard.
4.3.3 EDS characterization of the synthesized nanowalls
EDS is carried out on the samples showing nanowall growth. These results are shown in Figures 33 and 34. These results are then compared with a standard X-ray spectrum for V2O5
Fig. 33. EDS for the nanowalls showing characteristic peaks for vanadium and oxygen in regions lightly covered by nanowalls.