P R O C E E D I N G S
Open Access
Identification of low frequency and rare
variants for hypertension using sparse-data
methods
Ji-Hyung Shin
*, Ruiyang Yi and Shelley B. Bull
*FromGenetic Analysis Workshop 19 Vienna, Austria. 24-26 August 2014
Abstract
Availability of genomic sequence data provides opportunities to study the role of low-frequency and rare variants in the etiology of complex disease. In this study, we conduct association analyses of hypertension status in the cohort of 1943 unrelated Mexican Americans provided by Genetic Analysis Workshop 19, focusing on exonic variants inMAP4
on chromosome 3. Our primary interest is to compare the performance of standard and sparse-data approaches for single-variant tests and variant-collapsing tests for sets of rare and low-frequency variants. We analyze both the real and the simulated phenotypes.
Background
Despite the success of genome-wide association studies, much of the genetic contribution to complex diseases and traits remains unexplained. Therefore, an increasing number of studies have turned to low-frequency and rare variant association analysis for additional explan-ation of disease risk or trait variability. For binary phe-notypes, single-variant analyses of low-frequency and rare variants are challenging because the conventional logistic regression approaches often violate the large-sample-size assumption for test statistics, resulting in poor type 1 error control or low statistical power [1, 2]. The standard score test, in particular, can be extremely anticonservative under the null [3]. Variant-collapsing methods across multiple variants or sparse-data methods for single-variant analysis offer an alternative [1–5]. Fur-thermore, depending on the linkage disequilibrium (LD) structure, it is possible that even nonfunctional low-frequency or common variants can capture functional rare variant signals [4]. On the other hand, because power is higher for a variant with a higher minor allele frequency (MAF), a common functional variant will
usually be better detected by a single-variant test rather than as part of a collapsing test that incorporates non-functional variants.
In this report, we analyze the exome-sequence data and both the real and simulated phenotype data of the unrelated Mexican American sample to evaluate and compare the performance of single-variant and variant-collapsing methods for association analysis.
Methods
To relate genotypes to hypertension, we consider the logistic regression model
logit P HTNið ð ¼1jcovariatesÞÞ
¼ β0þ AGEiβaþ SEXiβsþ Giβg;
wherei= 1, …, 1943 indexes the individuals, HTNi
indi-cates hypertension status of the ith individual (1 if the individual is hypertensive and 0, otherwise);AGEi is the
age at the time of examination,SEXiis the gender of the
individual, and Gi¼ðGi1;Gi2; …; GimÞ indicates the
vector containing the numbers of copies of the nonrefer-ence alleles atmvariants (ie, additively coded genotype), and βg0¼ β1;β2;…; βmis the vector of the associated
parameters.
* Correspondence:[email protected];[email protected]
Lunenfeld-Tanenbaum Research Institute, Sinai Health System, University of Toronto, Toronto, ON M5T 3L9, Canada
For a single-variant analysis with m= 1, we apply 2 types of nonstandard approaches: Firth-type penalized logistic regression likelihood ratio (LR) tests [2, 6–8], and small-sample adjusted score tests [9], and compare them to standard LR and score tests. The LR and score tests are asymptotically equivalent but may be discrepant in finite samples. The penalized LR test is based on the penalized log-likelihood function
lpð Þ ¼β lð Þ þβ 1
2logðjið ÞβjÞ;
where i(β) is the Fisher information matrix. This is a generalization of Haldane’s statistic for sparse 2 × 2 table analysis, where 1
2 is added to each cell. For the
small-sample-adjusted single-variant score tests, we apply an approach to adjust the null distribution of the test statistic by incorporating small-sample variance and/or kurtosis (see Lee et al. [9], pp. 226–227); this approach was origin-ally recommended for variant-collapsing tests.
For variant-collapsing analysis, we consider a MAF-based weighted burden test [1], a nonburden sequence kernel as-sociation test (SKAT) and a unified approach (SKAT-O) that optimally combines a burden test and a SKAT (eg, Lee et al. [9]). For these tests, we first defineKsubregions, then pool the variants within each subregion, and test K null
hypotheses H0K : β1;β2;…; βmk
0
¼ð0; 0;…; 0Þ0, where
mk indicates the number of variants within the k-th
subregion (k= 1,…, K). For convenience, we determine the subregions on the basis of physical proximities among the variants.
Applying these methods, we analyzed exonic variants within MAP4 gene on chromosome 3 in the real and the simulated phenotype data sets. For the imputed var-iants, we analyzed the predicted dosages rather than their best-guess genotypes. In addition, we examined all polymorphic variants, including the singletons to assess the extremes at which the tests break down. For the standard and penalized logistic regression tests, we used the R glm function and pmlr (Penalized Multi-nomial Logistic Regression) package [10], respectively. For the small-sample-adjusted score test and the variant-collapsing tests, we used the R package SKAT [11], with analytical variance estimates and empirical kurtosis estimates based on 10,000 bootstrap replicates. For the variant-collapsing methods, we let K= 6 based on a visual inspection of the physical positions of the variants (Fig. 1a).
Data preparation
In the real data set, we defined the hypertension pheno-type using the conventional diagnostic criteria: a systolic blood pressure (SBP) greater than 140 mm Hg or a diastolic blood pressure (DBP) greater than 90 mm Hg. We also defined individuals on antihypertensive medication to be hypertensive regardless of their SBP and DBP levels.
For the simulated phenotypes, 2 data sets were avail-able, “SIMQ1” and “SIMPHEN,” each with 200 repli-cates. SIMQ1, designed for evaluating type 1 error rates, contained normally distributed Q1 generated under no
genetic effects. Because SIMQ1 did not have binary phe-notypes, we dichotomized Q1 to create hypothetical
a
b
disease statusQ2, lettingQ2correlate with AGE and SEX
throughQ1. We letQ2= 1 ifQ1was greater than 51.2 and
0 otherwise, such that the disease prevalence for Q2was
17.8 %, the same as the prevalence of hypertension in SIMPHEN, which we used for evaluating power. The hypertension phenotype was derived from blood pressure phenotypes generated under a model with more than 1000 variants in more than 200 genes [12].
Results
MAP4variants in the unrelated sample
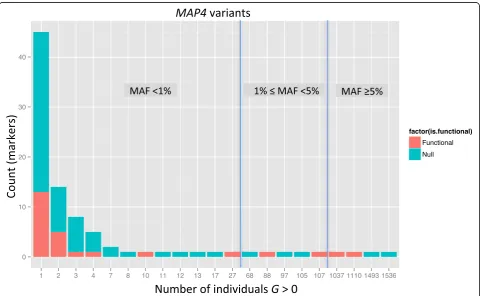
Of the 409 exonic MAP4 variants, only 90 were poly-morphic in the sample of 1943 unrelated individuals. These variants had MAFs ranging from 0.00027 to 0.34. As expected, rare variants (MAF <1 %) were most prevalent in the sample; except for 4 common variants, all variants had MAF less than 5 % (Fig. 2, Table 1). As expected for rare variants (eg, Pritchard [13]), the pairwise LD in the 90 variants was generally weak, with the exception of a few variants in strong LD in an upstream region (see Fig. 1). However, the strong LD seems to arise because of their physical proximities (all the markers in the LD block are located within 39 bases).
Analysis of the real phenotype data
We found that the standard score test rejects the null hypothesis far more often than the other single-variant tests (results not shown), suggesting that it may be anti-conservative. This agrees with published simulations under a case-control design [3] and is confirmed by our own unpublished simulation studies under a cohort design at the observed hypertension prevalence of
Fig. 2Distribution of the frequency for the 90 polymorphicMAP4variants according to the number of individuals with genotype dosageG> 0. Height of the bars indicates the total number of variants for a given count of observations withG> 0, and red bars indicate the counts for the 26 functional variants used in the simulation model
Table 1Frequencies of rare (MAF<1 %), low-frequency (1 %≤ MAF <5 %) and common (MAF≥5 %) variants inK= 6 subregions withinMAP4region on chromosome 3
Subregion Variant IDs Rarea Low-frequencya Commona Totala 1 1–16 14 (4) – 2 (0) 16 (4) 2 17–38 20 (7) 2 (0) – 22 (7) 3 39–53 15 (0) – – 15 (0) 4 54–77 20 (10) 2 (1) 2 (2) 24 (13) 5 78–86 9 (0) – – 9 (0) 6 87–90 3 (1) 1 (1) – 4 (2) Total – 81 (22) 5 (2) 4 (2) 90 (26)
a
26 %. After correcting for multiple testing, no single-variant tests identified any association (minimum un-adjusted p value = 0.006). The burden, SKAT and SKAT-O (optimal sequence kernel association test) tests, each of which pooled all polymorphic variants within the K= 6 subregions defined in Table 1 and Fig. 1a, did not find the MAP4 gene to be significant either (minimum unadjusted p values = 0.12, 0.24, and 0.20, respectively).
Analysis of the simulated phenotype data
It has been demonstrated that for a genome-wide study with a large sample size, minor allele count (MAC) is the key parameter determining test calibration [3]. Be-cause we analyzed predicted dosages, we do not have a MAC for all the variants. Hence, for the presentation of simulation results, we use the count of individuals with
G> 0 dosage, denoted by MACg , which is close to the MAC for a low MAF. For type 1 error rates of the single-variant tests, we pooled the results across all vari-ants with the same values ofMACg . Power for the single-variant tests was evaluated separately for each of the 26 functional variants. For the variant-collapsing tests, power was examined for each subregion containing at least one functional variant.
Test size and type I error
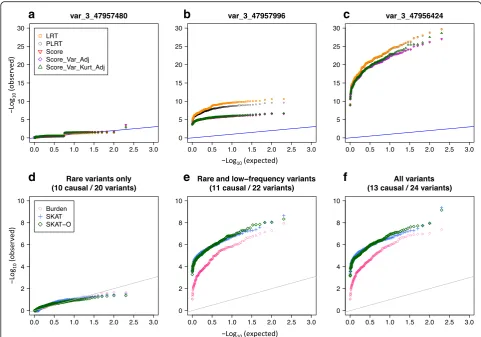
Examination of quantile–quantile (Q-Q) plots of the single-variant test pvalues for rare variants revealed departures from the expected distribution under the null hypothesis of no genetic effects with some discrepancies among tests. For
example, for var_3_47660325, with MACg ¼1; all the single-variant tests showed unusual departures from the expected (Fig. 3a). For low-frequency variants, thepvalue distributions were close to the expected, except in the upper tail where all tests seemed to be anticonservative (eg, Fig. 3b). As expected, the common variant test p values were close to the null distribution with no discrepancy among the tests (eg, Fig. 3c).
Examination of empirical type 1 error rates for the single-variant tests demonstrates that no method per-formed uniformly better than others for the rare variants with very low MACs (Fig. 4). For example, when MACg is less than 15, the standard score test tended to be anticonservative at a significance testing level of 0.01 (Fig. 4), but was conservative at the less stringent signifi-cance level of 0.05 (results not shown). The standard LR test tended to be conservative for low MACg (eg, <10), but could be anticonservative when this count was be-tween 10 and 20. Although the 2 small-sample score tests could also be anticonservative, and the penalized LR test tended to be conservative in general, the type 1 error rates of these tests were closer to the nominal level than the standard tests. WhenMACg is 66 or greater (or MAF >1 %), all the single-variant tests seem to control type 1 error reasonably well.
Power
All the single-variant tests had power of less than 20 % to detecteach ofthe rare variants, but had 100 % power for the low-frequency and the common variants at the significance levels of 0.01 and 0.05. For the
low-a
b
c
frequency variants, tests had discrepant p values, and differential power at a stricter significance level. For ex-ample, in Fig. 5b, all the tests for var_3_47957996 (MAF = 0.0024) had pvalues of less than 0.01; however, the 2 LR tests had consistently lowerpvalues than the 3 score tests. At a significance level of 1e–06, the standard and penalized LR tests had 91 and 82 % power, respectively, whereas the standard, the small-sample-variance, and the small-sample-variance-kurtosis score tests had less than 10 % power.
Among the 4 subregions with at least 1 functional variant, power was nonnegligible only in subregions 4 and 6 (Table 2). Figure 5d-f shows the results from the variant-collapsing tests of the markers in subregion 4, which contains all 3 types of functional variants (rare, low-frequency, and common). As expected, the burden test tended to have lower power than SKAT or SKAT-O because the subregion includes both protective and deleterious variants. These tests all had low power when the subregion includes only rare variants (eg, Fig. 5d). The power improved when the subregion in-cluded both the rare and the low-frequency functional variants (eg, Fig. 5e). When, however, the common vari-ants were additionally included, the power did not seem to improve further (Fig. 5f ). When compared with the single-variant tests of markers in the same subregion (Fig. 5b and c), the results suggest that this subregion would have been detected by some of the single-variant tests, as well, even at the genome-wide significance level of 5e–08.
Discussion and conclusions
In this article, we evaluated standard and sparse-data methods for single-variant and variant-collapsing tests to examine the association between a hypertension pheno-type and exonic variants inMAP4gene on chromosome 3, using both the real and the simulated phenotypes in unrelated Mexican Americans.
In the analysis of the real phenotype data, none of the single-variant and the variant-collapsing methods detected MAP4 variants significantly associated with hypertension. A limitation of our analysis is that we did not make any adjustment for ancestry admixture/ population structure. In genetic association studies of admixed populations such as Mexican Americans, ad-dressing differential ancestral backgrounds is import-ant to avoid false positive or negative association signals [14, 15].
In our simulation investigation, we found that the sparse-data approaches improve type 1 error control, but their power remains low for detecting the rare vari-ant effects. Because power of the association tests de-pends on both frequency and effect size of rare variants, even with large effects, the tests may detect rare variants only in studies with large samples. We may be more suc-cessful in identifying rare variants when we use joint or meta-analyses combining data or summary statistics from different studies (eg, Ma et al. [3]). For the low-frequency variants, all the single-variant tests seem to have improved type 1 error rates and power. It seems that the LR tests have higher power than the score tests
a
d
b
e
c
f
Fig. 5Q-Q plots of thepvalues from the single-variant tests and variant-collapsing tests of markers in subregion 4 (see Table 1 and Fig. 2a). Panels (a) to (c) show thepvalues from the single-variant tests for a rare, low-frequency, and common functional variant, respectively; the tests are the standard likelihood ratio test (LRT), penalized likelihood ratio test (PLRT), standard score test (Score) and small-sample-adjusted score tests (Score-Var-Adj and Score-Var-Kurt-Adj), which are indicated by yellow squares, black circles, red point-down triangles, purple diamonds, and green point-up triangles, respectively. Panels (d) to (f) show the results from the variant-collapsing tests when they include the rare variants, rare and low-frequency variants, and all the variants within the region. Thepvalues from the weighted burden tests, SKAT, and SKAT-O are, respectively, represented by pink circles, blue cross marks, and green diamonds. The calculations are based on 200 simulated data sets in SIMPHEN
Table 2Empirical power estimates of the collapsing-variant tests based on 200 simulated data sets in SIMPHEN, according to the
MAP4subregions containing at least 1 functional variant
Burdena SKATa SKAT-Oa
Significance level Subregion Rare Rare & low- frequency All Rare Rare & low- frequency All Rare Rare & low- frequency All 0.01 1 0 0 0.260b 0.005 0.005 0.840b 0.005 0.005 0.805b
2 0 0.005 0.005 0 0.145 0.145 0 0.090 0.080 4 0 0.955 0.955 0 1.000 1.000 0 1.000 1.000 6 0 0.990 0.995 0 1.000 1.000 0 1.000 1.000 0.05 1 0.045 0.045 0.555b 0.015 0.020 0.960b 0.015 0.015 0.970b
2 0.060 0.030 0.030 0.020 0.330 0.330 0.005 0.255 0.250 4 0.030 0.990 0.990 0.025 1.000 1.000 0.015 1.000 1.000 6 0.105 1.000 1.000 0.075 1.000 1.000 0.085 1.000 1.000
a
For each subregion, power was estimated when a test includes only rare, rare and low-frequency, and all variants b
at a stringent significance level. However, we cannot make any concrete conclusions because of the limited number of replications provided in the simulation de-sign. Although more thorough investigation is necessary, overall, the penalized LR test and the score test with small-sample variance and kurtosis seem to be better choices than the standard tests for the analyses of rare and low-frequency variants. Moreover, caution is indi-cated when different tests of the same hypothesis give inconsistentpvalues as it suggests large-sample approxi-mations for test statistics may be invalid.
Although previous simulation studies have shown that collapsing tests can have greater power than single-variant tests (see, eg, Madsen and Browning [1]), our investigation suggests that power of collapsing tests can be low when the tests include only the rare variants (see, eg, Fig. 5d). In addition to MAF and effect size, power of collapsing tests depends on the number of as-sociated variants, the number of neutral variants, and whether the direction of effects is consistent within gene, so that selection of good binning and weighting strategies may boost power for detecting regions con-taining only rare variants.
Acknowledgements
We thank the reviewers for their careful reading of the manuscript and thoughtful comments.
Declarations
This work was supported in part by grants from the MITACS Network of Centres of Excellence in Mathematical Sciences and the Natural Sciences and Engineering Research Council of Canada.
This article has been published as part ofBMC ProceedingsVolume 17 Supplementary 7, 2016: Genetic Analysis Workshop 19: Sequence, Blood Pressure and Expression Data. Summary articles. The full contents of the supplement are available online at www.biomedcentral.com/bmcgenet/ supplements/17/S2. Publication of the proceedings of Genetic Analysis Workshop 19 was supported by National Institutes of Health grant R01 GM031575.
Authors’contributions
JS and SBB designed the overall study and drafted the manuscript. JS and RY conducted statistical analyses. All authors read and approved the final manuscript.
Competing interests
The authors declare that they have no competing interests.
Published: 18 October 2016
References
1. Madsen BE, Browning SR. A groupwise association test for rare mutations using a weighted sum statistic. PLoS Genet. 2009;5(2):e1000384. 2. Heinze G, Schemper M. A solution to the problem of separation in logistic
regression. Stat Med. 2002;21(16):2409–19.
3. Ma C, Blackwell T, Boehnke M, Scott LJ, the GoT2D investigators. Recommended joint and meta-analysis strategies for case-control association testing of single low-count variants. Genet Epidemiol. 2013;37(6):539–50.
4. Kinnamon DD, Hershberger RE, Martin ER. Reconsidering association testing methods using single-variant test statistics as alternatives to pooling tests for sequence data with rare variants. PLoS One. 2012;7(2):e30238. 5. Kosmidis I. Bias in parametric estimation: reduction and useful side-effects.
Wiley Interdiscip Rev Comput Stat. 2014;6:185–96.
6. Firth D. Bias reduction of maximum likelihood estimates. Biometrika. 1993; 80:27–38.
7. Bull SB, Mak C, Greenwood CM. A modified score function estimator for multinomial logistic regression in small samples. Comput Stat Data Anal. 2002;39:57–74.
8. Bull SB, Lewinger JP, Lee SS. Confidence intervals for multinomial logistic regression in sparse data. Stat Med. 2007;26(4):903–18.
9. Lee S, Emond MJ, Bamshad MJ, Barnes KC, Rieder MJ, Nickerson DA, Christiani DC, Wurfel MM, Lin X. Optimal unified approach for rare-variant association testing with application to small-sample case-control whole-exome sequencing studies. Am J Hum Genet. 2012;91(2):224–37.
10. Colby S, Lee S, Lewinger PJ, Bull SB: pmlr: Penalized Multinomial Logistic Regression. R package version 1.0; 2010. http://CRAN.R-project.org/package=pmlr. 11. Lee S, Miropolsky L, Wu M: SKAT: SNP-Set (Sequence) Kernel Association Test. R
package version 0.95; 2014. http://CRAN.R-project.org/package=SKAT. 12. Blangero J, Teslovich TM, Sim X, Almeida MA, Jun G, Dyer TD, Johnson M,
Peralta JM, Manning AK, Wood AR, et al. Omics squared: Human genomic, transcriptomic, and phenotypic data for Genetic Analysis Workshop 19. BMC Proc.
13. Pritchard JK. Are rare variants responsible for susceptibility to complex diseases? Am J Hum Genet. 2001;69(1):124–37.
14. O'Connor TD, Kiezun A, Bamshad M, Rich SS, Smith JD, Turner E, NHLBIGO Exome Sequencing Project; ESP Population Genetics, Statistical Analysis Working Group, Leal SM, Akey JM. Fine-scale patterns of population stratification confound rare variant association tests. PLoS One. 2013; 8(7):e65834.
15. Bermejo JL. Above and beyond state-of-the-art approaches to investigate sequence data: Summary of methods and results from the Population-based Association Group at the GAW 19. BMC Genet. 2015;16 Suppl 3:S1. 16. Shin J-H, Blay S, McNeney B, Graham J: LDheatmap: an R function for
graphical display of pairwise linkage disequilibria between single nucleotide polymorphisms. J Stat Softw. 2006;16: Code Snippet 3.
• We accept pre-submission inquiries
• Our selector tool helps you to find the most relevant journal • We provide round the clock customer support
• Convenient online submission • Thorough peer review
• Inclusion in PubMed and all major indexing services • Maximum visibility for your research
Submit your manuscript at www.biomedcentral.com/submit