R E S E A R C H
Open Access
A data-driven method to detect and
localize the single-phase grounding fault in
distribution network based on synchronized
phasor measurement
Bo Wang
1, Hongxia Wang
1, Liming Zhang
2, Danlei Zhu
1, Dongxu Lin
3and Shaohua Wan
4*Abstract
The single-phase grounding fault of power systems is influenced by a variety of factors, resulting from the developing sizes and increasing complexity of power systems. In order to take advantage of big data in power systems, we propose a revised method with the use of synchronized phasor measurement. The data-driven method is designed to detect and localize the single-phase grounding fault, which reveals the correlation between eigenvalues and status of power systems. First, it calculates the contribution of the fault to each node; it then combines with a split window to monitor power systems in real time and to detect fault more efficiently. Based on the correlation between the elements of the matrix, it is robust against bad data and highly sensitive to weak signals. In general, the proposed method is applicable to various faults and well-functioning with real-time analysis. We test the proposed method with case studies from a distribution network with 80 nodes.
Keywords: Big data, High-dimensional zero-sequence current matrix, M-P law, Fault detection, Localization
1 Introduction
The single-phase grounding fault is the default method in power systems [1]. However, the access to high-permeability new energy has gradually evolved power systems into multi-source dynamic networks [2–6], which makes the single-phase grounding fault difficult to detect and eliminate, especially when the fault signal is weak, such as grounded by large resistance.
Synchronized phasor measurements have expanded access to data in power systems, which makes it easier to extract fault features [7]. With the data of synchronized phasor measurements, Cavalcante and Almeida presents an approach based on the short-circuit theory, which can accurately find the location of the fault and deal well with the influence of the random errors inherent in measurements [8]. In his work, the nodal impedance
*Correspondence:[email protected]
4School of Information and Safety Engineering, Zhongnan University of
Economics and Law, Wuhan 430073, China
Full list of author information is available at the end of the article
matrixZbus needs to be constructed at first, but in prac-tice, it is difficult to obtain accurate impedance parame-ters because of the mix of overhead lines and cables. Liu et al. argues locating the fault by using the relationship in a time difference of arrival of traveling wave [9], yet the accuracy of traveling wave velocity measurement is difficult to achieve in traveling wave fault analysis. Jiang et al. develops a new discrete Fourier transform (DFT)-based algorithm, which can eliminate system noise and measurement errors [10]; thus, the accuracy of the fault location can be guaranteed to some degree. However, these methods still use traditional approaches to analyze data from synchronous measurements and do not fun-damentally solve the key problems of fault detection and localization. On the one hand, the features of the fault signal are not easy to extract when it is weak. On the other hand, noises and bad data may make the fault mis-judged or even missed. This situation leads to an emerging paradigm of big data analytics, for detection and local-ization of the single-phase grounding faults in power systems[11–16].
The big data analytics make it approachable to capitalize on data from various fields and thus provide more infor-mation [17–32]. Many studies on big data analytics have been applied to power systems [33–40]. Among them, random matrix theory (RMT) is a mathematical statistical method which can directly mine the intrinsic connection of a system from data; thus, it can be applied to extract fault features and increase the accuracy of fault detec-tion and localizadetec-tion. RMT aims to calculate statistical features measured by eigenvalue statistics [34]. In the liter-ature, correlation analysis [34], multi-event analytics [35], and static and transient stability analysis of power systems have been successfully utilized [36,37]. Methods on fault localization have been proposed as well in [38]. Based on bat algorithm and random matrix theory, Kai introduces fault line selection, and Weibiao et al. argues for deter-mining the fault area by constructing augmented matrix [38]. The accuracy of these methods cannot be guaranteed when the distribution network is complex. Moreover, the complexity of the network will slow down the calculation speed.
Marchenko-Pastur law (M-P law) reveals the corre-lation between the elements of the matrix, which is one of the important laws in the random matrix the-ory (RMT). Based on the M-P law, this paper proposes a novel data-driven method to detect and localize the single-phase grounding fault, where the outliers in the spectrum of a zero-sequence matrix represent the sig-nal of the fault, and the fault localization indices of each node are calculated based on the outliers. By filter-ing the outliers and combinfilter-ing with the network struc-ture, the location of the fault is determined. Since the proposed method focuses on the correlation of the ele-ments in the matrix, it can extract information about the fault in the situation of weak signals. Combined with a split window, the fault detection and localization can be efficient and in real-time. Furthermore, bad data will not strengthen linkages between elements, so the pro-posed method is robust against bad data and can be well applied to the distribution network with a complex environment.
The remainder of this paper is organized as follows. Section 2gives out the random matrix theory and data processing. Section 3 presents the detection and local-ization method of single-phase grounding fault based on the M-P law. Section4 validates the effectiveness of the method proposed through three simulations. Finally, Section5draws a brief conclusion.
2 Random matrix theory and data processing The frequently used notations in this section are given in Table1.
The data from synchronized phasor measurement in power systems is typical spatial-temporal big data. It is
Table 1Notations for RMT and data processing
Notations Means
X,x,xij A matrix, a vector, an entry of matrix
XT,xT Transpose of a matrix and a vector
μ(x),σ2(x) Mean, variance forx
S The sample covariance matrix
N,T The row and column size of the split
Window
λ Eigenvalue of the matrix
p,n The row and column size of the matrix
v Eigenvector
˜
X A standard non-Hermitian matrix
Data source
therefore difficult for traditional analytical tools to sat-isfy the requirements of precision and accuracy of data processing in a big data environment through the estab-lishment of hypotheses and simplified models.
Random matrix theory (RMT) is an effective mathe-matical tool to analyze complex systems. The elements in the random matrix can be either deterministic data or random numbers that follow certain distributions. Although the matrix dimension of the random matrix the-ory needs to be infinite, a fairly accurate result can be observed in a matrix of moderate size (dimension from tens to hundreds) as well. This is the premise of ran-dom matrix theory for dealing with practical engineering problems [34].
According to RMT, when the dimensions of a random matrix are sufficiently large, and the size is determined, the empirical spectral distribution (ESD) of its eigenval-ues converges to some theoretical limits, such as the Ring law and the Marchenko-Pastur law (M-P Law) [34–38]. In this paper, the M-P law is used to analyze the operation of power systems and detect and localize the fault with high speed and sensitivity.
2.1 Sample covariance matrix and M-P law
For a given matrixXp×n, wherepandnrepresent the
num-ber of dimension and samples, respectively. Asp,n→ ∞ withc=p/n∈ (0, 1), the covariance matrix ofXp×ncan
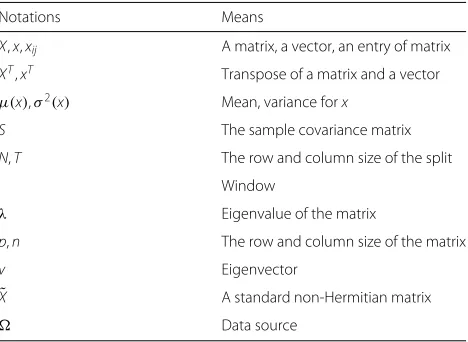
FS(x)= 1 tion. The limit of empirical spectral distribution is the limit spectral distribution. When the elements of a high-dimensional random matrix are independently identically distributed (IID.), with a mean of 0 and a variance of 1, the limit spectrum distribution of the sample covariance matrix of the random matrix converges to the following formula with probability 1: σ2is the variance of the matrix. This is the Marchenko-Pastur law (M-P law) based on variablescandσ2, which reflects a statistical property of high-dimensional matrix, and the eigenvalues will betweenaandb.
For matrices withc, bothb and limit spectrum distri-bution are deterministic, as shown in Fig. 1, where the outliers are circled in red.
2.2 Construction of high-dimensional zero-sequence current matrix and data processing
We use zero-sequence currents as the matrix elements because it will help to extract fault characteristics from a random matrix theory point of view.
Assuming there arepnodes equipped with a measur-ing device, each node generates a correspondmeasur-ing zero-sequence current at the sampling time ti, and the
mea-sured data of all nodes form a time vector:
x(ti)=
x1ti,x2ti,· · ·,xNti
T
(4)
Therefore, for a distribution network withpnodes andn sampling points, a high-dimensional matrix with sizep×n can be constructed, that is,
Xp×n=
Each row represents the same node and each column represents the same sampling time.
To convertXinto a standard non-Hermitian matrix,
˜
Xi=(Xi−μ (Xi)) /σ (Xi),i=1, 2,. . .p (6)
whereXiis thei-th column ofX, andμ (Xi)andσ (Xi)
are the mean value and variance of Xi, respectively. We
then get the matrixX˜ with mean of 0 and variance of 1. In order to conduct real-time analysis, the split window is used to construct the above matrix, and the size of the window isN×T, whereNis the number of all synchro-nized phasor measurements in the distribution network, andT is selected according toc =N/T ∈ (0, 1). We use c=0.4 in this paper.
To facilitate the real-time analysis, the split window has a step size of 1, that is, one new column of data is moved into the window at each moment, and one column of his-torical data is removed, so that the window containsT−1 column history data and 1 column of new data, that is,
˜
X(ti)=
˜
xti−T+1,x˜ti−T+2,· · ·,x˜ti (7)
2.3 Adaptability analysis of the M-P law in distribution network
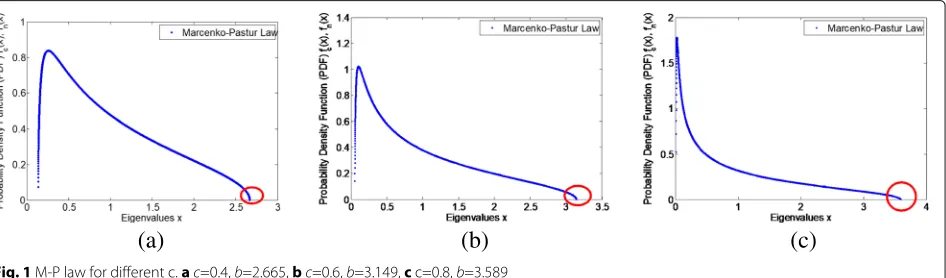
In order to verify the applicability of the M-P law to single-phase grounding fault detection and localization, the zero-sequence current matrix with 80×200 operating data from the 80-node distribution network is analyzed. When the distribution network is in normal operation, some of its parameters, such as the amplitude of volt-age and zero sequence current, etc., fluctuate near a fixed value, as shown in Fig.2a; the fluctuation is caused by measuring errors, noises, or small disturbance in network. Then, the data shows statistical randomness, which fol-lows the M-P law. When there is a single-phase grounding
(a)
(b)
(c)
(a)
(b)
Fig. 2Zero-sequence current data under different operating conditions.aNormal operation.bSingle-phase grounding fault
fault, as shown in Fig.2b, however, this random charac-teristic is broken, and there is a correlation within the system, so it no longer meets the M-P law. This means that M-P law can successfully distinguish the fault from data, which is the very reason that we use M-P law to analyse the zero-sequence current matrix.
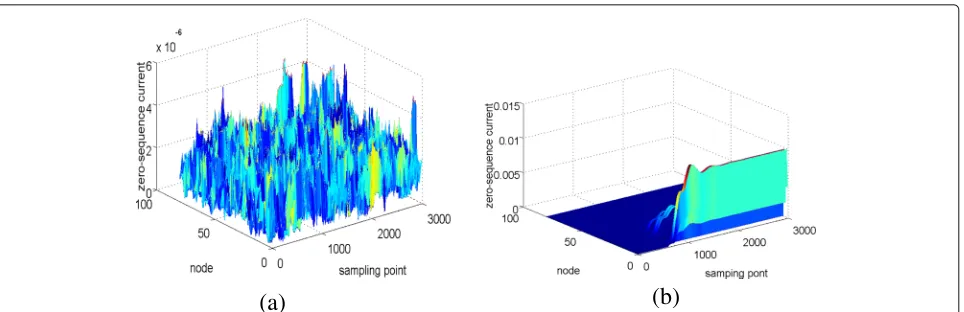
According to the M-P law, when the distribution net-work is running normally, the limit spectrum of covari-ance matrix of high-dimensional zero-sequence current matrix is in good agreement with the M-P law, that is,λi∈
(a,b), whereλiis one of eigenvalues ofSn,i=1, 2, 3· · ·n,
as shown in Fig.3a. While there is a single-phase ground-ing fault, because of the correlation within the network, limit distribution of these eigenvalues will not be in line with the M-P law anymore, and some eigenvalues will be larger than b, as shown in Fig. 3b, where kernel density estimation is the estimation of eigenvalues distribution; thus, these outliers can be filtered to detect and local-ize the grounding fault. This is the heart of the method proposed in this paper.
3 Detection and localization method of single-phase grounding fault in distribution network
3.1 Fault contribution valueL
According to the analysis above, if there is a fault in the distribution network, the eigenvalues of the covariance matrix will be out of range. Those larger than b repre-sent abnormal and important information, which can be used for fault detection and localization. The eigenvalues smaller thanaare also characterized as abnormal infor-mation, but since the information they carry is limited, they can be ignored. We define the contribution of each node to the fault asL. When no fault occurs, each node contributes 0 to the fault, and when there is a fault, the fault current flows from the source to the fault node, then those nodes with fault currents will contribute to the fault and theirLwill increase.
In this paper, all the eigenvalues larger than b are screened to calculate the contribution degree of each mea-suring point to the fault, and the contribution of each node to the abnormal eigenvalues is obtained by matrix calculation.
For the normalized high-dimensional zero-sequence current matrix X˜, the covariance matrix Sis a symmet-ric matrix, so singular value decomposition (SVD) can be performed:
S=WU (8)
where W andU are left and right eigenvectors, respec-tively, which are singular value matrix. From the literature [41],
Therefore, the fault contribution of thei-th node can be characterized as
The abnormal eigenvalues and the corresponding eigen-vectors are used to calculate the contribution degree of each node to the fault, the contribution degree of the eigenvalues larger than b is added by weight, and the weight is the value of the corresponding eigenvalue. The contribution of thei-th node is
(a)
(b)
Fig. 3Histogram of eigenvalue distribution in different operating conditions.aNormal operation.bSingle-phase grounding fault
whereλkis thek-th eigenvalue of the covariance matrix of
the high-dimensional zero-sequence current matrix.Wik
represents thei-th row element of the k-th eigenvector Wk, which is corresponding to thek-th eigenvalueλk, and
bis calculated from (3).
3.2 Flow of single-phase grounding fault detection and localization in distribution network
In order to achieve the purpose of quick detection and localization, we combine the moving split window with the fault contribution of each node in this paper and use Li ≥ 0.1 to detect and locate the fault. For a specific
period, the fault localization process steps are as follows:
3.3 Fault localization
The distribution network is an organic system in which each node is associated with each other. When a node fails, other nodes will be affected to different extents. The node through which the fault current flows has a greater contribution to the fault, and the node without
Algorithm 1Flow of fault detection and localization 1) determine the size of the moving split windowVN×T,
which
includes T −1 historical data, 1 current data, and the start timet0
2 normalizeVto getV˜
4) calculateS, which is corresponding toV˜
5)forS, conduct eigenvalue decomposition, and then cal-culateLi
(whereiis the number of each node)
6) sift nodes whoseLare larger than 0.1, and locate the fault by
using the structure of the network 7) move the moving split window. Repeat 2)-6)
process first filters out the nodes that exceed a certain threshold, and then determines the fault by combining with the structure of a distribution network, the location of the power supply, and the like.
In this paper, the nodes with fault distribution larger than 0.1 are selected as the fault location information. When there is a node with itsLlarger than 0.1, it can be argued that there is a fault and the range is selected by (13). Although random errors can arise when there is no fault sometimes, but to simplify and emphasize the problem of fault detection and localization, we just ignore them when they arise in normal operation stage.
loc=arg(Li≥0.1) (13)
where loc represents the location information, and arg(Li≥0.1)is a function to filter the nodes whoseLare
larger than 0.1. The threshold is selected based on the dis-tribution network model. In the simulation, we found that some nodes have significantly lagerLvalues than 0.1, and when we choose these nodes to locate the fault, the results are satisfactory. However, when we make the threshold smaller, although the results can be obtained correctly, the process is more complicated since more nodes will be fil-tered. Thus, we choose 0.1 as the threshold to make the fault detection and localization easier.
4 Simulation results and discussions
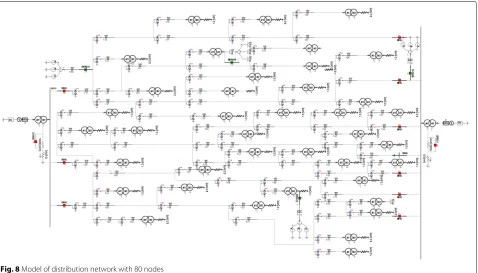
The proposed method is tested with the simulated data in an 80-node distribution network based on PSCAD, as shown in Figure 8 in theAppendix. With a sampling fre-quency of 20,000 Hz, zero-sequence current of each node can be generated. The transformers directly connected to the two power supplies adopt 110/11 ratio. Other trans-formers are with 10/0.38 ratio. Each branch is set to be one node, and the synchronized phasor measurement is installed at each node to obtain the zero sequence current. Three cases are designed to validate the effectiveness of the proposed method. For all cases, assume thatN= 80,T = 200, and the data sourceis 80×3000. The fault is set up whent=600.
4.1 Single-phase grounding fault of single node
4.1.1 Case 1: Single-phase grounding by small resistance
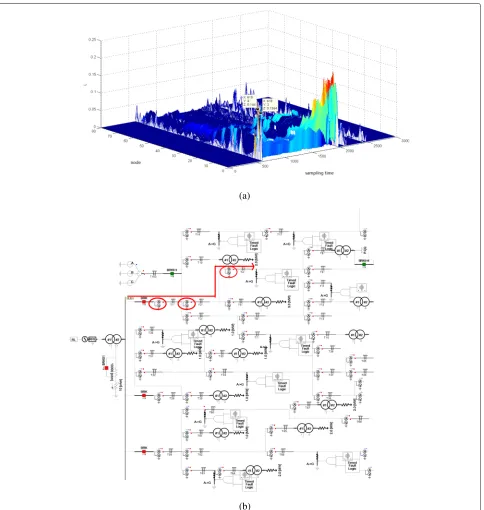
In case 1, node 4 is grounded by 10whent = 600, and the detection and localization results are shown in Fig.4.
In Fig.4a, based on theL-node-tcurve, we can detect signals based on the following analysis.
I. During the sampling timet = 1−617, theL of all nodes have values less than 0.1, which means that the system is normal without fault.
II. Whent= 618, theLof node 2 and node 4 increase to 0.1364 and 0.144, respectively. According to (13), it can be determined that there exists a single-phase grounding fault whent=618. The fault time was set to bet= 600,
so the delay is only 0.9 ms, which means that the proposed method can quickly detect the fault. Since it takes a certain amount of time forLto rise from 0 to 0.1, and the system requires a certain reaction time after the fault, the delay is inevitable.
III. Only node 2 and node 4 can be filtered to locate the fault in this case. As shown in Fig.4b, node 4 is at the end of the line. When it is grounded, the fault current would flow from node 1 to node 4, and through node 2, so the fault location can be determined at node 4.
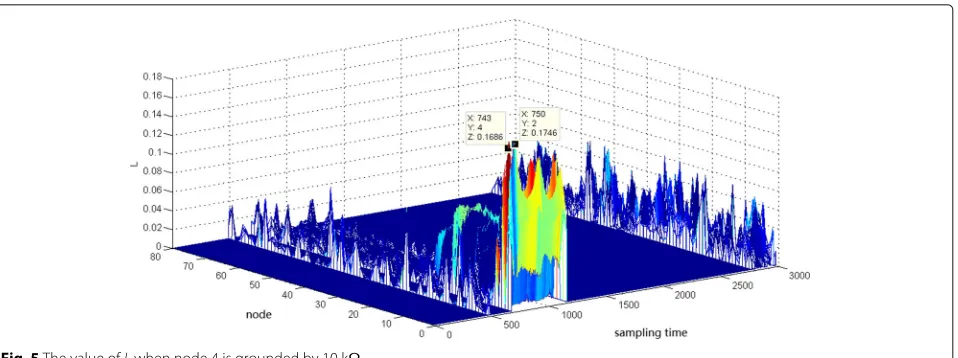
4.1.2 Case 2: Single-phase grounding by large resistance
In order to validate the effectiveness of the proposed method when the fault signal is weak, case 2 increases the grounding resistance to 10k. The results are as shown in Fig.5. It can be seen that the fault can be detected at t = 743, and the delay is 7.15 ms. This means that the weakness of the signal is reflected in the extension of time to detect the fault in the method proposed in this paper. In this case, a delay of 7.15 ms is still acceptable and the method is still time-saving. Since the filtered nodes are node 2 and node 4, the localization result is the same as Fig.4b.
4.1.3 Case 3: Comparison of time consumption across
different methods
To compare the time consumed of different methods, four methods are implemented for case 1, that is, M1: the method proposed in this paper, M2: the correlation anal-ysis [38], M3: wavelet transform method [42], and M4: a method based on RMT and Hausdorff distance. Table 2 shows the comparison results. For results of M2–M4, please refer to theAppendixsection.
In Table2, it can be seen that M3 uses the least amount of time, and M2 uses the most. M1 ranks third regard-ing the amount of time consumed. In general, the method proposed in this paper can function relatively quickly.
4.1.4 Case 4: Comparison of four methods when grounded
by large resistance
Case 4 compares the effectiveness across the four methods when node 4 is grounded by 10 k, as shown in Table3.
From Table 3 and the analysis above, we can detect signals based on the analysis below.
I. When grounded by 10 k, the fault signal is very weak and only the method proposed in this paper is effec-tive, which means that our proposed method is of high sensitivity and can react positively to different complex scenarios in a distribution network.
(a)
(b)
Fig. 4Node 4 is grounded by 10.aThe value ofLof each node when node 4 is grounded by 10.bSchematic diagram of fault localization when node 4 is grounded by 10
weak and the fault characteristics are difficult to extract. As such, MSR barely changes and M2 fails. For M3, it monitors some electrical quantities of the bus (such as zero-sequence voltage, zero-sequence current, etc.). Once the value of the electrical quantity exceeds the set thresh-old, it is considered that the fault occurs, and the fault localization procedure can be started. However, when the fault signal is weak, the bus voltage or current changes
little, then the fault cannot be identified and the fault localization cannot be achieved. Based on the random matrix and Hausdorff distance, M4 also starts by a sud-den change of the amplitude of some electrical quantities of the bus, so it fails with a weak fault signal as well.
Fig. 5The value ofLwhen node 4 is grounded by 10 k
accordingly, the fault detection and localization cannot be performed, which can be seen as their limitations. Since the method proposed in this paper is based on the internal correlation of the system and monitoring the distribution network from a global perspective with data-driven tools, there is no need to reduce the value ofLto make it sensible to the fault with weak signals.
In conclusion, the method proposed is of high sensitivity and high speed when facing single-phase grounding fault.
4.2 Simultaneous grounding fault for multi-node
4.2.1 Case 1: Two nodes grounded simultaneously
Multi-node faults may occur simultaneously in some areas in thunderstorm days. In order to validate the effective-ness of the proposed method in this situation, single-phase grounding faults are set at node 4 and node 11 at the same time, from 10 and 20, respectively. The results are shown in Fig.6.
In Fig.6a, with theL-node-t curve, we can detect signals based on the analysis below.
I. During the sampling timet = 1−613, theL of all nodes have values less than 0.1, which means that the system is in normal operation.
II. Whent =613, there are 6 nodes whoseLare larger than 0.1, which indicates the single-phase grounding fault of the distribution network. The fault is set to occur when t = 600, and it is detected whent = 613, so the delay is
Table 2Time consumption for four methods for node 4 grounded by 10
Method Time(s)
M1 132
M2 11520
M3 67
M4 151
0.65 ms, which verifies of the rapidity of the method. In fact, with the use of the split window, power systems can be monitored in real time, and likewise the analysis. The delay is due to the reaction time used by the system and the threshold chosen forL.
III. According to the structure of the network, the fault location can be determined as shown in Fig.6b. For node 11, once the fault occurs, fault current will flow from the power supply on the right side through node 27, 25, 13 to node 11. Since node 11 is at the end of the line, the fault can be located at node 11. For the fault at node 4, please refer to Section4.1. Case 1 shows the effectiveness of the proposed method in complex fault.
4.2.2 Case 2: Comparison of time consumption across four
methods
In order to compare the time consumed of different meth-ods, four methods are conducted for case 1, and the results are shown in Table4.
Since the two nodes are grounded by small resistance at the same time, the fault signal is strong enough, and the four methods are all applicable. In Table 4 , it can be seen that compared with the single node fault situa-tion, there is no significant change in time consumed for M1 and M2; for M3 and M4, the time is twice as large. In this situation, the proposed method takes the least amount of time to detect and localize the faults, indicat-ing that the proposed method is applicable to multi-node
Table 3Effectiveness comparison results for node 4 grounded by 10 k
Method Fault detection Fault localization
M1 √ √
M2 × ×
M3 × ×
(a)
(b)
Fig. 6Node 4 and node 11 grounded simultaneously.aThe value ofLwhen node 4 and node 11 are grounded simultaneously.bLocalization signal for node 4 and node 11 grounded simultaneously
simultaneous ground faults, which verifies the universality of the proposed method.
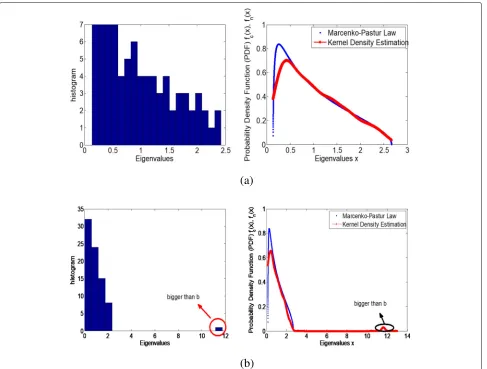
4.3 Robustness verification of bad data
Due to the data instability in the synchronized phasor measurement, the correctness of online fault diagnosis is reduced, since based on the data-driven tools, the
Table 4Time consumption for four methods for node 4 grounded by 10
Method Time(s)
M1 127
M2 1156
M3 133
M4 312
(a) (b) (c)
Fig. 7Results of robustness to bad data.at=635, node 4 grounded by 10.bt=645, node 4 grounded by 10k.ct=624, node 4 and 11 grounded simultaneously
5 Conclusion
This paper proposes a data-driven method to detect and localize the single-phase grounding fault from an over-all perspective in power systems, which is universal and can identify and locate single-phase grounding fault rela-tively fast and sensirela-tively. The method proposed can avoid complicated fault feature extraction process and provide fault location information at the same time of fault detec-tion; thus, it is of high speed; since the method proposed extracts fault features from the view of big data, thus, it is universal to various scenarios. Based on the correlation analytics of M-P law, the method is of high sensitivity and has good robustness to the bad data.
The current work is only a preliminary exploration of correlation analysis based on RMT, and much more research is needed in this direction. Due to statistical errors, sometimes, even if there is no fault in power systems, some eigenvalues will be larger thanb, though statistical errors will not continue to occur for a period of time. Therefore, it is necessary to consider the length of time during which abnormal eigenvalues appear. Fur-thermore, the proposed method can be used in any event localization such as locations of the electricity theft and abnormal power increases of some nodes.
Appendix
Fig. 9Results for M2
Table 5Results of M3
Node 4 8 9 22 23 D
4 – 0.01 0.01 0.01 0.01 0.01
8 0.01 – 0 0 0 0
9 0.01 0 – 0 0 0
22 0.01 0 0 – 0 0
23 0.01 0 0 0 – 0
Table 6Results for M4
Node 5 8 22 23
Abbreviations
DFT: Discrete Fourier transform; ESD: Empirical spectral distribution; IID: Independently identically distributed; M-P law: Marchenko-Pastur law; RMT: Random matrix theory; SVD: Singular value decomposition
Authors’ contributions
BW contributed on the design of the methods in distribution network based on synchronized phasor measurement. HW, LZ, and DZ presented the performance evaluation. XL and SW participated in the design and optimization of framework. All authors have read and approved the final manuscript.
Funding
The authors would like to thank the anonymous reviewers for their helpful insights and suggestions which have substantially improved the content and presentation of this paper. This work was supported by the National Natural Science Foundation of China No. 51777142, No.71371127, No.91846301, NO.71790615, NO.71431006 and No. 91846301, the Key Project for Philosophy and Social Sciences Research of Shenzhen City [No.135A004], and the Fundamental Research Funds for the Central Universities (Program No. 2722019PY052).
Availability of data and materials
The authors do not share the data, due to the requirements of the foundations.
Competing interests
The authors declare that they have no competing interests.
Author details
1School of Electrical Engineering, Wuhan University, Wuhan 430072, Hubei,
China.2Guangdong Power Grid Development Research Institute Co., Ltd., Guangzhou 510080, Guangdong, China.3Institute of Big Data Intelligent Management and Decision, Shenzhen University, Shenzhen, 518060, China. 4School of Information and Safety Engineering, Zhongnan University of
Economics and Law, Wuhan 430073, China.
Received: 9 June 2019 Accepted: 18 July 2019
References
1. Z. Kang, R. Liu, Y. Cao, A fault location method for single-phase grounding fault in distribution network. Power System & Clean Energy.8, 9 (2015) 2. R. Cespedes, E. Parra, A. Aldana, C. Torres, inIn 2010 IEEE/PES Transmission
and Distribution Conference and Exposition: Latin America (T&D-LA). Evolution of power to smart energy systems (IEEE, 2010), pp. 616–621 3. L. Qi, Q. He, F. Chen, W. Dou, S. Wan, X. Zhang, X. Xu, Finding All You Need:
Web APIs Recommendation in Web of Things Through Keywords Search. IEEE Transactions on Computational Social Systems (2019)
4. Y. Yin, F. Yu, Y. Xu, L. Yu, J. Mu, Network location-aware service recommendation with random walk in cyber-physical systems. Sensors. 17(9), 2059 (2017)
5. Z. Gao, D. Wang, S. Wan, H. Zhang, Y. Wang, Cognitive-inspired class-statistic matching with triple-constrain for camera free 3d object retrieval. Future Generation Computer Systems.9, 641–653 (2019) 6. S. Wan, Y. Zhao, T. Wang, Z. Gu, Q. H. Abbasi, K.-K. R. Choo,
Multi-dimensional data indexing and range query processing via voronoi diagram for internet of things. Future Generation Computer Systems.91, 382–391 (2019)
7. J. D. L. Ree, V. Centeno, J. S. Thorp, et al., Synchronized phasor
measurement applications in power systems. IEEE Transactions on Smart Grid.1(1), 20–27 (2010)
8. P. A. H. Cavalcante, M. C. D. Almeida, Fault location approach for distribution systems based on modern monitoring infrastructure. IET Generation, Transmission & Distribution.12(1), 94–103 (2018) 9. X. Liu, D. Wang, X. Jiang, N. Yi, Fault location algorithm for distribution
power network based on relationship in time difference of arrival of traveling wave. Proceedings of the Csee (2017)
10. J. A. Jiang, J. Z. Yang, Y. H. Lin, et al., An adaptive PMU based fault detection/location technique for transmission lines i theory and algorithms. IEEE Transactions on Power Delivery.15(4), 1136–1146 (2000) 11. Q. Zhang, S. Wan, B. Wang, D. W. Gao, H. Ma, Anomaly detection based on
random matrix theory for industrial power systems. Journal of Systems Architecture.95, 67–74 (2019)
12. Y. Zhou, Z. Tang, L. Qi, X. Zhang, W. Dou, S. Wan, Intelligent service recommendation for cold-start problems in edge computing. IEEE Access.7, 46637–46645 (2019)
13. S. Meng, L. Qi, Q. Li, W. Lin, X. Xu, S. Wan, Privacy-preserving and sparsity-aware location-based prediction method for collaborative recommender systems. Future Generation Computer Systems.96, 324–335 (2019) 14. X. Xu, Q. Liu, X. Zhang, J. Zhang, L. Qi, W. Dou, A Blockchain-Powered
Crowdsourcing Method With Privacy Preservation in Mobile
Environment. IEEE Transactions on Computational Social Systems (2019) 15. W. Li, X. Liu, J. Liu, P. Chen, S. Wan, X. Cui, On Improving the accuracy with
auto-encoder on conjunctivitis. Applied Soft Computing.81, 105489 (2019)
16. Y. Yin, L. Chen, J. Wan, et al., Location-aware service recommendation with enhanced probabilistic matrix factorization. IEEE Access.6, 62815–62825 (2018)
17. H. Gao, W. Huang, X. Yang, Y. Duan, Y. Yin, Toward service selection for workflow reconfiguration: an interface-based computing solution. Future Generation Computer Systems.87, 298–311 (2018)
18. S. Ding, S. Qu, Y. Xi, S. Wan, A long video caption generation algorithm for big video data retrieval. Future Generation Computer Systems.93, 583–595 (2019)
19. Y. Chen, S. Deng, H. Ma, J. Yin, Deploying data-intensive applications with multiple services components on edge. Mobile Networks and
Applications, 1–16 (2019)
20. S. Deng, L. Huang, G. Xu, X. Wu, Z. Wu, On deep learning for trust-aware recommendations in social networks. IEEE transactions on neural networks and learning systems.28(5), 1164–1177 (2017)
21. S. Wan, Y. Zhang, J. Chen, On the construction of data aggregation tree with maximizing lifetime in large-scale wireless sensor networks. IEEE Sensors Journal.16(20), 7433–7440 (2016)
22. H. Gao, S. Mao, W. Huang, X. Yang, Applying probabilistic model checking to financial production risk evaluation and control: a case study of Alibaba’s Yu’e Bao. IEEE Transactions on Computational Social Systems. 99, 1–11 (2018)
23. Z. Gao, H.-Z. Xuan, H. Zhang, S. Wan, K.-K. R. Choo, Adaptive fusion and category-level dictionary learning model for multi-view human action recognition. IEEE Internet of Things Journal (2019)
24. T. Wang, G. Zhang, M. Z. A. Bhuiyan, A. Liu, W. Jia, M. Xie, A novel trust mechanism based on fog computing in sensor–cloud system. Future Generation Computer Systems (2018)
25. Y. Yin, L. Chen, Y. Xu, J. Wan, H. Zhang, Z. Mai, QoS Prediction for service recommendation with deep feature learning in edge computing environment. Mobile Networks and Applications, 1–11 (2019) 26. X. Xu, Y. Xue, L. Qi, Y. Yuan, X. Zhang, T. Umer, S. Wan, An edge
computing-enabled computation offloading method with privacy preservation for internet of connected vehicles. Future Generation Computer Systems.96, 89–100 (2019)
27. T. Wang, G. Zhang, A. Liu, M. Z. A. Bhuiyan, Q. Jin, A secure iot service architecture with an efficient balance dynamics based on cloud and edge computing. IEEE Internet of Things Journal (2018)
28. L. Qi, X. Zhang, W. Dou, Q. Ni, A distributed locality-sensitive hashing-based approach for cloud service recommendation from multi-source data. IEEE Journal on Selected Areas in Communications. 35(11), 2616–2624 (2017)
29. Y. Xu, L. Qi, W. Dou, J. Yu, Privacy-preserving and scalable service recommendation based on simhash in a distributed cloud environment. Complexity.2017(2017)
30. L. Qi, R. Wang, C. Hu, S. Li, Q. He, X. Xu, Time-aware distributed service recommendation with privacy-preservation. Information Sciences.480, 354–364 (2019)
32. L. Qi, Y. Chen, Y. Yuan, S. Fu, X. Zhang, X. Xu, A qos-aware virtual machine scheduling method for energy conservation in cloudbased
cyber-physical systems. World Wide Web, 1–23 (2019)
33. X. He, Q. Ai, C. Qiu, et al., A big data architecture design for smart grids based on random matrix theory. IEEE Transactions on Smart Grid.8(2), 674–686 (2015)
34. X. Xu, X. He, Q. Ai, et al., A correlation analysis method for power systems based on random matrix theory. IEEE Transactions on Smart Grid.PP(99), 1–10 (2015)
35. F. Yang, X. He, Qiu R.C., et al., A data-driven approach to multi-event analytics in large-scale power systems Using Factor Model (2017).https:// www.researchgate.net/publication/322076207. arXiv e-prints, p. arXiv:1712.08871
36. L. Wei, Z. Dongxia, W. Xinying, Power system transient stability analysis based on random matrix theory. Proceedings of the CSEE.36(18), 4854–4864 (2016)
37. W. Xi, Z. Dongxia, L. Daowei, et al., A method for power system steady stability situation assessment based on random matrix theory. Proceedings of the CSEE.36(20), 5414–5421 (2016)
38. C. Weibiao, C. Yiping, Y. Wei, W. Jinyu, A random matrix theory-based approach to fault time determination and fault area location. Proceedings of the CSEE.38(06), 1655–1664+1902 (2018)
39. Z. Guan, G. Si, X. Zhang, L. Wu, N. Guizani, X. Du, Y. Ma, Privacy-preserving and efficient aggregation based on blockchain for power grid
communications in smart communities. IEEE Communications Magazine. 56(7), 82–88 (2018)
40. F. U. Din, A. Ahmad, H. Ullah, A. Khan, T. Umer, S. Wan, Efficient sizing and placement of distributed generators in cyber-Physical power systems. Journal of Systems Architecture.97, 197–207 (2019)
41. K. W. Wang, C. Y. Chung, C. T. Tse, et al., Multimachine eigenvalue sensitivities of power system parameters. IEEE Transactions on Power Systems.15(2), 741–747 (2002)
42. H. C. Shu, M. M. Zhu, W. Z. Huang, Faulty line selection based on time-frequency characteristics of transient zero-sequence current. Electric Power Automation Equipment.33(9), 1–6 (2013)
Publisher’s Note