Integrating Distributional and Lexical Information for Semantic
Classification of Words using MRMF
Rosa Tsegaye Aga
Hochschule Hannover Hanover, Germany
Lucas Drumond
Universität Hildesheim Hildesheim, Germany [email protected]
Christian Wartena
Hochschule Hannover Hanover, Germany
Lars Schmidt-Thieme
Universität Hildesheim Hildesheim, Germany
Abstract
Semantic classification of words using distributional features is usually based on the semantic similarity of words. We show on two different datasets that a trained classifier using the distribu-tional features directly gives better results. We use Support Vector Machines (SVM) and Multi-relational Matrix Factorization (MRMF) to train classifiers. Both give similar results. However, MRMF, that was not used for semantic classification with distributional features before, can eas-ily be extended with more matrices containing more information from different sources on the same problem. We demonstrate the effectiveness of the novel approach by including informa-tion from WordNet. Thus we show, that MRMF provides an interesting approach for building semantic classifiers that (1) gives better results than unsupervised approaches based on vector similarity, (2) gives similar results as other supervised methods and (3) can naturally be extended with other sources of information in order to improve the results.
1 Introduction
In this paper we consider the task of classifying words into a large number of semantic categories. For this, we use two different data sets: 1. A dataset which is used in literature (Bullinaria and Levy, 2007) - to enable compare our results with results reported in the literature, 2. A larger dataset that is derived from a large thesaurus. The second dataset comes close to practical applications for semantic word classification. Organizations maintaining thesauri usually try to keep their thesaurus up to date and frequently add new terminology to the thesaurus. For each new term, they have to decide at what point it has to be inserted. Automatic semantic classification supports exactly this task. However, the classifier should be able to choose from hundreds or even thousands of semantic classes, not just from a dozen.
For semantic word classification, it is a common approach to represent words by context features. Usually, co-occurrence statistics are used as context features. According to the distributional hypothesis, words with similar context features have a similar meaning. Thus, we can use any distance measure between the feature vectors as a measure of semantic similarity. These distances are now commonly used in a nearest neighbor or a nearest centroid (or nearest prototype) classifier. Recently, distributional features have also been used directly to train classifiers that classify pairs of words as being synonymous or not (Hagiwara, 2008; Weeds et al., 2014; Aga et al., 2016). In these approaches, first a vector repre-sentation for a pair is build, that is used by a machine learning algorithm. In the following we will use the distributional features directly to categorize the words into a large number of categories. We will also see that the supervised methods outperform the unsupervised ones.
For the given task, we obtain similar results with SVM and MRMF. However, MRMF enables easy integration of different sources which improves the results furthermore. The MRMF does not just aggre-gate results from different sources, but is also able to model the interaction between the different types of information. As a second source of information we use hypernym information from WordNet. Since, we
This work is licenced under a Creative Commons Attribution 4.0 International Licence. Licence details: http: //creativecommons.org/licenses/by/4.0/
do not have a mapping from wordnet hypernym classes to our target classes, we have a second learning task. In the first place we show that classification using WordNet is possible, but gives worse results than classification based on distributional features. In the second place, MRMF using both distributional features and WordNet Hypernyms outperforms all other methods. For the SC53 data set that introduced by Bullinaria and Levy (2007) using the Montague and Battig (Battig and Montague, 1969) semantic classes, we get an accuracy of0,93. The best result found in literature for the complete data set is 0,86 (Bullinaria and Levy, 2012).
The rest of the paper is organized as follows. Section 2 briefly reviews the related work. Section 3 ex-plains the methodology of the work in detail. Section 4 exex-plains the multi-relational matrix factorization method in detail. Section 5 and Section 6 explain briefly the evaluation of the models and explain the result, respectively. Finally, Section 7 concludes the paper.
2 Related Work
In distributional semantics, words are represented by context features, usually co-occurrence numbers between words or the pointwise mutual information between each word and each context word. It turns out that words with a similar meaning have similar vectors of context features; In other words, semanti-cally similar words occur in similar contexts (Rubenstein and Goodenough, 1965; Saif and Hirst, 2012; Bullinaria and Levy, 2007; Turney and Pantel, 2010; Bullinaria and Levy, 2012; Kiela and Clark, 2014). Classification of words into different semantic categories was studied by Pekar et al. (2004), who use a k-Nearest Neighbor classifier and investigate different feature weighting schemes and distance measures; Fan and Friedman (2007) study the classification of medical terms using a nearest centroid classifier; Both Bullinaria and Levy (2012) and Keith et al. (2015) use a nearest centroid classifier for the same data set that is also included in our study. However, Keith et al. report only the result for one arbitrary split into test and training set. Thus, their results cannot be compared directly to our and also Bullinaria and Levy results.
Matrix factorization has been used in distributional semantics, e.g. by Giesbrecht (2010) and Van de Cruys et al. (2013) in order to reduce the size of the feature space, but not directly for predicting missing values or for classification. We are not aware of any work using matrix factorization for classification of words into semantic categories.
The integration of distributed and lexical information is an obvious way to go and was also used in a number of studies. Usually a (weighted) average of similarities based on different types of information is used. E.g. Finkelstein et al. (2001) used distributional features (occurrence frequencies of words in vari-ous domains) and the cosine of these feature vectors as a distributional similarity measure. This measure is combined linearly with a WordNet based similarity measure. Yih and Qazvinian (2012) use different similarity methods, like corpus based and web based distributional similarity for binary classification tasks (synonymous or not-synonymous). They also used WordNet similarity. For this, they represent a word as a vector in a Synset-space. The vector, thus indicates, to which synsets a word belongs. They finally aggregated the various similarities by taking the average cosine similarity. Camacho-Collados et al. (2015) combined distributional similarity of words based on their occurrence in Wikipedia with a WordNet based similarity measure. They also combined the similarities from both sources by computing the average. Pennacchiotti et al. (2008) also investigate the contribution of distributional models and their combination with Wordnet. They use the a simple back-off model to combine distributional similarity and Wordnet based similarity.
3 Methodology
3.1 Data Description
Our first dataset is the same with the one used by Bullinaria and Levy (2007). This data set uses 53 of the 56 basic semantic categories introduced by Battig and Montague (1969). In total, the dataset contains 530 words which have been taken from 53 semantic categories. For each category there are 10 typical words. We will refer to this dataset as SC53.
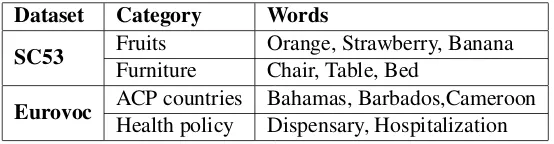
We have compiled a second, similar but much larger dataset from the Eurovoc Thesaurus (Office for Official Publications of the European Communities, 1995). Eurovoc is a multilingual thesaurus developed by the European Commissions Publications Office as a controlled vocabulary for the manual indexation of documents. The Eurovoc thesaurus is divided into 127 micro-thesauri. From each of these micro-thesauri we took the top-level concepts, 528 in total, as semantic categories. For each category we collected all narrower concepts and considered their preferred and alternative labels as terms for that category. We then removed all terms that belong to more than one category or that consist of more than two words. Finally, we removed all categories for which less than 10 terms were found. Now 190 categories with a total of 2386 terms are left. After further cleaning the dataset by removing the words that have a very high or low frequencies in UkWaK, which is a corpus that has been used to construct word representation vectors, 1447 words with 95 semantic categories are left, each containing 10 to 44 terms. We call this datasetEurovoc. Table 1 shows some examples from both datasets.
Dataset Category Words
SC53 FruitsFurniture Orange, Strawberry, BananaChair, Table, Bed
[image:3.595.161.438.309.381.2]Eurovoc ACP countries Bahamas, Barbados,CameroonHealth policy Dispensary, Hospitalization
Table 1:Some example classifications from the used datasets
3.2 Feature Construction
We use two different representations for each word. The first one is a distributional representation based on word co-occurrences.The second one uses WordNet hypernyms. The two types of representation will be explained in the following subsections.
3.2.1 Distributional Representation
We construct vectors of co-occurring words to represent each word and use them as an input for all our experiments. For building the context vectors, we used UkWaC English corpus.
There are a number of choices that have to be made when building the context vectors for each word. In the following we will use the choices that turned out to yield the best results in a number of different tasks in recent studies by Bullinaria and Levy (2007; 2012) and Kiela and Clark (2014).
After some preliminary experiments we found that including all words in the frequency range from 4·103to1·106in the UkWaC Corpus as context feature is a good compromise between optimal results and acceptable storage and computing efforts. Each word is now represented by a vector of 17 400 features. All experiments have been done using these distributional features.
Next we have to determine the size of the window for co-occurrence. If the training corpus is large enough all studies show that smaller windows yield better results. We first remove all stop words and then use a window size of two words on the stopped text while respecting sentence boundaries. Syntactic relations are not used to determine the context of a word.
We use positive pointwise mutual information (PPMI) as a degree of co-occurrence, since it was shown to give better results than raw co-occurrence probabilities in a number of different studies (see e.g. (Bullinaria and Levy, 2007; Bullinaria and Levy, 2012)). For a context wordcand a (target) wordt
the PPMI is defined as
ppmi(c, t) = max
logp(c|t)
p(c) ,0
3.2.2 WordNet Categories Representation
In order to classify words into semantic categories, we could directly use the semantic categories of the words from WordNet. However, we do not know the relation between the WordNet categories and the target categories. Moreover, our data set contains lots of terms that are not found in WordNet. Thus, we represent each word by the set of all its WordNet hypernyms, i.e. the transitive closure of the hypernym relation applied to each possible meaning of the word. E.g. the wordMansionis repre-sented by the set{artifact.n.01, building.n.01, dwelling.n.01, entity.n.01, house.n.01, housing.n.01, loca-tion.n.01, mansion.n.02, object.n.01, physical_entity.n.01, region.n.01, sign_of_the_zodiac.n.01, struc-ture.n.01, whole.n.02b}. Finally, each word is represented as a boolean vector in the space of all possible hypernyms.
For the SC53 dataset we could construct WordNet vectors for 520 out of 530 words; in the Eurovoc dataset, 1198 out of 1447 terms were found in WordNet. The average number of hypernyms for each term found in WordNet was 66. The total number of distinct hypernyms for all words is 2896 for the SC53 and 4938 for the Eurovoc data.
3.3 Classification Methods
Bullinaria and Levy (2012) use a nearest centroid classifier for classifying words based on distributional features. In this approach, for every semantic category a feature vector is created by averaging the feature values of all words in the training set belonging to that category. Now the cosine between the feature vector of the word and each centroid vector is computed and the word is assigned to the class with the closest center.
The second classification method is a support vector machine (SVM). We used linear SVM from the liblinear package (Fan et al., 2008) to learn a model and classify words, that words represented by feature vector, to their category. Liblinear is efficient for training, large-scale problems (Fan et al., 2008). The hyper-parameters of the models have been tuned using a grid search from LIBSVM. To find the best C parameter value, we tested the numbers in between 0 and 20 in step 0.05.
The third and main classification method that is used in this paper is multi-relational matrix factoriza-tion. We will explain MRMF in detail in the following secfactoriza-tion.
If we want to use both lexical and distributional information, we can use MRMF as we will show in the following section. An obvious alternative is an ensemble classifier, that uses the results of the classifiers using only one type of information. Thus we also trained an SVM on the results of the SVMs using WordNet and distributional features. Since we have only boolean results from the SVM (a word is assigned to a category or not) we use also a logistic regression classifier. Logistic regression gives probabilities for each class and selects the class with the highest probability. The ensemble classifier now can use the probabilities for each class. Though we expect logistic regression to be inferior to SVM, it might have an advantage to use its class probabilities in an ensemble classifier.
4 Multi-Relational Matrix Factorization
MRMF was introduced by Lippert et al. (2008) for relation prediction in multi-relational domains using matrix factorization. Weighted MRMF as we have used here, was defined by Drumond et al. (2014) to model the different degrees of influence various relations involved in a domain might have.
For MRMF we have three matrices that can be used: the matrix of words and semantic classes, the matrix of words and context features and the matrix of words and WordNet features. The task for MRMF now is to predict values for new words in the first matrix using one or both of the other matrices.
4.1 MRMF on two Matrices
For the problem to classify words that are represented by vectors of WordNet categories and context words, we have followed the same procedure.
Let’s assume the following problem: We have
≈
×
X
U
V
Tw ords context words w ords lat. feat. lat. feat. context words
≈
×
Y
U
C
T [image:5.595.310.501.65.267.2]w ords categories w ords lat. feat. lat. feat. categories
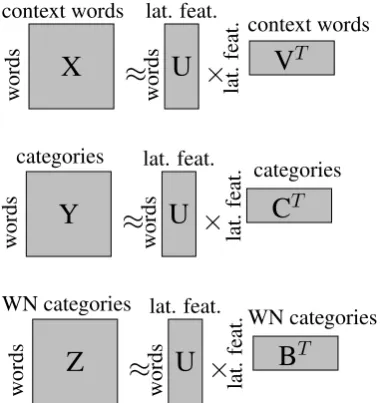
Figure 1:Visual overview of the matrix decomposition used for semantic categorization on two matrices
≈
×
X
U
V
Tw ords context words w ords lat. feat. lat. feat. context words
≈
×
Y
U
C
Tw ords categories w ords lat. feat. lat. feat. categories
≈
×
Z
U
B
Tw ords WN categories w ords lat. feat. lat. feat. WN categories
Figure 2:Visual overview of the matrix decomposition used for semantic categorization on three matrices.
Algorithm 1Block coordinate descent optimization algorithm for L2-MRMF
1: procedureMRMF-COORDINATEDESCENT
input:X, Y, k,weight constantsαX, αY,regularization constantsλU,λV,λC
2: U ∼ N(0, σI) 3: V ∼ N(0, σI) 4: C ∼ N(0, σI)
5: repeat
6: U ←(αXXV +αYY C) αXVTV +αYCTC−λUI−1 7: V ← αXUTU −λVI−1αXUTXT
8: C← αYUTU−λCI−1αYUTYT
9: untilconvergence 10: returnU, V, C 11: end procedure
• nfeatures for each word (e.g. positive point wise mutual information (PPMI) values based on the co-occurrence data);
• csemantic categories;
The features are represented by a matrixX ∈Rm×nwhere each row ofXrepresents the feature vector
of a word. We use a second matrix,Y ∈ {0,1}m×cwith the relation between words and categories.Y i,j
has value1if the wordibelongs to the categorycand0otherwise.
The idea of matrix factorization is thatXcan be approximated by the product of two smaller matrices
U andV, whereU is a matrix of words and latent features andV is a matrix of context features and the same latent features. The numberkof latent features can be chosen freely withk << n. The second matrix,Y, can be decomposed in the same way. The idea of MRMF is that both decompositions use the same factor matrixU of words and latent features. Thus the latent features now form the link between the context features and the categories. The situation is visualized in Figure 1. The matricesU,V andC
[image:5.595.76.258.65.195.2]More formally,XandY can be factorized as:
X≈UVT (2)
Y ≈UCT (3)
for some U ∈ Rm×k, V ∈ Rn×k and C ∈ Rc×k. The problem is now to minimize the following
objective with respect to L2 loss function
arg min
U,V,B,C αX
1
2||X−UVT||2F +αY 1
2||Y −UCT||2F (4)
+λ2U||U||2
F +λ2V ||V||F2 +λ2C||C||2F
L2 loss function is basically minimizing the sum of the square of the differences between the target value and the estimated values.
4.1.1 Learning Algorithm and Predictions
One of the most often used optimization algorithms is block coordinate descent. Coordinate descent op-timizes the objective function through a sequence of one-dimensional optimizations. Coordinate descent is based on the idea that the minimization of a multi-variable function
FirstU,V andCare initialized with random values. Then the minimization problem is solved for each one of the matrices individually. This is repeated until convergence. The coordinates descent algorithm for the objective with respect to L2 loss function in Equation 4 is given in Algorithm 1
Now, for a set of new wordsXtest, Equation 5 can predict their semantic categories.
Ytest≈UtestCT (5)
However,Utestis unknown. The standard way to estimateUtestis through a fold-in:
Utest= arg min ˆ
U ||X
test−UVˆ T||2
F (6)
Utest=XtestV(VTV)−1 (7)
4.1.2 MRMF on three Matrices
The MRMF method allows to integrate elegantly many different sources of information. In our exper-iment we have integrated the lexical and distributional information by extending the MRMF method described in section 4.1.
Matrices XandY are the same matrices that we have seen in section 4.1. The newly added matrix
Z has the lexical information which has the hypernym information from WordNet. X,Y andZ can be factorized as follows:
X≈UVT (8)
Y ≈UCT (9)
Z ≈UBT (10)
The overall decomposition of the three matrices for MRMF method is visualized in Figure 2. Besides adding theZ matrix information in the objective function and in the coordinate decent algorithm, we have modified Equation 7 forUtestand add the third matrix information as follows:
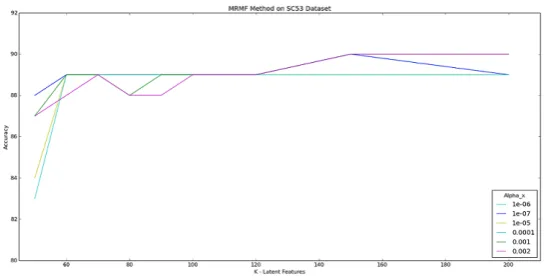
Figure 3:Accuracy of MRMF with differentkandαxparameter values on the SC53 dataset
Figure 4:Accuracy of MRMF with differentkandαxparameter values on the Eurovoc dataset
4.2 Parameter Selection
For MRMF, a combination of weight constant, latent features and regularization parameters with a wide range of values was tested to find the best parameter setting. For SC53 dataset, the weight constantαx
andαzrange is in between 1
#_SC53_instances and1·10−7, and in between #_Eurovoc1_instancesand1·10−7
for the Eurovoc dataset. The weight constantαy is set to1; BecauseY is the matrix that we are building
the model for, andYtest is the matrix we want to predict. The regularization constants λu, λv andλb
have used the same range of value which is in between1·10−17and1·10−22. For the latent featuresk, we considered a range between 50 and 200.
Figure 3 and Figure 4 show the parametersαxandkperformance for the SC53 and Eurovoc datasets,
respectively. As both figures show, thekparameter gives high accuracy on value 200 and goes flat after that for both datasets on MRMF_2 method, and also on method MRMF_3. In method MRMF_2, thek
parameter has performed better with theαxparameter value around0.002for SC53 and between0.0003
and0.0001for the Eurovoc dataset. MRMF_3 gives optimal results whenαxis 0.001 andαz is 0.0004
for SC53 dataset and whenαxis1·10−6andαzis1·10−7for the Eurovoc derived data.
5 Evaluation
Methods Eurovoc Stand. Err. SC53 Stand. Err.
Nearest Centroid (reported) - - 0,86 -Nearest Centroid (reproduced) 0,58 0,14 0,86 0,04
WN LR 0,45 0,17 0,74 0,11
SVM 0,50 0,16 0,73 0,10
MRMF_2M 0,48 0,17 0,79 0,07
DF LR 0,56 0,16 0,90 0,04
SVM 0,69 0,10 0,90 0,03
MRMF_2M 0,69 0,10 0,90 0,03
DF + WN MRMF_3M 0,71 0,10 0,93 0,02
2xLR + SVM - - 0,89
-2xSVM+ SVM - - 0,92
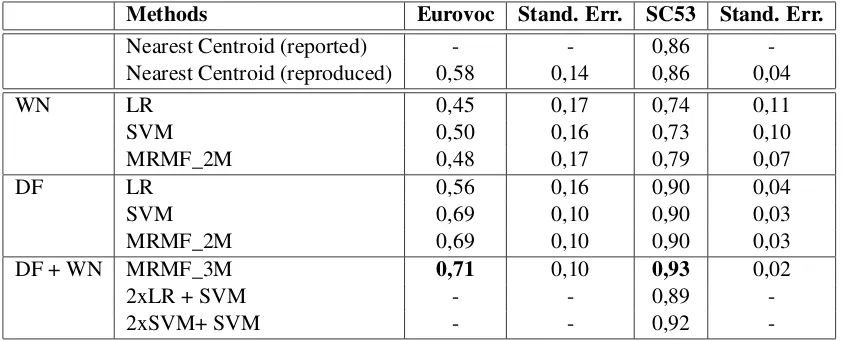
-Table 2:Accuracy of classification on Eurovoc and SC53 datasets. Results are averages from 10-fold cross validation.
6 Result
Table 2, the result table, summarizes the performance of the methods on each dataset with their standard error (Stand. Err.). Bullinaria and Levy (2007; Bullinaria and Levy (2012) study different design and parameter choices for distributional similarity. The best accuracy, that they reached for the SC53 dataset (using a nearest centroid classifier), was0,86. We could reproduce this result using roughly the same choices and parameter settings that were given by Bullinaria and Levy. Applying the same method to the Eurovoc dataset gives an accuracy of 0,58. We used the hypernym features (WN) only in the supervised and hybrid settings.
For both datasets, we see that both SVM and MRMF are superior to the nearest centroid classifier. We see no big differences between the SVM and MRMF. As expected the results from logistic regression (LR) stay a bit behind those results.
Finally, we see that the integration of lexical and distributional information using MRMF clearly improves the result for both data sets. The ensemble methods can also improve the results, but stay behind the result of MRMF_3M. Since the logistic regression results for the Eurovoc data stay much behind the SVM and MRMF results, we did not test the ensemble based on those classifiers.
For the SC53 dataset, both the supervised classifiers using only distributional features and the classifier using a combination of distributional (DF) and lexical (WN) features outperform the best result reported up to now. Keith et al. (2015) report an accuracy of0,96when reproducing the experiment of Bullinaria and Levy, but, as mentioned before, this result is not comparable to ours, since they used only a part of the data for evaluation.
If we look at the word classes predicted by the MRMF for the SC53 data, using both sources of information, we still have a small number of real errors. E.g. the word mixer is classified as a non-alcoholic beverage andnunas a relative. Most errors, however, are not real errors, like the wordfoot
that is classified as a body part by MRMF and is a unit of distance in the dataset. Aknifeis classified as a weapon instead of a kitchen utensil;shoesas a type of footwear instead of clothing; and abassas a musical instrument instead of a fish.
Given the type of errors that is made, we can conclude that to the SC53 data set we are close to the highest possible accuracy that can be reached. The Eurovoc dataset clearly is much harder and has still room for improvement.
7 Conclusion
[image:8.595.89.513.62.232.2]In order to make a classification task that is closer to real applications, we compiled a new data set with more semantic categories. This data set is clearly much harder, but experiments on this dataset confirm all conclusions from the experiment on the smaller dataset.
In order to improve the results we finally investigated the possibility to include information from Word-Net. While an ensemble classifier was not very successful in combining the two sources of information, MRMF was able to integrate the two types of information and improve the results substantially.
Since we are close to the optimal result for the SC53 dataset, we will concentrate on future work on datasets with a larger number of classes. In addition, we will try to find more sources of information that successfully can be integrated in order to improve the accuracy and to explore the possibilities of MRMF.
References
Rosa Tsegaye Aga, Christian Wartena, Lucas Drumond, and Lars Schmidt-Thieme. 2016. Learning thesaurus relations from distributional features. In Nicoletta Calzolari (Conference Chair), Khalid Choukri, Thierry De-clerck, Sara Goggi, Marko Grobelnik, Bente Maegaard, Joseph Mariani, Helene Mazo, Asuncion Moreno, Jan Odijk, and Stelios Piperidis, editors,Proceedings of the Tenth International Conference on Language Resources and Evaluation (LREC 2016), Paris, France, may. European Language Resources Association (ELRA).
W.F. Battig and W.E. Montague. 1969. Category norms for verbal items in 56 categories: a replication and extension of the Connecticut category norms. Journal of experimental psychology monograph. American Psy-chological Association.
John A. Bullinaria and Joseph P. Levy. 2007. Extracting semantic representations from word co-occurrence statistics: A computational study. Behaviour Research Methods, 39(3):510–526.
John A. Bullinaria and Joseph P. Levy. 2012. Extracting Semantic Representations from Word Co-occurrence Statistics: Stop-lists, Stemming and SVD. Behaviour Research Methods, 44(3):890–907.
José Camacho-Collados, Mohammad Taher Pilehvar, and Roberto Navigli. 2015. Nasari: a novel approach to a semantically-aware representation of items. InNAACL.
Lucas Rego Drumond, Ernesto Diaz-Aviles, Lars Schmidt-Thieme, and Wolfgang Nejdl. 2014. Optimizing multi-relational factorization models for multiple target relations. In Proceedings of the 23rd ACM International Conference on Conference on Information and Knowledge Management, CIKM ’14, pages 191–200, New York, NY, USA. ACM.
J.-W. Fan and C. Friedman. 2007. Semantic Classification of Biomedical Concepts Using Distributional Similar-ity.Journal of the American Medical Informatics Association, 14(4):467–477.
Rong-En Fan, Kai-Wei Chang, Cho-Jui Hsieh, Xiang-Rui Wang, and Chih-Jen Lin. 2008. Liblinear: A library for large linear classification. J. Mach. Learn. Res., 9:1871–1874, June.
Lev Finkelstein, Evgeniy Gabrilovich, Yossi Matias, Ehud Rivlin, Zach Solan, Gadi Wolfman, and Eytan Ruppin. 2001. Placing search in context: the concept revisited. InProceedings of the Tenth International World Wide Web Conference, WWW 10, Hong Kong, China, May 1-5, 2001, pages 406–414.
Eugenie Giesbrecht. 2010. Towards a Matrix-based Distributional Model of meaning. In Proceedings of the NAACL HLT 2010 Student Research Workshop, pages 23–28, Los Angeles, California. ACL.
Masato Hagiwara. 2008. A Supervised Learning Approach to Automatic Synonym Identification Based on Dis-tributional Features for Computational Linguistics, June 15-20, 2008, Columbus, Ohio, USA, Student Research Workshop. InACL 2008, Proceedings of the 46th Annual Meeting of the Association for Computational Lin-guistics, pages 1–6.
Jeff Keith, Chris Westbury, and James Goldman. 2015. Performance impact of stop lists and morphological decomposition on word–word corpus-based semantic space models. Behavior Research Methods, 47(3):666– 684.
Christoph Lippert, Stefan Hagen Weber, Yi Huang, Volker Tresp, Matthias Schubert, and Hans-Peter Kriegel. 2008. Relation-Prediction in Multi-Relational Domains using Matrix-Factorization. InNIPS 2008 Workshop: Structured Input - Structured Output.
Office for Official Publications of the European Communities. 1995. Thesaurus eurovoc - volume 2: Subject-oriented version.
Viktor Pekar, Michael Krkoska, and Steffen Staab. 2004. Feature weighting for co-occurrence-based classification of words. InProceedings of the 20th international conference on Computational Linguistics, pages 799 – 806. Association for Computational Linguistics.
Marco Pennacchiotti, Diego De Cao, Roberto Basili, Danilo Croce, and Michael Roth. 2008. Automatic induc-tion of framenet lexical units. InProceedings of the Conference on Empirical Methods in Natural Language Processing, EMNLP ’08, pages 457–465, Stroudsburg, PA, USA. Association for Computational Linguistics. Herbert Rubenstein and John B. Goodenough. 1965. Contextual Correlates of Synonymy. Commun. ACM,
8(10):627–633.
Mohammad Saif and Graeme Hirst. 2012. Distributional Measures of Semantic Distance: A Survey.
Peter D. Turney and Patrick Pantel. 2010. From Frequency to Meaning: Vector Space Models of Semantics.
Journal of Artificial Intelligence Research, 37:141–188.
Tim Van de Cruys, Thierry Poibeau, and Anna Korhonen. 2013. A tensor-based factorization model of seman-tic compositionality. InProceedings of the Conference of the North American Chapter of the Association of Computational Linguistics (HTL-NAACL), pages 1142–1151.
Julie Weeds, Daoud Clarke, Jeremy Reffin, David Weir, and Bill Keller. 2014. Learning to distinguish hypernyms and co-hyponyms. InProceedings of COLING 2014, the 25th International Conference on Computational Lin-guistics: Technical Papers, pages 2249–2259, Dublin, Ireland, August. Dublin City University and Association for Computational Linguistics.