Graph-based Multi-tweet Summarization Using Social
Signals
LIU X iaoHua
1,2LI Y iTong
3W EI FuRu
2ZHOU M ing
2(1) School of Computer Science and Technology, Harbin Institute of Technology, Harbin, 150001, China
(2) Microsoft Research Asia, Beijing, 100190, China
(3) School of Electronic and Information Engineering, Beihang University, Beijing, 100191, China
{xiaoliu,v-yitli,fuwei,mingzhou}@microsoft.com
Abstract
We study the multi-tweet summarization task, which aims to find representative tweets from a given set of tweets. Multi-tweet summarization allows people to quickly grasp the essential meaning of a large number of tweets. It can also be used as a pre-processing component for information extraction tasks on tweets. The challenge of this task lies in computing a tweet’s salience score with little information in a single tweet. We propose a graph-based multi-tweet summarization system that incorporates social network features, which make up for the information shortage in a tweet. Another distinguished feature of our system is that tweet readability and user diversity are considered. We evaluate our system on a manually annotated dataset, and show that our system outperforms the state-of-the-art baseline. We further evaluate our method in a real scenario of summarization of Twitter search results and demonstrate its effectiveness.
Title and Abstract in another language (Chinese)
基于图模型和社会关系特征的推特消息摘要方法
本文考察多推特消息摘要任务。其目的是帮助用户快速了解大量推特消息的基本意思,或 在信息抽取前对推特消息做预处理。 该任务的主要挑战是:单条推特消息往往不能提供足 够的信息来计算它的显著度。本文提出基于图模型的方法,考虑社会关系网相关的特征、 可读性及用户的多样性来克服单条推特消息的不足。 在人工标注的数据集以及推特搜索 上,该方法均展示了其有效性。
Keywords:
Graph, Summarization, Social signals, Tweets.1 Introduction
Twitter1is a microblogging and social networking service with a huge number of users and is continuously growing at a tremendous rate. Tweets, short messages shared through Twitter with less than 140 characters, have become an important repository of real-time information. However, it is often inefficient for people to consume a large number of tweets, owing to the noise prone nature of tweets2. We propose the task of multi-tweet summarization to overcome this obstacle: eliminating redundancy and noise while keeping the essential information for a given set of tweets. As an illustrative example, consider the following tweets, returned from Twitter search related to the query “obama":
• “@morrowchris: Christmas card from the Obama’s :) http://pic.twitter.com/F3VU52io" thts special.
• Christmas card from the Obama’s :) http://pic.twitter.com/7xqBQdBV
• RT @liberalease: RT if you like President Obama better than ALL OF GOP COM-BINED. / That was easy :)
• Obama did it! The war is OFFICIALLY OVER! #WelcomeHomeTroops! :)
• obama really brought the troops home :)
The first and the second tweet are almost the same; the third tweet is a private conversation, thus not meaningful for the general audience; and the last two talk about similar things. After summarization, the expected outputs are as follows, which keep the main information with noises removed.
• Christmas card from the Obama’s :) http://pic.twitter.com/7xqBQdBV
• obama really brought the troops home :)
We advocate that multi-tweet summarization can play a critical role for many tweet related studies, which have attracted increasing research interests in recent days, such as named entity recognition (NER) and sentiment analysis (SA) for tweets. One common issue of these tasks is the scalability challenge, which means they are required to process a huge number of tweets each day. Summarization system is then an ideal pre-processing compo-nent in the sense that it helps to reduce the number of tweets for processing without much lose of information.
Multi-document summarization has been well studied, and a couple of systems have been developed. We test LexRank (Erkan and Radev, 2004), a state-of-the-art summarization system and find a sharp drop of ROUGE-2, from 0.3894 on news to 0.2871 on tweets. This can be largely attributed to the short and noise prone nature of tweets, which causes a single tweet to be insufficient to provide reliable information to compute its salience score. We develop a graph-based summarization system that aggregates social signals, i.e., re-tweeted times and follower numbers to handle this challenge. More specifically, the translation probability from one tweet to the other depends on both the similarity between the two tweets and the social network features associated with the second tweet. This largely differentiates our system from existing studies, such as the work of Sharifi et al. (2010), which uses only tweet-level content features (e.g., keywords) to select representa-tive sentences.
1http://www.twitter.com
Besides utilizing social signals, our system has two additional features. Firstly, the read-ability feature is introduced to the graph model to reduce the chance of tweets hard to read to appear in the summarization. Several factors are considered while computing a tweet’s readability, including: 1) The number of out-of-vocabulary (OOV) words; 2) the number of words; and 3) the number of abnormal symbols, e.g., “!,,),(,*". Secondly, while selecting representative tweets using an alternative of the Maximal Marginal Relevance (MMR) (Goldstein et al., 1999) algorithm, our system penalizes tweets which are selected from a same twitter account, to achieve diversity among users.
We collect 100 sets of tweets, each of which is related to a trending topic. For each set of tweets, we manually select representative tweets as the summarization, form-ing the gold-standard dataset. We show that our system compares favorably to the LexRank (Erkan and Radev, 2004) baseline in terms of ROUGE-1 and ROUGE-2. We also show the positive effects of considering social signals, readability and user diversity, re-spectively. To understand how well our method performs in a real scenario, we apply our system to summarize Twitter search results, and consistently observe an improvement of user’s satisfaction of Twitter search in a serials of user studies. It is worth mentioning that our proposed summarization system can be easily adapted to other social contents that are short and noisy but with rich social evidences, e.g., Facebook updates or short messages shared through Facebook.
Contributions of this work are summarized as follows.
1. We propose a graph-based multi-tweets summarization system that leverages social network features, readability and user diversity for selecting representative tweets. 2. We evaluate our system on a human annotated dataset and show our system
outper-forms the baseline. We conduct extensive user studies and show our system consid-erably improves user’s satisfaction of Twitter search.
The rest of this paper is organized as follows. Section 2 introduces related work. Section 3 defines the task. Section 4 describes the baseline. Section 5 details our method and Section 6 evaluates our method. Section 7 demonstrates the application of the proposed method to the Twitter search. Finally, Section 8 concludes with a discussion of future work.
2 Related Work
Two categories of research are highly related to our work: multi-document summarization and recent studies of tweets.
2.1 Multi-document Summarization
Abstraction and selection are two strategies employed for multi-document summarization. The former involves information fusion (Barzilay et al., 1999; Xie et al., 2008), sentence compression (Knight and Marcu, 2002), and reformulation (Barzilay et al., 2001; Saggion, 2011); while the latter requires computing salience scores of some units (e.g., sentences, paragraphs) and extracting those with highest scores with redundancy removed. News-Blaster3and our method are examples of abstraction and selection based methods, respec-tively. We choose the selection strategy because it is relatively simpler, e.g., not requiring
language generation to produce a grammatical and coherent summary, and better suites the scenario of tweet summarization. Note that our method considers each tweet as the unit for summarization, which often cannot provide reliable information to compute the salience. This is one main difference between our system and the existing studies. Existing selection-based methods can be divided into four categories: cluster based (Hardy et al., 2002), centroid based (Radev, 2004), graph based (Erkan and Radev, 2004; Mani and Bloedorn, 1999), and machine learning based (Neto et al., 2002). Cluster-based methods first separate a document set into several groups, each representing a sub-topic. Then representative sentences are selected from each group, and finally those sen-tences are put together as the summarization of the whole document set. Centroid-based methods compute the center of a document set, and then use the similarity between the sentence and the center as the sentence salience score. Graph-based methods construct a graph, where a vertex denotes a sentence and the weight of an edge represents the similarity between the two sentences connected by the edge. Then, similar to PageR-ank (Page et al., 1998), a Markov Random Walk is performed on the graph to compute the salience score of every sentence. Machine learning based methods model the sum-marization process as a classification problem: Whether or not a sentence should be se-lected as summary sentences. A proper classifier, e.g., a Naive Bayes classifier, is learnt statistically from the training data. There are methods between those categories. For ex-ample, Wan and Yang (2008) consider cluster level information, i.e., the importance of the cluster and the relevance of sentence to the cluster, for computing sentence salience score. Motivated by LexRank (Erkan and Radev, 2004), we adopt graph based methods. Differently, our system incorporates rich social network features and considers readability to compute salience score of every tweet.
Most existing studies focus on formal texts such as news. However, exceptions exist. For instance, Qazvinian and Radev (2010, 2008) study the problem of summarizing a scientific paper. They propose a clustering approach where communities in the citation summary’s lexical network are formed and sentences are extracted from separate clusters. Sharifi et al. (2010) use the Phrase Reinforcement algorithm to generate one-line summary for a collec-tion of tweets related to a topic. Though our method is also designed for tweets, there are several significant differences. Firstly, our method does not assume that the input tweets are about a topic. Secondly, our method selects representative tweets by exploiting social network features, readability and keywords. In contrast, Sharifi et al. (2010) find the most commonly used phrases that encompass the topic phrase.
The maximal marginal relevance (MMR) measure (Goldstein et al., 1999) is widely used in summarization to simultaneously rewards relevant sentences and penalizes redundant ones by considering a linear combination of two similarity measures. We adopt an alter-native implementation of MMR, which greedily selects the next most salient tweet whose similarity to any previously selected tweet is less than a threshold and that the number of tweets from the same account is also below a threshold.
2.2 Research on Tweets
leg-islators, particularly by members of the United States Congress (Golbeck et al., 2010), by city police departments in large U.S. cities (Heverin and Zach, 2010), and by schol-ars (Priem and Costello, 2010); Jansen et al. (2009) report research results investigating microblogging as a form of electronic word-of-mouth for sharing consumer opinions con-cerning brands; Heverin and Zach (2010) give insights into why particular events resonate with the population. All the above studies indicate the critical role of tweets as a dynamic information source.
There is another line of studies aiming to help people to efficiently access tweets. For instance, Finin et al. (2010) annotate named entities in tweets by exploiting Amazon’s Me-chanical Turk service4and CrowdFlower5; Liu et al. (2011) propose to combine a K-Nearest Neighbors (KNN) classifier with a linear Conditional Random Fields (CRF) model under a semi-supervised learning framework to recognize named entities in tweets; Liu et al. (2010) conduct a pilot study of Semantic Role Labeling on tweets; Sankaranarayanan et al. (2009) extract breaking news from tweets to build a news processing system, called Twit-terStand; Duan et al. (2010) give an empirical study on learning to rank of tweets; Weng et al. (2010) propose TwitterRank, an extension of the PageRank algorithm to iden-tify influential twitter accounts; O’Connor et al. (2010) present TweetMotif which groups tweets by frequent significant terms; Inouye and Kalita (2011) compare several tweet sum-marization algorithms that use text features like TFIDF to compute the similarity between any two tweet; Sharifi et al. (2010) exploit the Phrase Reinforcement Algorithm to find the most commonly used phrases that encompass the given topic phrase, based on which salient sentences are selected; and most recently, Efron (2011) offers a comprehensive introduction to the problems encountered by researchers and developers of Information Retrieval (IR) systems in microblog settings. Our work develops this line of research, with its focus on summarizing multiple tweets using a novel summarization system which con-siders social network related information, such as re-tweeted times and follower numbers, and partially addresses some of the research challenges discussed by Efron (2011).
3 Task Description
A tweet is a short text message containing no more than 140 characters. Here is an ex-ample: “mycraftingworld: #Win Microsoft Office 2010 Home and Student *2Winners* #Contest from @office and @momtobedby8 #Giveaway http://bit.ly/bCsLOr ends 11/14", where "mycraftingworld" is the name of the user who published this tweet. Words begin-ning with the “#" character, like “"#Win", “#Contest" and “#Giveaway", are hash tags, usually indicating the topics of the tweet; words starting with “@", like “@office" and “@momtobedby8", represent user names, and “http://bit.ly/bCsLOr" is a shortened link.
Given a collection of tweets, our task is to output a subset of no more thanMrepresentative tweets that best preserve important information in the original set. The number of input tweets varies from hundreds, e.g., for tweets related to a given query or user, to tens of millions, e.g., for tweets in a given time range. Mis a systematic parameter whose value is set according to Formula 1, whereαis set to 0.05 and nis the input size. In this study, we limit our attention to English tweets only, though our method is almost language
independent6.
M=⌈α·n⌉ (1)
An example of tweet summarization is given below. The input collection is:
• Finally got Windows 8 on my laptop as a primary OS. Sort of my way of welcoming
the new holidays :)
• I Just Got Windows 8 . Whoooo ! :)
• · · ·
• Windows 8 Picture Passwords: Smudging Your Finger for Security interesting alter-native...it’s not a replacement :)
• Windows 8 will have picture password sign in http://is.gd/JoXYHx
SupposeM=2, the generated summarization is:
• I Just Got Windows 8 . Whoooo ! :)
• Windows 8 will have picture password sign in http://is.gd/JoXYHx
From this example, it can be seen that selection based multi-tweet summarization allows users to quickly grasp the essential information conveyed in the input tweets, which are prone to noise and rich in redundancy. This is exactly the main motivations of this study.
4 The Baseline
We choose an adapted LexRank as the baseline, considering that LexRank outperforms both centroid-based methods and other systems participating in Document Understanding Conferences (DUC) in most of the cases, and proves quite insensitive to the noise in the data. Note that the one-line summarization system (Sharifi et al., 2010), which requires a given topic and focuses on the selection of key phrases most related to the topic, works on a setting different from ours.
In general, LexRank is a graph-based method for computing relative importance of tex-tual units. Erkan and Radev (2004) use it to compute the sentence importance based on the concept of eigenvector centrality in a graph representation of sentences. They use a connectivity matrix based on intra-sentence cosine similarity as the adjacency matrix of the graph representation of sentences. We adapt LexRank to compute the importance of tweets.
Algorithm 1 shows the framework of the baseline. The input tweets are denoted bytsand the outputted summarization are denoted byret.
We first call the functionreprto represent each tweettinto bag-of-words vector⃗t, with the usual TFIDF weighting schema as defined in Formula 2, wheret f is the occurrence times of the term in the tweet,Nis the total number of the tweets for summarization,d f is the number of tweets that contain that term. To extract words from tweets, some prepro-cessing is conducted. Firstly, stop words are removed. Stop words are mainly from a set of frequently-used words7. We also extract the top 200 most frequent words from about
6For example, to summarize Chinese tweets, the main effort involves an additional pre-processing: to run
Chinese work breaker to get words.
Algorithm 1Framework of the baseline. Require:A collection of tweets:ts.
1: Initialize the set of tweet vectorstsv:tsv=∅.
2: for alltweett∈tsdo
3: Get a feature vector⃗t:⃗t=repr(t).
4: Add⃗ttotsv:tsv=tsv∪ {⃗t}.
5: end for
6: Construct the graph:g r=g raph(tsv).
7: Compute salience scores:sc=scores(g r).
8: Select tweets :ret=select(sc,ts).
9: return ret.
10 million tweets, from which another 54 words are manually selected as stop words. Sec-ondly, tweet metadata (e.g., links, account names and hash tags) is extracted using regular expressions and then normalized. Links and account names are replaced by LINK and AC-COUNT, respectively, while hash tags are treated as common keywords. Finally, a simple dictionary-lookup based normalization procedure is conducted, using a pre-compiled list in-cluding incorrect/correct word pairs, e.g., “loooove"/“love", to correct common ill-formed words.
TFIDF=t f×ln(N
d f) (2)
Then we call the function g raphto construct a graph, denoted byG=<V,E>, where V stands for the set of vertexes andE represents the set of edges. Firstly, a vertex is introduced for each tweet. Secondly, for each tweet pair, if their similarity is non-zero, an unidirectional edge connecting the corresponding vertices is added. The edge weight is defined in Formula 3, whereidenotes theithvertex, corresponding to tweet⃗t
i. We enforce sim(⃗t,⃗t) =0 to avoid self-transition. Following Formula 3, the transition probability from theithvertex to thejthvertex can be defined by Formula 5. It is worth noting thatp
(i,j)is usually not equal top(j,i)because of the different normalization factor in the denominator.
w(i,j) =sim(⃗ti,⃗tj) (3)
sim(⃗ti,⃗tj) = ⃗ti·⃗tj
|⃗ti| · |⃗tj|
(4)
p(i,j) =
w(i,j)
∑
j′w(i,j′)
,if ∑ j′
w(i,j′)̸=0
0,otherwise
(5)
the number of tweets for summarization.
si=λ·∑
j̸=i
sj·p(j,i) + (1−λ)·1/|V| (6)
We can consider the above process as a Markov chain, which takes tweets as states and the transition matrixT is defined in Formula 7, whereEis the identity matrix. SinceT is irreducible, it is guaranteed that the salience scores can be obtained by the principal eigenvector of the transition matrixT.
T=λ·P+ (1−λ)/|V| ·E (7)
For implementation, the initial salience scores of all tweets are set to 1 and the iteration algorithm in Formula 6 is used to compute the new scores. Usually the convergence of the iteration algorithm is achieved when the difference between the scores computed at two successive iterations for any tweet goes below a given thresholdδ.
Finally, we run the functionselect, an alternative implementation of the MMR algorithm, to select at mostMtweets as the summarization. Whether a tweet is selected as a represen-tative depends on two factors: its salience score and its similarity to the already selected tweets. Specifically, a tweet is chosen if it is the candidate with the greatest salience score and its similarity to any selected tweet is below a thresholdε8. No matter whether the most salient candidate is chosen or not, it will be removed from the candidate set. This selection process repeats untilMtweets are chosen or the candidate set is empty. Details are illustrated in Algorithm 2.
Algorithm 2Representative tweet selection. Require: maximum number of tweets allowed:M. Require: Scored tweets:{(⃗t,score)}.
1: Initialize the set of selected tweetssel:sel=∅.
2: Initialize the set of candidatescd:cd={(⃗t,score)}.
3: while|sel|<Mand|cd| ̸=0do
4: Select the most salientt∗:t∗=arg max
t∈cdt.score.
5: Removet∗fromcd:cd=cd− {t∗}.
6: if∀s∈sel,sim(s.⃗t,t∗.⃗t)< ε then
7: Selectt∗:sel=sel∪ {t∗}.
8: end if
9: end while
10:return sel.
5 Our System
The baseline has several limitations. Firstly, only terms are used to compute a tweet’s salience score. Because a tweet is short and often noisy, the computed importance score is often not reliable. For example, consider the following two tweets:
8We treatδandεas systematic parameters, whose value are experimentally determined on the development
•is Obama planning to spend the 17 days in Hawaii? #vacation#
•Obama Christmas shopping for his family, already in Hawaii for vaca
They have similar meanings but low cosine similarity, largely caused by the “vaca" in the second tweet , which is actually an abnormal abbreviation of “vacation" in the first tweet. Secondly, tweets are selected only according to their salience scores, despite how hard they can be understood. It has been observed that in the summarization outputted by the baseline, a significant part of tweets are hard to read, which are short, or noisy, e.g., having many OOV words and grammatically incorrect. As an illustrative example, consider the following two tweets. The first one is short and not meaningful while the second one is informally written with low readability.
•Rodney Hood, folks, Rodney Hood....
•Rodney Hood cold . yeah he going pro in another year or so
Thirdly, because user diversity is ignored, too many tweets from the same Twitter account occur in the summarization.
Our system try to overcome these limitations by: 1) Incorporating social network features, i.e., re-tweeted times and follower numbers to make the salience score more reliable; 2) introducing the readability feature to make the outputted summarization more readable; and 3) considering user diversity, i.e., dropping a tweet if the number of selected tweets from the same Twitter account goes above a threshold.
Accordingly, we make three updates on the framework illustrated in Algorithm 1. First the g raphfunction is modified so that the weight between two tweets is computed according to Formula 8, wherea(j)is defined in Formula 9.a(j)incorporates two kinds of evidences: 1) Social network features, which says a tweet is more important if it has been re-tweeted more times (retw(j)), or it is published by an account with more followers (foll(j)); and 2) Readability ( readability(j)), which says more readable tweets are more favorable. With the updated graph, the same scoring functionscoresis called to assign a salience score for each tweet.
w(i,j) =∑sim(⃗ti,⃗tj)·a(j) j′sim(⃗ti,⃗tj′)·a(j
′
) (8)
a(j) =retw(j)·foll(j)·readability(j) (9)
Secondly, we modify Algorithm 2 to add user diversity into the summarization. We cal-culate the number of different Twitter accounts of the input tweets, denoted byK, then define a thresholdN according to Formula 10, whereβis a systematic parameter with a positive real value. To decide if tweettshould be put into the outputted summarization, we check the number of the selected tweets fromt’s account. If that number is greater thanN, we drop the tweet, otherwise we select it.
N=
¡
β·MK
¤
(10)
check out how many Twitter accounts are following “lxh5147". We estimate how many times a tweet is re-tweeted by analyzing the content of a large collection of reference tweets, which are crawled using Twitter APIs within the same day. For any two tweets, if the first one starts with “RT" followed by the content of the second one, we say the second tweet is re-tweeted by the first one.
Readability is the ease in which text can be read and understood. One widely adopted readability is measured according to the Flesch Formula 11, Where: AS Lis the average sentence length (number of words divided by number of sentences) andASWis the average word length in syllables (number of syllables divided by number of words).
206.835−(1.015×AS L)−(84.6×ASW) (11)
We enhance this formula by considering two additional factors: 1) The average number of OOV words, i.e., the number of OOV words divided by the total number of words, denoted byAOW; and 2) the average number of abnormal symbols, i.e., the number of abnormal symbols divided by the total number of words, denoted byAAS. We compile a dictionary of 1 million words9, and a list of 125 symbols to identify OOV words and abnormal symbols, respectively.
The updated measurement is then defined in Formula 12, in which the coefficients (i.e., 10.5 and 9.8) are determined using linear regression. We further normalize the readability using Formula 13, wherereadabilit y(i)is the readability of theithtweet computed using Formula 12. In Formula 13, we assume a normal distribution of tweet readability, whose mean and variance are defined in Formula 14 and 15, respectively, wherenis the number of the input tweets.
206.835−(1.015×AS L)−(84.6×ASW)−(10.5×AOW)−(9.8×AAS) (12)
readability(i) =P r(readabilit y<readabilit y(i)) (13)
ˆ µ=1n
n
∑
i=1
readabilit y(i) (14)
ˆ σ2=n1
−1 n
∑
i=1
(readabilit y(i)−µˆ)2 (15)
6 Evaluation
In this section, we evaluate our system on a manually annotated dataset. We also study the contribution of social signals, readability and user diversity, respectively.
6.1 Data Preparation
Unlike such multi-document summarization tasks in Document Understanding Conference (DUC), no gold-standard dataset for tweet summarization is available. We manually anno-tate a dataset (DS) for automatic evaluation of summarization, as described below. 100 English trending topics from March 1st to March 30th2010 are randomly selected. Some examples are “lady gaga", “Obama", “Denver", “james Cameron", and “ipad". For each trending topic, at most 1,000 English tweets are crawled using Twitter APIs. For each tweet, the information about its re-tweeted times and the number of followers of its account are computed. To facilitate future experiments, for each crawled tweet, stop words are removed and its metadata and keywords are extracted. The readability of each tweet is automatically calculated using Formula 13. Three annotators10are involved. For each topic, they independently selectMtweets (computed using Formula 1) from the related tweets, thus forming the gold-standard datasetDS. 10 topics are randomly chosen for development and the remainder for testing, denoted byDST. The system parameters, i.e., λ, δ,εandβ are experimentally set to the optimal values (0.85, 0.0001, 0.2 and 10), which yield the best performance on the development dataset.
For any topiccand any pair of annotated results from two annotators, denoted byAcand Bc, we compute the inter-agreement with Formula 16. The average inter-agreement (over all topics and all possible pairs) is 0.78.
inter−agreement(Ac,Bc) =| Ac∩Bc|
|Ac∪Bc| (16)
6.2 Evaluation Metrics
We adopt the widely used ROUGE-N as performance metrics, which is an n-gram recall based statistic that can be computed as follows:
ROUGE−N(s) =
∑
r∈R−−−→Φn(r)·−−−→Φn(s)
∑
r∈R−−−→Φn(r)·−−−→Φn(r)
(17)
Where: R= {r1,r2,· · ·,rm}is a set of reference summaries; s is a summary generated automatically by some system;−−−→Φn(d)is a binary vector representing the n-grams contained in a documentd; theithcomponentΦi
n(d)is 1 if theithn-gram is contained ind and 0 otherwise.
6.3 Results
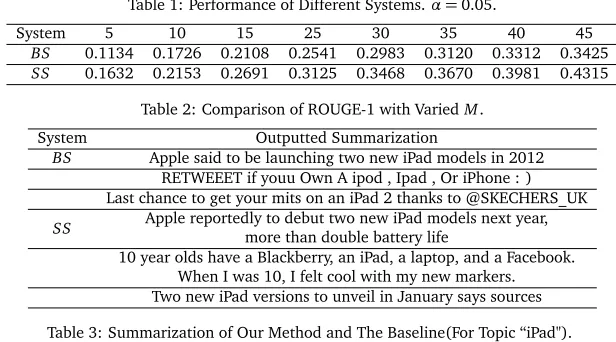
Table 1 reports the ROUGH-1 and ROUGE-2 of the baseline (BS) and our system (SS), withα=0.05. We observe a significant improvement of ROUGE-1 and ROUGE-2, showing the overall advantages of our system. We varyM, and find our method consistently outper-forms the baseline, as showed in Table 2. As a case study, we list the outputs of our system and the baseline, respectively, in Table 3.
Social signals, readability and user diversity are added to the baseline, respectively, to study their contributions. The corresponded systems are denoted byBSS,BSRandBSU, respectively. Table 4 shows the results, from which it can be seen that social signals are most helpful, followed by readability and then user diversity. We also combine any two of the three factors, add them to the baseline, and test the updated system. Results are listed in Table 5. The subscript letters S, R and U stand for social network features, readability and user diversity, respectively. We see the combination of S andRoutperforms other settings.
System ROUGE-1 ROUGE-2
BS 0.3591 0.2871
[image:12.420.47.355.197.368.2]SS 0.4562 0.3692
Table 1: Performance of Different Systems.α=0.05.
System 5 10 15 25 30 35 40 45
BS 0.1134 0.1726 0.2108 0.2541 0.2983 0.3120 0.3312 0.3425 SS 0.1632 0.2153 0.2691 0.3125 0.3468 0.3670 0.3981 0.4315
Table 2: Comparison of ROUGE-1 with VariedM.
System Outputted Summarization
BS Apple said to be launching two new iPad models in 2012 RETWEEET if youu Own A ipod , Ipad , Or iPhone : ) Last chance to get your mits on an iPad 2 thanks to @SKECHERS_UK SS Apple reportedly to debut two new iPad models next year,more than double battery life
10 year olds have a Blackberry, an iPad, a laptop, and a Facebook. When I was 10, I felt cool with my new markers. Two new iPad versions to unveil in January says sources
Table 3: Summarization of Our Method and The Baseline(For Topic “iPad").
7 Application to Twitter Search
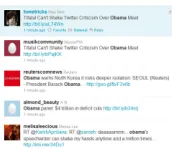
Twitter search is an increasingly popular service of providing access to tweets. It returns a list of matched tweets for a given query, as illustrated in Figure 1. We observe two problems here. Firstly, there are often similar tweets in the search results. For example, the first and the second tweet in Figure 1 are almost the same. This kind of redundancy is annoying since in general users are more interested in “new" information when reading tweets. Secondly, a large number of tweets in search results, e.g., those about private conversations or those which are fragmented and hard to understand (e.g., the fifth tweet in Figure 1), are not meaningful for the general audience.
We apply our multi-tweet summarization system to the results of Twitter search, and build an end-to-end application, as illustrated in Figure 2. By default only representative tweets are displayed, and each of them has a “show similar results” link. Clicking the link will show at most 10 tweets most similar to the corresponded tweet.
System ROUGE-1 ROUGE-2
BS 0.3591 0.2871
BSS 0.4218 0.3251
BSR 0.3945 0.3148
[image:13.420.155.277.69.123.2]BSU 0.3748 0.3016
Table 4: Contribution of Social Signals, Readability and User Diversity. System ROUGE-1 ROUGE-2
BS 0.3591 0.2871
[image:13.420.153.277.142.192.2]BSSR 0.4512 0.3587 BSSU 0.4381 0.3471 BSRU 0.4217 0.3294
Table 5: Contribution of Social Signals, Readability and User Diversity.
Figure 1: An example of Twitter search about “Obama"
Figure 2: An example of summarization of Twitter search results about “Obama".
30th2010. Then for each query inDSU, results from Twitter search and our system are displayed side by side, and 3 users11are asked to choose which is better. For each user, we record how many queries our system is voted to be better. The inter-rater agreement12 between users is also computed. Table 6 shows the results, suggesting that users tend to be more satisfied with our system. The inter-rater agreement is 0.74, indicating that users are more likely to agree with each other. Note that the values in the “Votes for ours" column are computed using Formula 18, whereQudenotes the queries for which the useru∈ {A,B,C}
believes our system gives better results than Twitter search, andQdenotes all queries in
[image:13.420.163.249.213.287.2] [image:13.420.128.284.309.406.2]DSU.
|Qu|
|Q| ×100% (18)
User Votes for ours (%)
A 72
B 57
C 58
Table 6: Comparison between our system and Twitter search. A, B and C denote three annotators, respectively. The inter-rater agreement is 0.74.
8 Conclusion and Future work
We study the task of multi-tweet summarization, which selects a given number of represen-tative tweets so as to keep important information while dropping noise and redundancy. One main motivation of this task is to provide a tool to help people efficiently access a large number of tweets, which are short and prone to noise. This is important considering that tweets are one increasing popular repository of fresh information. We advocate that multi-tweet summarization is an important building block for other information extraction tasks on tweets, in the sense that it allows these tasks to focus on important tweets. One main challenge is the lack of information to compute a tweet’s salience score. We propose a graph-based system which leverages social network features, readability and user diversity to address this challenge. On a manually annotated gold-standard dataset, we show our system outperforms the state-of-the-art baseline. We apply our system to Twitter search and demonstrate that it improves user’s satisfaction to Twitter search. In our experiments, we have observed that users are often more interested in tweets with events or opinions. Therefore, exploiting events and opinions in tweets represents a promis-ing direction to explore in future.
References
Barzilay, R., Elhadad, N., and McKeown, K. R. (2001). Sentence ordering in multidocu-ment summarization. InHLT, pages 1–7.
Barzilay, R., McKeown, K. R., and Elhadad, M. (1999). Information fusion in the context of multi-document summarization. InACL, pages 550–557.
Duan, Y., Jiang, L., Qin, T., Zhou, M., and Shum, H.-Y. (2010). An empirical study on learning to rank of tweets. InColing, pages 295–303.
Efron, M. (2011). Information search and retrieval in microblogs.Journal of the American Society for Information Science and Technology, 62(6):996–1008.
Erkan, G. and Radev, D. R. (2004). LexRank: Graph-based Lexical Centrality as Salience in Text Summarization.Journal of Artificial Intelligence Research, 22.
Golbeck, J., Grimes, J. M., and Rogers, A. (2010). Twitter use by the u.s. congress.Journal of the American Society for Information Science and Technology, 61(8):1612–1621.
Goldstein, J., Kantrowitz, M., Mittal, V., and Carbonell, J. (1999). Summarizing text documents: Sentence selection and evaluation metrics. InIn Research and Development in Information Retrieval, pages 121–128.
Hardy, H., Shimizu, N., Strzalkowski, T., Ting, L., Zhang, X., and Wise, G. B. (2002). Cross-document summarization by concept classification. InSIGIR, pages 121–128.
Heverin, T. and Zach, L. (2010). Twitter for city police department information sharing. Proceedings of the American Society for Information Science and Technology, 47(1):1–7.
Inouye, D. and Kalita, J. K. (2011). Comparing twitter summarization algorithms for multiple post summaries. InSocialCom/PASSAT, pages 298–306.
Jansen, B. J., Zhang, M., Sobel, K., and Chowdury, A. (2009). Twitter power: Tweets as electronic word of mouth.Journal of the American Society for Information Science and Technology, 60(11):2169–2188.
Knight, K. and Marcu, D. (2002). Summarization beyond sentence extraction: a proba-bilistic approach to sentence compression.Artif. Intell., pages 91–107.
Kwak, H., Lee, C., Park, H., and Moon, S. (2010). What is twitter, a social network or a news media? InWWW, pages 591–600.
Liu, X., Li, K., Han, B., Zhou, M., Jiang, L., Xiong, Z., and Huang, C. (2010). Semantic role labeling for news tweets. InColing, pages 698–706.
Liu, X., Zhang, S., Wei, F., and Zhou, M. (2011). Recognizing named entities in tweets. InProceedings of the 49th Annual Meeting of the Association for Computational Linguistics: Human Language Technologies - Volume 1, HLT ’11, pages 359–367, Stroudsburg, PA, USA. Association for Computational Linguistics.
Mani, I. and Bloedorn, E. (1999). Summarizing similarities and differences among related documents.Inf. Retr., pages 35–67.
Neto, J., Freitas, A., and Kaestner, C. (2002). Automatic text summarization using a machine learning approach. In Bittencourt, G. and Ramalho, G., editors,Advances in Artificial Intelligence, volume 2507 ofLecture Notes in Computer Science, pages 205–215. Springer Berlin / Heidelberg.
O’Connor, B., Krieger, M., and Ahn, D. (2010). Tweetmotif: Exploratory search and topic summarization for twitter. InICWSM.
Page, L., Brin, S., Motwani, R., and Winograd, T. (1998). The PageRank Citation Rank-ing: Bringing Order to the Web. Technical report, Stanford Digital Library Technologies Project.
Qazvinian, V. and Radev, D. R. (2008). Scientific paper summarization using citation summary networks. InProceedings of the 22nd International Conference on Computational Linguistics - Volume 1, COLING ’08, pages 689–696, Stroudsburg, PA, USA. Association for Computational Linguistics.
Qazvinian, V. and Radev, D. R. (2010). Identifying non-explicit citing sentences for citation-based summarization. InProceedings of the 48th Annual Meeting of the Association for Computational Linguistics, ACL ’10, pages 555–564, Stroudsburg, PA, USA. Association for Computational Linguistics.
Radev, D. (2004). Centroid-based summarization of multiple documents. Information Processing & Management, pages 919–938.
Saggion, H. (2011). Learning predicate insertion rules for document abstracting. In CICLing (2), pages 301–312.
Sankaranarayanan, J., Samet, H., Teitler, B. E., Lieberman, M. D., and Sperling, J. (2009). Twitterstand: news in tweets. InGIS, pages 42–51.
Sharifi, B., Hutton, M.-A., and Kalita, J. (2010). Summarizing microblogs automatically. InHLT: NAACL, HLT ’10, pages 685–688.
Wan, X. and Yang, J. (2008). Multi-document summarization using cluster-based link analysis. InSIGIR, pages 299–306.
Weng, J., Lim, E. P., Jiang, J., and He, Q. (2010). TwitterRank: finding topic-sensitive influential twitterers. InWSDM, pages 261–270, New York, NY, USA.