A Study on the Approaches and Algorithms
for Classification of Synthetic Aperture Radar
Ahmad Reza Aghajani Fesharaki1, Mehran Emadi2
Master Student, Dept. of Electrical Engineering, ACECR Institute of Higher Education (Isfahan Branch), Isfahan, Iran1
Assistant Professor, Dept. of Electrical Engineering, Mobarakeh Branch, Islamic Azad University, Mobarakeh, Iran2
ABSTRACT: The present study compares a summary of approaches and algorithms for classifying synthetic aperture
radar images in recent years, and points out the advantages and disadvantages of each. The unsupervised classification methods in this study include: symmetric revised Wishart distance method, used for evaluating equality of two multilook covariance matrixes, and mixed Hotelling- Lawley test statistic as a new tets statistic for detecting changes in multilook polarimetric radar images. Also, image classification with Fuzzy C-means through Markov random field and NW-FCM are the two other unsupervised classification methods used in this study.
The supervised methods are: a method for Hotelling-Lawley as a new test statistic to detect changes in multilook polarimetric radar images and another method for classification of polarimetric data based on polarimetric signatures.Multilook optimization method and a method based on CGGD distribution model are two other supervised methods in this study.
KEYWORDS: image classification, synthetic aperture, radar, CGGD distribution model
I. INTRODUCTION
Nowadays, radar evaluation images are among the newest data in studying land cover, land use, and urban areas. These images are of high importance due to providing up-to-date information, diversity of forms, being digital, and the capability of processing in mapping land use and urban areas. Thus, these images are used worldwide for making land use maps and classifying urban areas. RADARSAT satellite set is among the first spaceborne satellites that use sensors to produce images. SAR is a science that makes possible measuring and analyzing a phenomenon’s characteristics and providing proper images, without direct contact. Two common types of remote sensing are optical and radar imaging. In optical imaging visible light zone is used and the sun is the radiation source, and in radar imaging microwave zone is used and the microwave transmitting antenna is the radiation source. The advantage of radar imaging is that it does not need an external light source, can be used in day and night, has the minimum wave weakening in the atmosphere, can work in any weather even cloudy and foggy, taking images with higher resolution, and can penetrate the land and identify objects in shallow depths. Radar has been used to see beneath the land surface since the Second World War. They were mainly used to reveal the distance and speed of moving targets but today are also used for imaging.
II. CLASSIFYING IMAGES IN REMOTE SENSING
Land cover is divided into forests, agricultural, urban areas, etc. there are two main classifications: 1- unsupervised classification, 2- observed classification
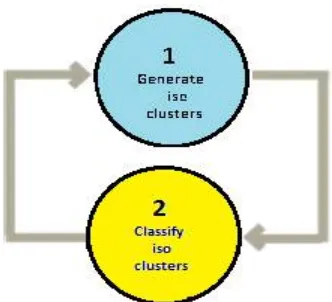
Unsupervised classification
Figure 1: unsupervised classification
Recently many studies have focused on unsupervised detection of changes using radar images with combined aperture. In unsupervised detection, changes are generally evaluated after pre-process of radar images, including radiometric and geometric correction and making multilook, geometric saving of images against each other, two multi-time images, pixel by pixel through a desired test statistic. Next, a reliable limitation algorithm should be applied to test statistic image, to gain a reliable change plan.
Ghanbari et al. used symmetric revised Wishart distance in 2016 to evaluate equality of two multilook covariance matrixes of two polarimetric synthetic aperture radar images. They had already presented the symmetric revised Wishart distance in 2015 as a test statistic for change detection between two multilook covariance matrixes.
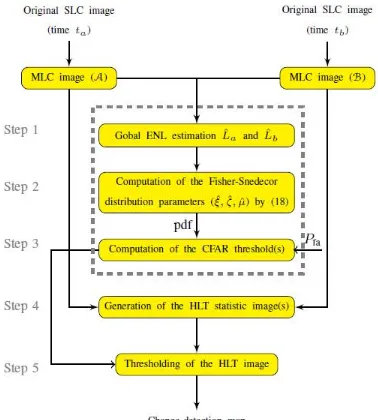
The overall view of the suggested change detection method is presented below:
Figure 2: general diagram of the suggested change detection approach
and noise reduction. In the second stage two images pre-processed by the same statistic are considered, and can be used in the third stage. Below is the diagram on change detection algorithm.
Figure 3: the suggested general diagram of the data change detection
Tests run on the simulated and real sets of data showed a higher detection rate and a lower error rate.
Hongelei et al. presented a new image classification method through Fuzzy C-means in 2013, in which used location restrictions using Markov random field. In this method, a new clustering algorithm is presented which is resulted from combining Fuzzy C-means and Markov random field. Density function is used as the first component and represents class differences based on the FCM algorithm used. Tests run on the simulated and real sets of data showed a higher classification accuracy and visual quality, compared to FCM.
Supervised classification
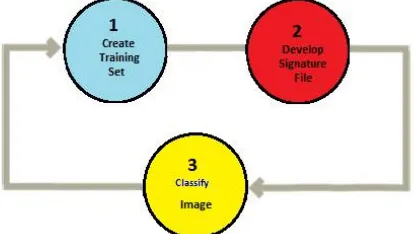
In this classification, the user defines samples for each digital cover, called training site. Here, classification is based on training sites the user has introduced to the application through spectral signatures. The classifying application decides how much each class is similar to the training sites, and classifies based on the result. General methods of supervised classification have the highest possibility and lowest distance, and its levels are: 1. Choosing training sites, 2. Developing signature files, 3. Classification.
Figure 4. Supervised classification
Maghsodi et al. (2014) presented a new method for Hotelling-Lawley as a new test statistic for change detection in polarimetric multilook radar images. In this method, text classification is presented for classifying polarimetric radar images with virtual aperture. The proposed method functions through combining support vector machine SVM and Wishart classifier. Thus, this method enjoys advantages of both parametric and non-parametric methods. In this method, first the Markov Random Field energy function is calculated in a neighborhood of each pixel. Next, using the polarimetric data covariance matrix for each pixel and considering its Wishart the differential energy function is calculated and enters the SVM classifier. In the proposed method in addition to the different distribution information, the neighborhood information is also used which reduces noise in the classification result. To select proper features and to determine optimal parameters an algorithm is used for genetics SVM classifier. The classification results are shown in the following diagram:
Diagram 1: Classification results
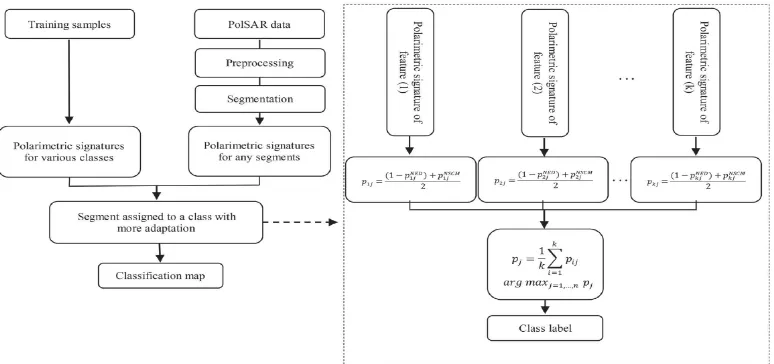
Jafari et al. introduced a new method for classifying polarimetric data in 2014 that can use polarimetric information in extra polarization bases. The base of this method is polarimetric signatures that are presented for different features in addition to power. Like other knowledge-based methods, the suggested method has two steps: 1. Source knowledge extraction, 2. Classifying using this knowledge. Three types of features are used here: complete covariance matrix, analytical values of H/a/A, and texture vector resulting from the co-occurrence matrix. Also, PCA algorithm is used to reduce feature space. The method is for extracting source knowledge of polarimetric signatures of different features. To classify through this method, correspondence methods are used. Also, to prevent noise output and for stability of polarimetric signatures in a piece object-based method is selected. The overall steps of the proposed method are demonstrated below:
Figure 5: overall steps of the proposed method for classification of polarimetric images
The steps include five general phases: pre-processing the polarimetric data, data segmentation, extracting polarimetric signature for source classes and unknown piece, and ultimately classification design and evaluation of classification results. The method has a general accuracy of 82.12% which is higher than other similar methods, but still needs to improve.
Maghsodi et al. in 2015 proposed a method for improving classification of urban areas using radar polarimetric data and multi-purpose improvement methods.
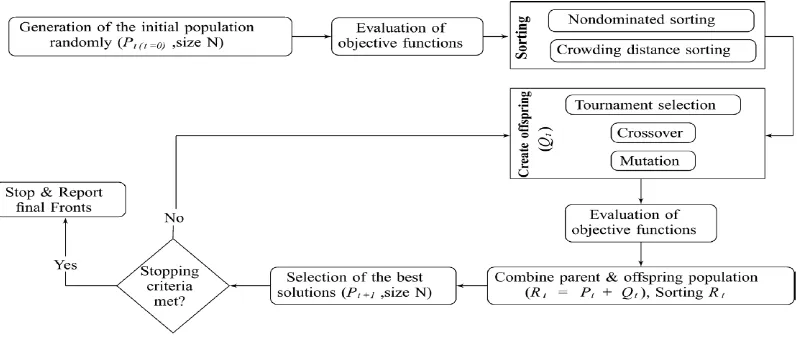
Figure 6: general view of MOGA-SVM/ANFIS algorithm for classification of images
Figure 7: flowchart of NSGA-II algorithm
Specifically, first the SRW distance image during a phase of digitization is digitalized to L gray degrees; the stage is required for the implementation of the Keatler and Ilingors committee of error algorithm and then the digitalized image will enter the process of thresholding so that the final map of the change or no change is gained through applying the error committee threshold as the output of the algorithm. Digital results of algorithm application on complete polarimetric simulated and real data shows that having more information from different polarizations in complete polarimetric images compared to single band images leads to higher unsupervised detection accuracy. Also, comparing the presented error minimum with improved evaluation method confirms high accuracy with minimum error of the algorithm proposed. Operation duration in this method is pretty short and since K&I uses image histogram in its algorithm, the algorithm running time does not depend on image size, and only a very minor difference in gaining the histogram may occur. Using test statistic cannot distinguish the type of changes resulted from increase or decrease of radar redistribution. The proposed method can detect the changes’ strength. Digital results and diagrams on conformity verification show the generalized Gamma distribution function used in this method can successfully model change and no change classes histograms for the polarimetric dada used.
Here, a class has been used that divides the images as natural, plant tissue, man-made circular and non-circular areas. Experiments conducted in this area represent high resolution of images.
III. CONCLUSION
In this paper, a summary of the methods and classification algorithms of synthetic aperture radar images calssification and advantages and disadvantages were discussed. In the unsupervised method Fuzzy C-means algorithm was used to develop two new algorithms, in the first of which Cheng Hung achieved NW-FCM new model using weight feature that performs better in detecting a model for images with more than one class, compared to FCM and FWCM. In the second algorithm Hongelei et al. Markov random fields and have achieved enhanced visual quality classification accuracy, compared to FCM algorithm. Also Anfinsen et al. presented mixed Hotelling-Lawley test statistic as a new test to detect the change in multilook polarimetric radar images and test results showed higher detection rate and lower error rate for this method.
Ghanbari and his colleagues presented corrected symmetrical Wishart using distance as a test statistic to detect the change between two multilook covariance matrixes. The main innovation of this method is the strength of K&I investment threshold in which change and no change classes have been modeled based on the generalized gamma probability density function for test SRW images.
In the supervised method, Maghsodi et al. provided a new method in 2014 for Hotelling-Lawley as a new test statistic for detecting changes in multilook polarimetric radar images. This method showed 16%, 11%, and 7% accuracy improvement compared to Wishart, Wishart-Markov, and SVM, respectively. Also, Jafari et al. introduced a new method for classifying polarimetric data in 2014 that can use polarimetric information in extra polarization bases. The method has a general accuracy of 82.12% which is higher than other similar methods. Maghsodi et al. in 2015 proposed a method for improving classification of urban areas using radar polarimetric data and multi-purpose improvement methods.
Digital results and diagrams on conformity verification show the generalized Gamma distribution function used in this method can successfully model change and no change classes histograms for the polarimetric dada used. Finally, Wenjin et al in 2015 provided an urban land use information extraction method with high-resolution by SAR imagery. Experiments conducted in this area represent high resolution of images.
REFERENCES
[1]Akbari, V., Anfinsen, S. N., Doulgeris, A. P., and Etloft, T, “The Hotelling-Lawley trace statistic for change detection in polarimetric SAR data under the complex Wishart distribution.” in Proc. IEEE Int. Geosc. Remote Sens. Symp. IGARSS 2013, Melbourne, VIC, pp. 4162-4165,2013. [2]Akbari. V., S. N. Anfinsen, A. P. Doulgeris, T. Eltoft, G. Moser, and S. B. Serpico: Polarimetric SAR Change Detection with the Complex Hotelling-Lawley Trace Statistic, IEEE Trans. Geosci. Remote Sens, 2016.
[3]Ghanbari, M., Akbari, V., Abkar, A. A., and Sahebi, M. R, “A Test Statistic Based on Wishart Distribution for Unsupervised Change detection in Multilook Polarimetric SAR Data.” Journal of Radar. vol. 4, pp. 39-49 (in Persian), 2015.
[4]Akbari, V, “Multitemporal analysis of multipolarization synthetic aperture radar images for robust surface change detection.” dissertation for the degree of Philosophiae Doctor. Feculty of science and technology, department of physics and technology. University of Tromso, Norway, vol.
51(4):2442-2453, 2013.
[5]A.Shojaeeyan Scientific - Research Quarterly of Geographical Data (SEPEHR) Vo.24,No.93, Spring 2015 .
[6]W. Wu , H. Guo , X. Li, and L. Zhang “Urban Land Use Information Extraction Using the Ultrahigh-Resolution Chinese Airborne SAR Imagery” IEEE Transaction on Geoscience and Remote Sensing, vol. 53, no. 10, Octobr 2015.
[7]Y. Honglei , P. JunHuan , X. BaiRu, and Z. DingXuan “Remote Sensing Classification Using Fuzzy C-means Clustering with Spatial Constraints Based on MarkovRandom Field” European Journal of Remote Sensing, 2013.
[8]Ch. Cheng Hung , S. Kulkarni, and B. Chen Kuo , “A New Weighted Fuzzy C-Means Clustering Algorithm for Remotely Sensed Image Classification” IEEE JOURNAL OF SELECTED TOPICS IN SIGNAL PROCESSING, VOL. 5, NO. 3, JUNE 2011.
BIOGRAPHY