Mutual Information Based Analysis and
Prediction of Speech Intelligibility
Chetana1, Dr.M.N.Sreerangaraju2
PG Student [DEC], Dept. of ECE, Bangalore Institute of Technology, Bangalore, Karnataka, India1 Professor, Dept. of ECE, Bangalore Institute of Technology, Bangalore, Karnataka, India2
ABSTRACT: Speech is the normal type of communication and is the most fundamental and usually utilized communication by all the individuals. Henceforth, the expectation of speech understand ability (intelligibility) is the essential functionality. There are diverse methods for describing the correspondences capability of speech. One profoundly quantitative methodology is information theory. As per information theory, speech can be represented to regarding its message substance or data. Another method for describing speech is as far as the signal conveying the message data is the acoustic waveform. The paper manages the issue of anticipating the speech intelligibility. The proposed model comprises of a clean speech signal and a processed signal. The proposed comprehensibility expectation model makes utilization of essential hypothetical tools like entropy and mutual information. The speech understand ability is monotonically identified with the mutual information. What's more, the mutual information is the function of critical band sufficiency envelopes of clean signal and processed signal.
KEYWORDS: Mutual information, Speech intelligibility, Noise reduction, Speech enhancement, Critical band envelope.
I.INTRODUCTION
The speech intelligibility prediction methods have the main aim of predicting speech intelligibility of noisy/processed speech signals. The speech is the most important means of communication in humans .The main application of speech processing was telecommunication. Whenever a speech signal is generated from one end, at the same time if the speech signals are existing from other side then there exist reverberence or echo in the signal. Hence the quality of the signal gets decremented. Hence, speech intelligibility can be defined as “The quality of the signal” or “How comprehensible the speech is under the given conditions, such as background noise, reverberence or echoes”. Intelligibility exactly refers to the "understandability" of speech, the match between the aim of the speaker and the reaction of the audience, and the capacity to utilize speech to impart viably in regular circumstances .In this paper we are going to predict the speech intelligibility based on the mutual information value, using SIMI (speech intelligibility based on mutual information) model. The mutual information is obtained by comparing the critical band amplitude envelopes of the clean signal and noisy/processed signal.
Motivation for studying speech intelligibility predictors:
1. The reliable intelligibility predictors are very important in development of speech intelligibility algorithms. 2. These predictors will replace costly speech listening tests.
3. The study and analysis of speech intelligibility predictors will lead to better understanding of mechanism behind human intelligibility capabilities.
There are many speech intelligibility prediction models such as sSTI(Speech STI) ,coherence SII,STOI and Jorgenson and Dau model, SIMI model etc. In these STOI and SIMI model are simple and efficient methods.
II. PAPER ORGANIZATION
long-term spectra of speech and masker and therefore may be in-accurate,for fluctuating maskers[2]. To reduce this problem, Rhebergen proposed the Extended SII [3], which divides the speech and masker signal into short-time frames (9–20 ms), computes the instantaneous SII value for each frame, and then averages the per-frame SII values to find a final intelligibility prediction.
In STOI model the noise is additive but not necessarily stationary[4]. Here we consider a processing method which can be described in time-frequency analysis, modification and synthesis framework. Analysis stage: In the analysis stage the incoming speech signal is decomposed into several time-frequency units. Modification stage: In modification stage the gain factors are multiplied onto the several time-frequency units, using band pass filter bank. Synthesis stage: In synthesis stage these modified time–frequency units are used to reconstruct back the original speech signal.
Figure.1.Stages of STOI model
Since the gain factors are not constant the model is time varying and non-linear. Even though STOI(short time objective intelligibility)is similar to SIMI model, The SIMI model is more productive than STOI model. But SIMI model compares critical band amplitude envelopes using mutual information, which is simple for mathematical computation.
IV. OBJECTIVE
we want to ensure that our proposing technique is to estimate the amount of mutual information in order to predict the speech intelligibility.
V. SCOPE OF THE WORK
The computation of mutual information has become significant for knowing the speech intelligibility/understand ability. By knowing the estimated value it is possible to increase the performance and also within short period of time is possible to remove the noise present in the speech signal using wiener filter. And also this proposing system can give us to a high accuracy compared to other models. And different speech enhancement techniques can be used to improve the speech intelligibility.
VI. PROPOSED METHODOLOGY
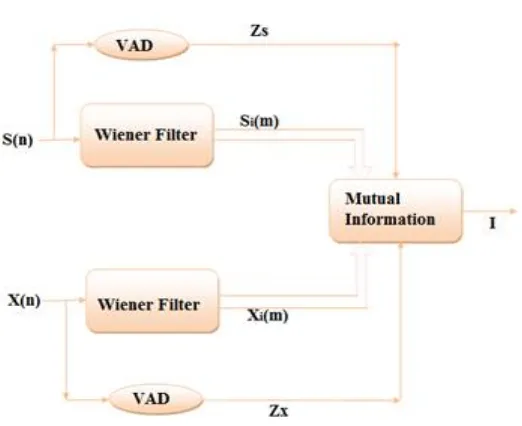
Figure.2.Speech intelligibility prediction using SIMI model
The upper cases are used to denote ramdom processes and variables.Lower cases are used to denote the corresponding realisations.Let S(n) denotes clean speech signal,and X(n) is the corresponding processed signal.The different blocks of the model are explained below.
A. Voice activity detection:
VAD is used to determine the voice is present in a particular audio signal. A block diagram of VAD is shown in figure 3. It consists of: i) the feature extraction process, ii) the decision module, and iii) the decision smoothing stage.
Figure .3. Block diagram of a VAD.
2.
The Hanning analysis window is applied and the DFT coefficients are given byThe discrete Fourier transform (DFT) is used to transform from time domain frames into frequency domain frames. Where,
k : Frequency bin index m :The frame index
D : The frame shift in samples W(n) : Analysis window
3. One third octave band analysis is done by grouping DFT bins, results in critical band amplitudes
Now we need to find the mutual information between the critical band amplitude envelopes of the clean and processed /noisy signal. It is easy to verify that the mutual information I(S;X) decomposes into a summation of mutual
information I(Si(m);Xi(m)) terms.
Where,
|.| : denotes set cardinality and
L|Zs| : Estimates the number of speech-active critical-band amplitudes in the clean signal.
As both the signals S(n) and X(n) are active speech signals, the equation follows over the frame index set mєZsՈZx and excludes I(Si(m);Xi(m)) terms as it is zero. For the convenience let us, simply replace Si(m) and Xi(m) by S and X. Therefore, the mutual information I(S;X) between the clean and the noisy critical band amplitudes is given by,
Where,
h(S) = Differential entropy.
h(S/X) = Conditional Differential entropy
The lower bound on mutual information I(S;X) is resulting by upper bounding the conditional entropy h(S/X).The conditional | is equal to the mean square error(mse) estimator of the clean arbitrary variable S on observing the
noisy processed comprehension X. ILB,mmse (S;X) ≤ I(S;X)
Thus the mutual information is given by,
...(7) Where,
I(S;X) = Mutual information between clean and noisy speech, h(Z) = Differential entropy,
= Variance of critical band amplitude (Z), = Unity,
Dlmmse = Linear minimum mean square error.
VII. SIMULATIONS AND DISCUSSIONS
The outcomes are acquired by simulating the code in MATLAB. The mutual information is effectively obtained between clean speech signal and processed signal with additive noise. Signals are divided into frames of length N=256 samples. we use a frame shift of D=N/2=128 samples. DFT coefficients are grouped into L=15 a total of third-order octave bands, with a center frequency of 150 Hz.
Parameter values used are:
The average per sentence mutual information is finally computed as:
...(8)
Figure4.Plot of input clean speech signal Figure5.Plot of Filtered clean speech signal
The input clean speech signal is considered. Even though it is clean speech signal some background noise will be present in it. Hence a Wiener filter is applied to the signal. The Wiener filter is used to filter out the noise from the corrupted signal to provide an estimate of the underlying signal of interest. The spectrum after applying the wiener filter is shown in figure5.
Figure.6.Plot of clean speech signal on applying VAD Figure.9.Plot of noisy signal on applying VAD
The Figure 6 shows the spectrum of clean speech signal when applied to VAD. The voice activity detection will detect the speech present in the speech signal and whenever there will be silence region then there is no signal representation. Hence the envelope shows the present or absence of the speech.The Figure 9 shows the spectrum of noisy signal when applied to VAD.
The input clean speech signal with the additive noise is considered. Manually, the additive white Gaussian noise is added to the clean speech signal. Hence a Wiener filter is applied to remove the noise present in the signal.The Wiener filter is used to filter out the noise from the corrupted signal to provide an estimate of the underlying signal of interest. The spectrum after applying the wiener filter to the noisy/processed signal is shown in figure8.
The simulation results for the mutual information between clean speech signal and noisy signal with additive noise is given below.
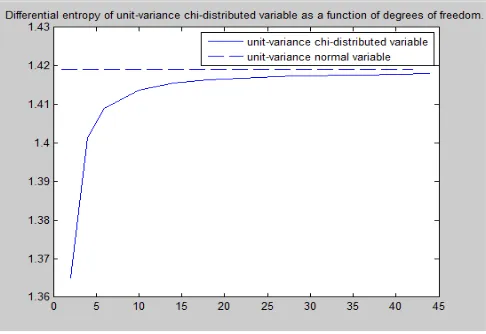
Fig. 10 plots h(S) as a function of the number of degrees of freedom for the case where the critical-band amplitude variance is unity. For comparison, the differential entropy of a unit-variance Gaussian , 1.4189 is included. Clearly, h(S) is close to the upper bound except for the lowest frequency critical bands where k’=2.
Figure.10. Differential entropy of unit- variance chi-distributed variable as a function of degrees of freedom.
VIII. CONCLUSION
The mutual information is successfully calculated between clean speech signal with additive noise. In the present work the clean speech is processed by considering the additive noise but not necessarily stationary noise sources, and a non linear processing is considered. Algorithm needed for estimating the intelligibility listening test are of great importance in order to reduce the number of costly listening tests. The processing considered is quite broader and hence it can be used in single channel noise reduction algorithm. The present work follows the theory that, it can be monotonically related to Shannon information about a clean critical band amplitude envelopes and upon observing, the noisy processed counterparts can be learnt. Then the lower bound for this mutual information is derived that can be traced analytically. Thus the information lower bound can be computed as a function of MMSE that arise by estimating the critical band amplitude of a clean speech signal from its noisy counterparts.
ACKNOWLEDGMENT
REFERENCES
[1] Jesper Jensen, Cees H. Taal, “Speech Intelligibility Prediction Based on Mutual Information”, IEEE/ACM transactions on audio, speech, and language processing ,vol. 22, no. 2, February 2014.
[2] Methods for the Calculation of the Speech Intelligibility Index, ANSI S3.5, American National Standards Institute, New York, NY, USA,1995. [3] K. S. Rhebergen and N. J. Versfeld,“A speech intelligibility index based approach to predict the speech reception threshold for sentences in fluctuating noise for normal-hearing listeners,” J. Acoust. Soc.Amer., vol. 117, no. 4, pp. 2181–2192, 2005.
[4] Cees H. Taal, Richard C. Hendriks, Richard Heusdens,and Jesper Jensen, “An Algorithm for Intelligibility Prediction of Time–Frequency Weighted Noisy Speech”, IEEE transactions on audio, speech, and language processing, vol. 19, no. 7, September 2011
[5] J. Ma, Y. Hu, and P. Loizou, “Objective measures for predicting speech intelligibility in noisy conditions based on new band-importance functions,” J. Acoust.Soc. Amer., vol. 125, no. 5, pp. 3387–3405, 2009.
[6] Jalal Taghia, Rainer Martin Richard C. Hendriks, “On Mutual Information As A Measure Of Speech Intelligibility”, ICASSP 2012 IEEE 978-1-4673- 2012.
[7] J. B. Boldt and D. P.W. Ellis, “A simple correlation-based model of intelligibility for nonlinear speech enhancement and separation,” in Proc.17th Eur. Signal Process. Conf. (EUSIPCO), 2009, pp. 1849–1853.