Color Image Stitching Using Scale Invariant Feature
Transform with 2-Dimensional Entropy Segmentation
Mu Zhou, Mingchun Wang, Zengshan Tian
Chongqing Key Lab of Mobile Communications Technology, Chongqing University of Posts and Telecommunications, Chongqing 400065, P. R. China
Abstract
This paper proposes a novel color image stitching approach by using the two-dimensional (2-D) maximum entropy threshold segmentation based Scale Invariant Feature Transform (SIFT). First of all, we conduct image segmentation based on the gray level of each pixel and the average gray level of its adjacent pixels. Second, we rely on the key points obtained from the extreme points in different scale spaces of SIFT to stitch the color images. The experimental results show that the proposed image stitching approach significantly increases the number of matching points of the images for image stitching. Keywords: Color Image Stitching, SIFT, Maximum Entropy, Image
Segmentation, Gray Level
1. Introduction
Image stitching is one of the most significant branches of computer vision and image processing. The concept of image stitching is that two or more images are stitched together to obtain a wide field of view. Image stitching plays an import role in many fields [1], [2], like the multimedia CD-Rom production, virtual exhibition, real estate exhibition, digital video, medical image processing, and 3-D view. There are two major steps involved in image stitching, the image matching and image fusion. The purpose of image matching is to extract and match the features in different images which are taken at different times, in different places, and even by different cameras. Image fusion is with the purpose of fusing the overlapped parts in different images and obtaining a full view image.
Since the performance of image stitching seriously approaches to well conduct image stitching is to enhance the accuracy performance of image matching. The authors in [3] used a cross correlation algorithm to realize image matching for the remote multi-spectral and multi-temporal images by using Fast Fourier Transform (FFT). The sequential similarity detection algorithm is presented in [4] to eliminate the unmatched points, as well as save the cost for image matching. Rosenfeld et al in [5] proposed a new concept of cross correlation-based image matching based on the similarities of the gray areas in different images. The Harris operator is utilized in [6] to extract angular feature points for the sake of achieving the well performance in computation cost and stability. Brown et al in [7] illustrated the four major factors considered during the process of image matching, the feature spaces, searching spaces, searching strategies, and similarity measurements. Considering the deformation property of medical images, the authors in [8] and [9] proposed to use
mutual information to conduct the medical image matching.
By normalizing the rotation and translation to obtain affine invariant features, the Scale Invariant Feature Transform (SIFT) [10] is proved to perform well in different conditions of image rotation, transformation, and zooming [11]. One of the most widely used approaches to local features representation is based on the construction of the histograms of gradient locations and orientations [12].
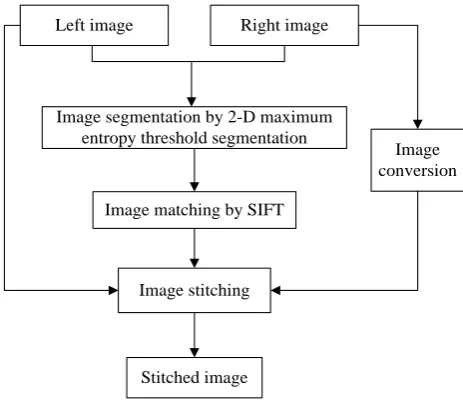
Although the SIFT guarantees the feature invariance with respect to the image rotation and scale changing, as well as generates a large number of feature points, the number of matching points detected by SIFT is small. On this basis, we propose to use the 2-dimensional (2-D) maximum entropy threshold segmentation based SIFT for image stitching. The process of the proposed image stitching approach is described in Fig.1.
The rest of this paper is organized as follows. In Section II, the steps of image matching by using the 2-D maximum entropy threshold segmentation based SIFT are addressed. In Section III, we rely on image fusion to conduct color image stitching. The experimental results are provided in Section IV. Finally, Section V concludes the paper and presents some future directions.
Left image
Image conversion Right image
Image segmentation by 2-D maximum entropy threshold segmentation
Image matching by SIFT
Image stitching
Stitched image
Fig. 1 Process of the 2-D maximum entropy threshold segmentation based SIFT for image stitching.
2. Image Matching
There are two major steps involved in image matching by using the 2-D maximum entropy threshold segmentation based SIFT. First of all, the image segmentation is conducted based on the maximum entropy threshold segmentation. Second, the feature points in images are extracted and matched by using the SIFT.
2.1 Maximum Entropy Threshold Segmentation
We assume that an image contains M×N pixels. f x y( , )
is the gray value at the pixel ( , )x y and g x y( , ) is the average gray value at the neighbors of ( , )x y . We rely on the gray value of each pixel and its corresponding average gray value at the neighbors to construct the generalized image. Then, the image can be separated based on a 2-D threshold
{ , }(0s t ≤s t, ≤ −S 1), where S is the number of gray levels. The threshold is determined by
0 ,
1
, ( , ) and ( , )
( , )
, ( , ) and ( , )
s t
b if f x y s g x y t
f x y
b if f x y s g x y t
< <
= ≥ ≥
(1)
where 0<b b0, 1 <S. By assuming that the number of pixels with gray level i i( =0,1,,S−1) and the corresponding average gray level j j( =0,1,,S−1), notated as a gray level pair (i, j), equals to
k
i j, , we calculate the probability of each gray level pair, p i j( , )(0<p i j( , )<1), by, , i j i j k p M N = × (2)
where M and N stand for the number of pixels in horizontal and vertical directions respectively. Thus, the frequencies of different gray level pairs can be used to construct a histogram of frequencies with respect to gray levels.
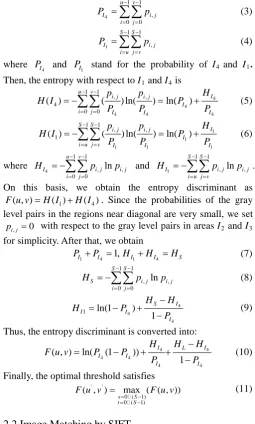
As an optimal solution to achieving the maximum entropy, the diagram used to depict the process of 2-D maximum entropy threshold segmentation is shown in Fig.2.
g
f
1
I
I
23
I
I
4Fig. 2 Diagram description of the 2-D maximum entropy threshold segmentation.
In Fig.2, the areas I4 and I1 stand for the target and
background in image respectively. The areas I2 and I3 are the
noise in image. To maximize the information of target and
background in image, we select the optimal threshold to conduct image segmentation by using 2-D maximum entropy threshold segmentation. When the threshold is set as {u, v}, we have 4 1 1 , 0 0 u v
I i j
i j
P p
− −
= =
=
∑∑
(3)1
1 1
,
S S
I i j
i u j v
P p
− −
= =
=
∑∑
(4)where
4
I
P and
1
I
P stand for the probability of I4 and I1.
Then, the entropy with respect to I1 and I4 is
4 4
4 4 4
1 1
, ,
4
0 0
( ) ( ) ln( ) ln( )
u v
I
i j i j
I
i j I I I
H
p p
H I P
P P P
− −
= =
= −
∑∑
= + (5)1 1
1 1 1
1 1
, ,
1
( ) ( ) ln( ) ln( )
S S
I
i j i j
I
i u j v I I I
H
p p
H I P
P P P
− −
= =
= −
∑∑
= + (6)where 4 1 1 , , 0 0 ln u v
I i j i j
i j
H p p
− −
= =
= −
∑∑
and1
1 1
, ln ,
S S
I i j i j
i u j v
H p p
− −
= =
= −
∑∑
.On this basis, we obtain the entropy discriminant as
1 4
( , ) ( ) ( )
F u v =H I +H I . Since the probabilities of the gray level pairs in the regions near diagonal are very small, we set
, 0
i j
p = with respect to the gray level pairs in areas I2 and I3
for simplicity. After that, we obtain
1 4 1, 1 4
I I I I S
P +P = H +H =H (7)
1 1
, ,
0 0 ln
S S
S i j i j
i j
H p p
− −
= =
= −
∑∑
(8)4 4
4
1 ln(1 )
1 S I I I I H H H P P − = − + − (9)
Thus, the entropy discriminant is converted into:
4 4
4 4
4 4
( , ) ln( (1 ))
1
I L I
I I
I I
H H H
F u v P P
P P
−
= − + +
− (10)
Finally, the optimal threshold satisfies ' '
0 ( 1) 0 ( 1)
( , ) max ( ( , ))
s S t S
F u v F u v
= − = − = (11)
2.2 Image Matching by SIFT
a) Construction of Scale Space
The purpose of scale space construction is to obtain the multi-scale space sequence in image based on the scale transformation from the raw image. Specifically, the multi-scale space sequences are extracted as feature vectors to be used for edge and corner detection and feature extraction in different image resolutions. The scale space,
( , , )
L x yσ , is calculated by the convolution of the variable-scale Gaussian ( , , )G x yσ and input image
( , )
I x y , such that
( , , ) ( , , ) * ( , )
L x y σ =G x yσ I x y (12)
where the notation “*” represents the convolution
operation.
( , )
x y
is the location of pixel. σ is the variance. G x y( , , )σ equals to2 2
2
( / 2) ( / 2)
2 2
( , , ) [1 / (2 )]
x m y n
G x yσ πσ e σ
− + −
−
= (13)
where m and n stand for the Gaussian template dimensions. To detect the stable key points in scale space, we propose to use scale-space extreme of difference Gaussian functions convolved by the image, D x y( , , )σ .
( , , ) ( ( , , ) ( , , )) * ( , ) ( , , ) ( , , )
D x y G x y k G x y I x y L x y k L x y
σ σ σ
σ σ
= −
= − (14)
where k is a multiplicative factor.
b) Detection of Space Extreme Value Point
The set of key-points consists of the extreme value points in DOG space. The key-points are detected by comparing the adjacent DOG spaces. Since the extreme value points are the extreme value points in the discrete space, they could not be the real extreme value points. To improve the stability of the key points, we rely on the least square curve fitting for the DOG function in the scale space to locate the key points. Furthermore, we determine the parameters of the key points by using the gradient direction distribution characteristics of the neighborhood pixels of the key points. The gradient value, m x y( , ) , and the corresponding direction, θ( , )x y , of the key points are as follows.
2
2
( ( 1, ) ( 1, ))
( , )
( ( , 1) ( , 1))
L x y L x y
m x y
L x y L x y
+ − − +
=
+ − − (15)
1 ( , 1) ( , 1)
( , ) tan
( 1, ) ( 1, )
L x y L x y x y
L x y L x y
θ = − + − −
+ − − (16)
Finally, the descriptor of the key points can be described by a 4 4 8 128× × = dimensional vector, where 4 4× stands for the size of window and 8 is the number of the directions of each window.
SIFT based feature matching is featured with the 128-dimensional key points. The process of SIFT based feature matching is that: i) we first calculate the Euclidean distances of the key points between two images. Second, we conduct the nearest neighbor searching to obtain the points required to be matched. Finally, we remove the false matching points by using the RANSAC.
3. Color Image Stitching
3.1 Homography
Calculation
According to the homogeneous coordinate, we describe the 2-D projective transformation based on the homography matrix multiplication. The homography matrix is described by
a 3 3× T matrix including 8 parameters, as shown in (17).
11 12 13
21 22 23
31 32 =
1
t t t
T t t t
t t
(17)
By assuming that m=( , ,1)x y and ' ' '
( , ,1)
m = x y are the
matching points between the images, we have
' 0
m T× × =m (18)
Based on (18), we can calculate the values of the parameters in T. After that, the relations of the coordinates of two images to be stitched together are obtained.
3.2 Image Fusion
To avoid the seam in the overlap regions after the image stitching, we conduct image fusion with respect to the stitched images. For simplicity, by ignoring the difference of brightness, we do
'
1 1
( , ) ( , ) (1 ) ( , )
I i j =dI i j + −d I i j (19)
where I i j1( , ) and I i j1'( , ) are the two stitched images. Obviously, when the value d changes slowly into 0, the two stitched images will achieve smooth transition.
4. Experimental Results
To examine the performance of the proposed approach, we select three groups of images for the testing. Fig.3 shows the first group of images taken in an outdoor scenario. Fig.4 shows the second group of images with noise pollution. Fig.5 shows the third group of images with image rotation.
Fig. 3 The 1st Group of Images
Fig. 4 The 2nd Group of Images
Fig. 5 The 3rd Group of Images
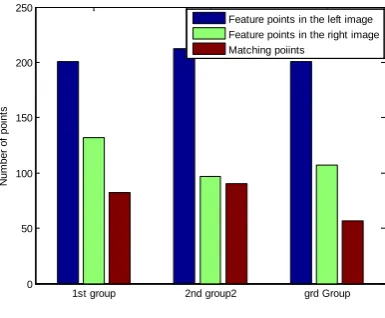
As the first step of image stitching, the performance of image matching is verified based on comparison of the number of feature points and matching points between the proposed approach and the conventional SIFT, as shown in Fig.6 and Fig.7.
1st group 2nd group2 grd Group
0 20 40 60 80 100 120
N
um
ber
of
poi
nt
s
Feature points in the left image Feature points in the right image Matching poiints
Fig.6 Performance of the conventional SIFT
1st group 2nd group2 grd Group
0 50 100 150 200 250
N
um
ber
of
poi
nt
s
Feature points in the left image Feature points in the right image Matching poiints
Fig. 7 Performance of the proposed approach
As can be seen from Fig.6 and Fig.7, we observe that the proposed approach performs better than the conventional SIFT in the aspects of feature points searching and matching.
After the image matching between the stitched images, the results of image stitching are shown below.
Fig. 9 Result of image stitching with respect to the 1st group of images
Fig. 10 Result of image stitching with respect to the 2nd group of images
Fig. 11 Result of image stitching with respect to the 3rd group of images
5. Conclusions
In this paper, we proposed a novel color image stitching approach by using the SIFT with 2-D maximum entropy threshold segmentation. The proposed approach performs well in both feature points matching and image stitching compared to the conventional SIFT without image segmentation. However, the image stitching with respect to multiple color images in different brightness conditions forms an interesting work in future.
6. Acknowledgment
This work was supported in part by the Program for Changjiang Scholars and Innovative Research Team in University (IRT1299), National Natural Science Foundation of China (61301126, 61471077), Special Fund of Chongqing Key Laboratory (CSTC), Fundamental and Frontier Research Project of Chongqing (cstc2013jcyjA40041, cstc2013jcyjA40032), Scientific and Technological Research Program of Chongqing Municipal Education Commission (KJ130528), Startup Foundation for Doctors of CQUPT (A2012-33), Science Foundation for Young Scientists of CQUPT (A2012-77), and Student Research Training Program of CQUPT (A2013-64).
References
[1]Zhu Qidan, Li Ke. Image Stitching Using Simplified SIFT.
International Conference on Information and Automation, 2010, 1134-1137.
[2]Szeliski R, Shum H.Y. “Creating full view panorama image
mosaics and environment maps”. Proceedings of 24th Annual
Conference on Computer Graphics and Interactive Techniques, 1997, 251-258.
[3]P. E. Anuta. Spatial registration of multispectral and
multitemporal digital imagery using fast fourier transfor techniques. IEEE Transactions on Geoscience Electronics. 1970; 8(4): 355-368.
[4]D. I. Barnea and H. F. Silverman. A class of algorithm for fast
digital registration. IEEE Transactions on Computers. 1972; 21(2): 179-186.
[5]A. Rosenfeld and A. C. Kak. Editors. Digital picture processing. New York: Academic Press. 1982.
[6]C. J. Harris and M. Stephens. A combined corner and edge
detector. proceedings of 4th Alvey Vision Conference. 1988:147-151.
[7]L. G. Brown. A survey of image registration techniques. ACM
Computing Surveys. 1992; 24(4):325-376.
[8]A. Collignon, F. Maes and D. Delaere. Automated multi-modality
image registration based on information theory. Information Processing in Medical Imaging.1995:263-274.
[9]P. A. Viola, W. M. Wells III. Alignment by maximization of
mutual information. Internation Journal of Computer Vision. 1997; 24(2):137-154.
[10] D. G. Lowe. Object recognition from local scale-invariant
features. International Conference on Computer Vision.1999:1150-1157.
[11] D. G. Lowe. Distinctive image features from scale-invariant
keypoints. Computer Vision. 2004; 60(2): 91-110.
[12] M. Amiri and H. R. Rabiee. RASIM: A novel rotation and scale
invariant matching of local image interest points. IEEE Transactions on Image Processing.2011; 20(12):3580-3591.