International Journal of Advanced Research in Computer Science
RESEARCH PAPER
Available Online at www.ijarcs.info
Optimal Placement of FACTS Devices to Improve Power Flow Using Bees Algorithm
Mugiira E.K
Department of Electrical and Electronics Engineering Machakos University
Machakos, Kenya
Ndolo A.O
Department of Electrical and Electronics Engineering Machakos University
Machakos, Kenya
Abstract— Flexible AC Transmission System (FACTS) device has gained popularity recently as an essential device in power systems. The introduction of FACTS technology in power systems has seen increased flexibility and control of power flow along the transmission lines. This paper focuses on three FACTS devices namely Static VAR Compensator (SVC), Thyristor Controlled Series Capacitor (TCSC) and Unified Power Flow Controller (UPFC). The devices will be optimally placed to simultaneously minimize system real power loss and maximize the inter-tie flow using Bee Algorithm (BA). BA is a simple and efficient heuristic search method based on the foraging behavior of honey bees searching for the best food source in a recently proposed multi objective optimization algorithm. The performance of presented BA algorithm is tested and verified on the IEEE 30-bus power systems. A Genetic Algorithm (GA) configured for the same purpose is used for evaluation. Results show the difference of performance of the devices used in this situation. The results achieved in this work illustrated that BA can successfully be used to solve the nonlinear problems related to power system optimization.
Keywords—Bee algorithm, Static VAR compensator, Thyristor Controlled series compensator,
I. INTRODUCTION
Electric utilities are forced to operate the grid system close to their thermal and stability limits due to major hurdles such as environmental, right-of-way and cost problems for power transmission network expansion [1]. The cost of transmission lines and losses, as well as difficulties encountered in building new transmission lines, would often limit the available transmission capacity. There are many cases where economic energy dispatch or reserve sharing is constrained by transmission capacity, and the situation is not getting better.
FACTS devices are being utilized to achieve many objectives in power system network. FACTS technology is being used to extend the capacity of existing power transmission networks to their limits without the necessity of adding new transmission networks [2] - [3]. This technology opens up new opportunities for controlling load flows, minimizing losses, damps the oscillations, increases the system stability and maintains bus voltages at optimal level in a power system.
These objectives are achieved by controlling one or more of the system parameters such as line impedance, bus voltage and phase angle with the optimal placement of appropriate FACTS devices in a power system network.
Various mathematical models and optimization techniques have been proposed in literature to maximize power transfer with and without FACTS devices. In [3], authors proposed continuation power flow (CPF) for determining system capability, but it requires effective and accurate parameterization of predictor, corrector and step length to obtain optimal solution. Repetitive power flow (RPF) method is used to determine inter-tie flow capability [4]. In [5], wide-area robust coordination approach of HVDC and FACTS controllers for damping multiple inter-area oscillations stabilizing in large-scale power systems is presented. Sensitivity based approach is proposed to
optimally locate FACTS devices to enhance total transfer capability [6]. Predictor, corrector, primal duel and interior point linear programming is used to enhance inter-tie flow using various FACTS devices [7]. In this work, authors did not optimize FACTS devices sizing and locations. Quadratic Programming based method is proposed to find total transfer capability incorporating the effect of reactive power in [8], but it requires the calculation of Hessian matrix for each iteration, making it complex and tedious. Many heuristic algorithms have been proposed in the literature to place the FACTS devices optimally. Simulated Annealing (SA) and Particle Swarm Optimization (PSO) techniques are used in [9] - [10] to minimize the transmission losses. Genetic algorithm (GA) based method is proposed in [11] for minimizing the loss. It requires external parameters such as cross over rate and mutation rate and the computational burden is high in this approach. Tabu search is proposed in [12]-[13] to place the FACTS devices. A recent proposed bee algorithm in [14] is used to simultaneously minimize the transmission loss and improve inter-tie flow by optimally placing and selecting the FACTS devices.
II. FACTS PLACEMENT STRATEGY
The problem formulation is based on repeated power flow with FACTS devices to evaluate the feasible inter-tie flow value. The objective function is to maximize the power that can be transferred from a specific set of generators in a source area to loads in a sink area subject to power system limit values and FACTS devices operation limits.
(UPFC). The mathematical models of the FACTS devices are used to perform the steady state studies.
TCSC is modeled to modify the reactance of the transmission line. The SVC can be used to control the reactive compensation of a system at nominal voltage of 1 p.u while the UPFC being the most versatile and powerful FACTS device is modeled to control line impedance, voltages angle and the terminal voltages simultaneously. The objective is to maximize inter-tie flow based on the function formulated below [15]. The objective function is dependent on the variables which represent the typical load flow equations and a set of the control variables representing the operating limit of FACTS devices and power system limits.
max
F x
( )
=
PD
i (1) Subject to the Equality power flow constraints:( )
(
,)
1 1
cos
0
N i N
i i Ui Uk Uk i j ij s
k j
ij i j
PG
PD
P V
φ
VV Y X
θ
= =−
+
−
− ∂ + ∂ =
∑
∑
(2) ( )(
,)
1 1sin
0
N i N
i i Ui Uk Uk Vi i j ij s
k j
ij i j
QG
QD
Q
V
φ
Q
VV Y X
θ
= =−
+
+
−
− ∂ + ∂ =
∑
∑
(3) Subject Power flow constraints limits:min
i
PG
≤PG
i ≤PG
imaxmin
i
QG
≤QG
i≤QG
imaxmin
i
V
≤V
i ≤V
imaxmin
s
X
≤X
s ≤X
smaxmin
Vi
Q
≤Q
Vi ≤Q
Vimax0
≤V
Ui ≤V
Uimaxmin max
i i i
P
P
P
φ
≤
φ
≤
φ
Ui
π φ
π
− ≤
≤
WhereF : Total load in sink area
i
PG
: Real power generation at busi
i
QG
: Reactive power generation at busi
.i
PD
:Real loads at busi
i
QD
: Reactive loads at busi
.(
,)
Ui Uk Uk
P V
φ
,Q V
Ui(
Uk Ukφ
)
: Injected real and reactive power of UPFC at busi
.min
i
V
,V
imax : Lower and upper limit of voltage magnitude at busi
Vi
Q
: Reactive power injected by SVC.i
V
,V
j: Voltage magnitude at busi
and busj
ij s
Y X
,θ
ij: Magnitude and angle of the element in bus,
Ui Ui
V
φ
: Voltage magnitude of UPFC at busi
and voltage angle of UPFC at busi
N: Number of lines.
III. MODELING FACTS DEVICES
In this paper, the steady state models of FACTS devices are developed for power flow studies. The models are implemented using Matpower [16].
A. Steady state model of TCSC.
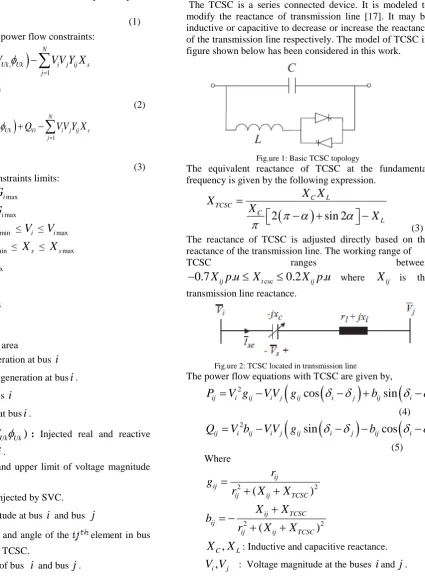
[image:2.595.129.555.205.784.2]The TCSC is a series connected device. It is modeled to modify the reactance of transmission line [17]. It may be inductive or capacitive to decrease or increase the reactance of the transmission line respectively. The model of TCSC in figure shown below has been considered in this work.
Fig.ure 1: Basic TCSC topology
The equivalent reactance of TCSC at the fundamental frequency is given by the following expression.
(
)
2
sin 2
C L TCSC C L
X X
X
X
X
π α
α
π
=
−
+
−
(3) The reactance of TCSC is adjusted directly based on the reactance of the transmission line. The working range of
TCSC ranges between
csc
0.7
X p u
ij.
X
t0.2
X p u
ij.
−
≤
≤
whereX
ij is thetransmission line reactance.
Fig.ure 2: TCSC located in transmission line
The power flow equations with TCSC are given by,
(
)
(
)
(
)
2
cos
sin
ij i ij i j ij i j ij i j
P
=
V g
−
VV
g
δ δ
−
+
b
δ δ
−
(4)
(
)
(
)
(
)
2
sin
cos
ij i ij i j ij i j ij i j
Q
=
V b
−
VV
g
δ δ
−
−
b
δ δ
−
(5) Where 2 2
(
)
ij ijij ij TCSC
r
g
r
X
X
=
+
+
2 2(
)
ij TCSC ijij ij TCSC
X
X
b
r
X
X
+
= −
,
ij ij
P Q
: Real and reactive power injections in line.,
ij ijr X
: Resistance and reactance of the lineconnected between the buses
i
andj
.,
ij ij
g b
: Conductance and susceptance of the lineconnected between buses
i
andj
.B. Steady state model of SVC.
The SVC is a shunt connected static var generator or absorber used to control the reactive compensation of a system at nominal voltage of 1 p.u.
i.e.
∆ =
Q
iQ
SVC [image:3.595.93.208.349.468.2]In this study, SVC is modeled as an ideal reactive power injectors or absorbers at bus i, where it is connected. The working range of SVC is chosen between -1Mvar p.u. and 1Mvar p.u. The SVC consists of a fixed capacitor and a thyristor controlled reactor (TCR) connected in parallel. SVC is connected in shunt with the bus.SVC is modeled as a reactive power source connected at the bus. In order to improve the total transfer capability and to minimize the transmission loss by using SVC, the model of the SVC as shown in figure below has been considered.
Fig.ure 3: Susceptance Model of SVC
In [18], the power flow equation with SVC is given by,
2
(sin(
)
cos(
)
sh i sh i sh i sh sh i sh
Q
= −
V b
−
VV
θ θ
−
−
b
θ θ
−
(6)
C. Steady State model of UPFC.
The steady state of UPFC in this paper is modeled as a combination of TCSC and SVC [19]. The UPFC is a device which can simultaneously control all three parameters of line (line impedance, voltage and phase angle). The model of UPFC in figure below has been considered in this work.
Figure 4: UPFC power injection model.
The power flow equations with UPFC are given by;
(
)
(
)
(
)
(
)
2
sin
cos
sin
cos
ij i ij i j ij ij ij ij
i se ij i se ij i se
P
V b
VV
g
b
VV
g
b
θ
θ
θ θ
θ θ
=
−
−
−
−
−
−
(7)
(
)
(
)
(
)
(
)
2
sin
cos
sin
cos
ij i ij i j ij ij ij ij
i se ij i se ij i se
Q
V b
VV
g
b
VV
g
b
θ
θ
θ θ
θ θ
=
−
−
−
−
−
−
(8)
IV. BEE ALGORITHM.
Swarm Intelligence is a form of Artificial Intelligence (AI) based on the collective behaviors of animals or certain phenomenon of natural systems such as ants, fish and birds. Some of its techniques such as Particle Swarm Optimization (PSO) and Ant technique have been successfully implemented to a wide range of optimization problems including those in power system operation and control. Recently, a novel swarm-based intelligence called the Bees Algorithm, which mimics the food foraging behavior of honey bees colony, has been developed by [20]-[23] and is considered to be as efficient as other swarm intelligence approaches.
A. Bee Algorithm application for FACTS devices location and selection.
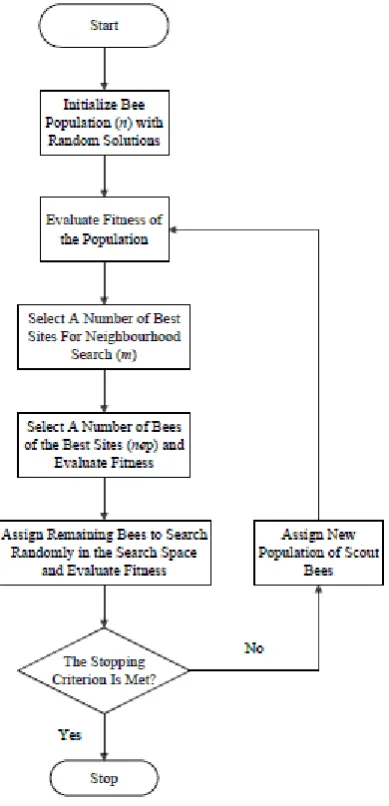
As mentioned earlier, the Bees Algorithm is one of the latest Swarm Intelligence techniques developed for solving various optimization problems. In order to apply the Bees Algorithm properly, a number of parameters are required to be set such as number of iterations (g), number of bees in the population (n), number of sites selected for neighborhood search (m), number of bees recruited for the selected sites (nep), and the stopping criterion. The remaining bees are assigned to search randomly in the search space in order to find more promising solutions [20]-[22].
[image:3.595.74.265.603.722.2]Figure 5: Bees Algorithm flow chart
After all parameters are initialized, the Bees Algorithm starts with placing scout bees randomly in the search space, the fitness values of those sites where the scout bees visited will be calculated. A number of sites that have high fitness values, along with a number of bees for these sites, will then be chosen for neighborhood search and fitness evaluation. In this paper, the Bees Algorithm was applied mainly for the optimal placement of FACTS to maximize inter-tie flow. Fig.6 demonstrates the flowchart of using the Bees Algorithm for solving the optimal placement problem. Initially, a number of scout bees were determined to search between maximum and minimum limits of the FACTS devices, the objective function according to equation (1) and (2) was evaluated and verified its convergence towards the optimal solution. The Bees Algorithm then updated its parameters to better values and these steps were repeated until reaching the optimal solution or the stopping point.
Figure 6: FACTS devices Optimization Flow Chart
The set parameters of BA such as the employed bee, worker bee, the trial limit and the maximum iteration limit are heuristically selected as 20, 20,100 and 500 respectively. The modified IEEE 30 bus test system is shown in appendix 1 is used to check the effectiveness of the proposed bee algorithm. Whose line and data can be found out from [24]. The system has six generators at buses 1, 2, 5, 8, 11, and 13 and four transformers with off-nominal tap ratio at lines 6– 9, 6–10, 4–12, and 28–27.
V. GENETIC ALGORITHM
[image:4.595.326.545.62.467.2]string (.i.e. chromosomes) with improved fitness is produced using genetic operators (i.e. selection, crossover and mutation). Useful practical details of genetic algorithms are available in [26] - [27].
VI. SIMULATION RESULTS AND DISCUSSIONS.
For inter-tie flow determination, TCSC, SVC and UPFC are employed separately first and in similar and different device combinations to enhance inter-tie flow.
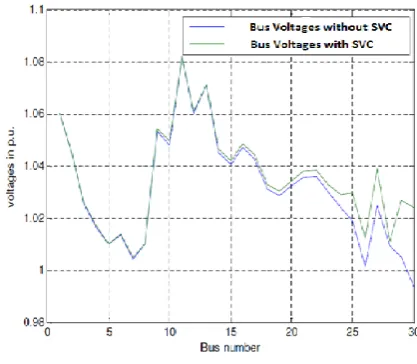
The optimal placement of FACTS devices are obtained from BA and GA. The system was tested under two FACTS devices installation scenarios: single type and multi-type of FACTS devices. For each case, a total of five FACTS devices were installed in order to enhance the transferred power from source area to sink area. The location, setting and type of FACTS devices are obtained using GA and BA .Inter-tie flow value at the base case without employing FACTS device is determined .Determination is further done by employing FACTS devices in single and multi-type device combinations. Table 1 shows the results. The limiting lines are obtained for this analysis and the order of limiting lines is lines. In the multi-type, similar devices combination are placed in the first limiting lines. For the UPFC, the placement of TCSC and SVC simultaneously is done. In the single device type, UPFC is providing maximum enhancement of inter-tie flow. Considering similar and different device combinations, two UPFCs are providing maximum inter-tie flow. Voltage magnitudes of critical buses are fixed to 1 p.u by converging to the best susceptance values of SVC devices as indicated in figure 7. The results show the effectiveness of the new approach in optimizing the FACTS placement in terms of more optimal solution. In the case of multi-type FACTS devices, the type of device to be placed is also considered as a parameter in the optimization. The results show that simultaneous use of several types of FACTS devices is the most efficient method to increase the inter-tie flow.
Table I Inter-Tie Flow Results. No
FACTS (MW)
FACTS device(s)
Inter-tie flow with FACT S (MW)
Settings and placement
TCS C
(Xp u. )
SVC (Mvar )
UPFC TCS C
(Xp u. )
SVC (Mva r)
51.0
SVC BA 50.9 -1
(28)
GA 51.0 0.098
(24)
TCSC BA 52.1 0.2
(6-28)
GA 51.0 0.23
(2-5)
UPFC BA 52.2 0.2
(6-28)
-0.5 (28)
GA 51.5 0.23
(2-5) 0.098
(24) SVC
TCSC UPFC
BA 54.6 0.2
(6-28)
-1 (6)
0.2 (6-8)
-0.5 ( 8)
GA 52.1 0.23 0.098
(2-5) (24)
The selection of types and location of FACTS devices for inter-tie flow enhancement depends on the violation of the system elements. For the case of bus voltage violation, it is understood that SVC is always the best choice and it is installed at the bus where violation occur. Besides, FACTS technology can also improve the voltage profile at the buses which are near to where it is installed.BA presents several optimal locations and more optimal solutions compared to GA
[image:5.595.364.573.191.373.2]VII.
Fig.7: Voltage profile chart for BA algorithm.
This results show that installation of multi-type FACTS devices can lead to improvement in voltage stability index and reduction in power system losses simultaneously. So multi-type FACTS devices should be placed in optimal location to both improve stability margins and reduce losses in the network.
VIII. CONCLUSION.
This paper introduces a novel and recently proposed method to find the optimal placement of FACTS devices for inter-tie flow enhancement for single type and multi-type FACTS devices. The results of execution of these scenarios on a typical 30-bus test system were clarified robustness of this method in optimal and simultaneous placement of FACTS devices compared to GA. The results showed efficiency of this method for improvement of voltage profile, reduction of power losses and also an increase in power transfer capacity and voltage stability margin.BA proves to be superior compared to GA in terms of optimizing FACTs devices optimization.
APPENDIX.
IX. REFERENCES
[1]. S.N. Singh, “Location of FACTS Devices for Enhancing Power Systems’ Security”, 2001, IEEE. [2]. Hingorani G.H, “Flexible AC Transmission System”,
IEEE Spectrum, 1993.
[3]. Hingorani G.H and L.Gyugyi, “Understanding FACTS Concept and Technology of Flexible AC Transmission
Systems”, IEEE Press, 2000.ISBN 0-7803-3455-8.
[4]. D.J. Gotham and G.T. Heydt, “Power Flow Control and Power Flow Studies for System with FACTS Devices”, IEEE Transaction on Power Syst., Vol. 13, No. 1, 1998. [5]. Yong Li,Christian Rehtanz, Sven Rüberg, Longfu Luo,
and Yijia Cao,"Wide-Area Robust Coordination Approach of HVDC and FACTS Controllers for Damping MultipleInterarea Oscillations,"IEEE Transactions On Power Delivery, Vol. 27, No. 3, July 2012.
[6]. G.H. Hingorani, “Flexible AC Transmission System”, IEEE Spectrum, 1993.
[7]. S. Gerbex, R. Cherkaoui and A.J. Germond, “Optimal Location of Multi-Type FACTS Devices in a Power System by Means of Genetic Algorithm”, IEEE Transaction on Power System, Vol. 16, August 2001. [8]. S. N. Singh and A. K. David, “Congestion management
by optimizing facts device location. In Electric Utility Deregulation and Restructuring and Power Technologies”, 2000. Proceedings. DRPT 2000. International Conference on, pages 22–28.
[9]. H. Mori and Y. Maeda, “A hybrid method of EPSO and TS for facts optimal allocation in power Systems”. In Systems, Man and Cybernetics, 2006. SMC ’06. IEEE International Conference.
[10]. L.J. Cai and I. Erlich, “Optimal Choice and Allocation of FACTS Devices using Genetic Algorithms”, IEEE Transaction on Power System, 2002.
[11]. K. Radha Rani, J. Amarnath and S. Kamakshaiah ,“Allocation Of FACTS Devices For ATC EnhancementUsing Genetic Algorithm”, ARPN Journal
of Engineering and Applied Sciences, Vol. 6, No. 2, February 2011.
[12]. A. Baykasoglu, L. Ozbakır, and P. Tapkan, “Swarm Intelligence: Focus on Ant and Particle Swarm Optimization”, 2007.
[13]. A.Baykasoglu, Goal Programming using the Multiple Objective Tabu Search, Journal of
Operational Research Society, 52(12), 1359-1369,
2001.
[14]. D .T. Pham, A. Ghanbarzadeh, E. Koc, S .Otri, S .Rahim and M. Zaidi, “ The Bees Algorithm, A Novel Tool for Complex Optimization problems”. Proc 2nd Int. Virtual Conf on Intelligent Production Machines and Systems (IPROMS 2006) Oxford: Elsevier 454-459 [15]. S. N. Singh and A. K. David, “Congestion
management by optimizing facts device location. In Electric Utility Deregulation and Restructuring and Power Technologies”, 2000. Proceedings.DRPT 2000. International Conference on, pages 22–28.
[16]. S. Gerbex, R. Cherkaoui, and A. J. Germond, “Optimal location of multi-type facts devices in a power system by means of genetic algorithms”. Power Systems, IEEE Transactions on, 16(3):537–544, 2001. [17]. R.D. Zimmermann and D.Gan, “Matpower a
Matlab power system simulation package, User’s
Manual”
[18]. G.B. Shrestha, and F. Wang, “Effects of series compensation on spot price power markets”, Int. J. Elec. Power Energy Syst., 27(5-6): 428-436,2005. [19]. Xia, Y., Y.H. Song and Y.Z. Sun, “Power flow
control approach to power systems with embedded FACTS devices”, IEEE T. Power Syst. Res. 17(4): 943-950, 2002.
[20]. S.C. Srivastava, and P. Kumar, “Optimal power dispatch in deregulated market considering congestion management”, Proceeding of International Conference on Electric Utility Deregulation and Restructuring and Power Technologies, pp: 53-59, 2002.
[21]. N.Karaboga, “A New design method based on artificial bee colony algorithm for digital IIR filters”, Journal of the Franklin Institute 346, pp328-348, 2009. [22]. D .T. Pham, A. Ghanbarzadeh, E. Koc, S .Otri, S
.Rahim and M. Zaidi, “ The Bees Algorithm, A Novel Tool for Complex Optimization problems”. Proc 2nd Int. Virtual Conf on Intelligent Production Machines and Systems (IPROMS 2006) Oxford: Elsevier 454-459 [23]. K. O. Jones, A. Bouffet, “Comparisons of Bees
Algorithm, Ant Colony Optimisation and Particle Swarm Optimisation for PID Controller Tuning”, International Conference on Computer Systems and Technologies, pp. 1-6 2008.
[24]. The 1996 version of the Reliability Test System was published in Grigg, C., "The IEEE reliability test system: 1996", Paper 96 WM 326-9 PWRS, IEEE Winter power meeting 1996.
[25]. J. H. Holland, Adaptation in Natural and Artificial Systems. Ann Arbor,MI: University of Michigan Press, 1975
![Fig.ure 3: Susceptance Model of SVC In [18], the power flow equation with SVC is given by,](https://thumb-us.123doks.com/thumbv2/123dok_us/692963.1076853/3.595.74.265.603.722/fig-susceptance-model-svc-power-flow-equation-given.webp)