A B S T R A C T
CARROLL, RODNEY L. Study on the Effective Use of Video Compared to Traditional Text and Static Graphics for Instructing Spatial Tasks (Under the direction of Dr. Eric Wiebe, Dr. William Deluca, and Charles Joyner).
The purpose of the study was to compare two forms of instruction, static (illustration and text annotation) and dynamic (video with audio annotation), for instructing special tasks. With the advent of new technologies the Internet has become a place of sharing of ideas, communication, conducting business, research, entertainment, and education. Today students are exposed to many types of instruction including text, text and graphics, and electronic media. Distance Education is on the rise and the technology that enables it is becoming more advanced. By comparing static and dynamic instruction for, this study will help shed light on which medium is better for instructing spatial tasks.
This study consisted of 24 male and female students at a technical college during the Spring 2003 quarter. They were randomly placed into a static instruction or dynamic
B I O G R A P H Y
Lee Carroll was born on June 3, 1976 in Edgecomb County, North Carolina. Lee attended Tarboro City Public Schools and graduated from Tarboro High School in 1995. While attending Tarboro High School, Lee was a Wrestling State Runner-Up and a State Champion. During his State Champion season, he compiled a record of 50-0, setting a state record for the most wins in a single season.
After high school, Lee went on to wrestle for North Carolina State University. During his collegiate career, Lee was an ACC Runner-Up and was a three time national qualifier. In 2000, Lee graduated with a Degree in Technology Education with a Minor in Graphic Communications.
A C K N O W L E D G E M E N T S
The writer would like to thank his committee for their comments, support, and
T A B L E O F C O N T E N T S
LIST OF TABLES ………...….…... vi
LIST OF FIGURES ……….…… vii
INTRODUCTION TO THE STUDY ………... 1
Introduction ..………. 1
Research Questions ………... 3
Hypothesis ………. 4
Limitations of Study ……….. 4
Definitions ………. 5
REVIEW OF LITERATURE ……… 6
Introduction ……… 6
Competition ……… 6
Potential for Distance Education in Technical Areas ……… 7
Potential for multimedia in Science, Math and Technology Education ………….. 10
Definitions of Media Elements ……… 11
Spatial Visualization ……… 13
Conclusion ………... 16
METHODOLOGY ……….. 18
Intruduction ...………. 18
Participants and Design ……….. 19
Materials ………. 20
FINDINGS ...……….. 25
Introduction ...………. 25
Population Demographics ...……… 25
Determining Outliers ...……… 26
Testing of Analysis of Covariance (ANCOVA) ...……….. 27
Testing of the Hypothesis ...………. 29
SUMMARY, CONCLUSIONS, AND RECOMMENDATIONS ...……….. 37
Introduction ...……….. 37
Summary ...……….. 36
Discussion of the Findings ...……….. 39
Conclusion ...……… 40
Recommendations ...……… 41
LIST OF REFERENCES ...………. 42
Appendix A. Student Information Sheet ...………. 47
Appendix B. Origami Exercises ...……….. 49
LIST OF TABLES
Table 4.1: Mean Estimates (Age) ……… 27
Table 4.2: Task 1 Time ……… 27
Table 4.3: Task 2 Time ……… 28
Table 4.4: Task 3 Time ……… 28
Table 4.5: Analysis of Covariance (Paper Test - Time) ………..……… 29
Table 4.6: Analysis of Covariance (Paper Test - Error) ………..…… 30
Table 4.7: Analysis of Variance (Time) ………..… 31
Table 4.8: Analysis of Variance (Errors) ……… 32
Table 4.9: Kruskal-Wallis non-parametric test (number of steps remembered) .………… 33
Table 4.10: Overall reactions to the instruction (terrible to wonderful) .……… 34
Table 4.11: Overall reactions to the instruction (frustrating to satisfying) .……… 34
Table 4.12: Overall reactions to the instruction (dull to stimulating) .……… 35
Table 4.13: Overall reactions to the instruction (difficult to easy) .……… 35
LIST OF FIGURES
Figure 2.1: Average Fixed Charges for Undergraduates ……… 7
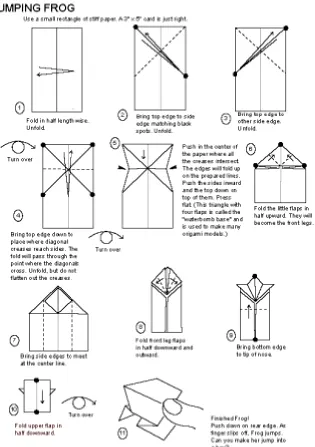
Figure 3.1: Jumping Frog ….……… 22
Figure 4.1: Time Mean Plots ………...……… 31
Figure 4.2: Error Mean Plots ……...……… 32
Figure 4.3: Mean Number of Steps Remembered ………….………..……… 33
C H A P T E R 1
I N T R O D U C T I O N T O T H E S T U D Y I n t r o d u c t i o n
Over the past decade education has become more technology based with the development of computer-based learning (CBL). CBLs have transformed the way education is delivered and has created a new area in which multimedia is becoming more extensively used to deliver information. With the power of the Internet, students can now receive their education anywhere and anytime. According to Serdiukov (2001), over the last four or five years about 70% of the U.S. universities and colleges have begun offering distance courses outside of their traditional in-class courses. Although a big part of these nontraditional online courses are made up of extensive web pages filled with text and graphics, some universities have now begun to stream video across the Internet to broadcast lectures to thousands of students. According to Naisbitt (1994), “multimedia will become a dominant force in the next decade and the two most significant applications will consist of entertainment and education”.
One area in education that is making use of multimedia is in mathematics, science and technology education. Courses, both online and in class, have replaced lengthy instruction manuals with video to instruct students on how to assemble probes, use equipment properly, and conduct experiments. Video instruction allows students to see and interact with elements of math, science and technology that would otherwise be too dangerous, expensive or
information consistently. Compared to lecture methods, every student will receive the same content in the same style of delivery eliminating instructor differences in interpretation, style, or emphasis of the course (Minoli, 1996, p. 292).
One example where video is used in the classroom is in a Transportation class offered through the Technology Education Degree at North Carolina State University. One module in the class requires students to learn about flight. While learning about aerial flight, students are required to view a video simulation on how air is disturbed around an airfoil to create lift. Without this visual representation, students would not be able to see or visualize the airflow around the foil. The students then conduct an experiment on different types of airfoils instructed via video instruction. Through video instruction, students in the Transportation class are able learn about airfoils and how they achieve aerial flight.
Instructional videos require students to use spatial visualization skills to assemble and manipulate physical objects to conduct experiments and skill-based activities. “Spatial visualization is defined as the ability to solve multi-step problems involving configurations of shapes, primarily using mental imagery or other mental representations and transformations of same which explicitly preserve the topological and geometric relations of the problem, while optionally involving additional logical, verbal and symbolic reasoning” (Smith, 2001). In science and technology education, illustrations, graphics, animation, and video all
communicate visual information. In many cases the visual information that is communicated is intended to instruct a student to do something spatial in nature.
There is limited evidence suggesting that some media are better than others at
"chunks" of text. Long sentences and passages place a great demand on the working memory which is limited to about five to nine independent items or "chunks" (Wickens & Carswell, 1997). According to Najjar, learners who read screen after screen of text concerning spatial topics or who receive only simple “right” and “wrong” feedback to their responses are unlikely to learn. For recalling, recognizing items, and communicating spatial information Najjar states that pictures are better than text. Pictures have more information available for processing than text alone allowing the learner to access meaning more quickly and
completely than words, hence the phrase: A picture is worth a thousand words. From this, the conclusion could be reached that spatial information should be communicated using a spatial medium rather than a verbal or textual medium. Universities are already offering online courses, but are highly saturated with plain text and are poorly designed to communicate information effectively, especially spatial information. It is likely that if courses intending to communicate spatial information use video instead of traditional text and static graphics, the spatial information would be communicated in a way that improves student’s spatial
cognition, saves time, better comprehended, and more consistent.
Research Questions:
1. Will students complete video-based exercise in less time than using traditional static text and graphics?
2. Will there be a difference in the frequency of errors between students viewing an instructional video compared to reading instructions for completing a spatial task? 3. Do students retain more information with video instruction than text and static
4. Will students show a preference for video-based instruction over traditional text and static graphics based instruction?
Hypothesis
1. Students will complete video-based exercises in less time than using traditional static text and graphics.
2. There will be a lower frequency of errors for students viewing an instructional video compared to reading instructions for completing a spatial task.
3. Students will retain more information with video instruction than text and static graphics based instruction.
4. Students will indicate a preference for video instruction over traditional text and static graphics.
Limitations of Study:
1. Subjects to be tested will come from the School of Communication Arts Digital Media classes composed of freshmen, sophomores, juniors, and seniors in college. 2. Subjects will be tested doing only a few discrete tasks.
3. Knowledge retention will not be measured at multiple times spanning a long time period. (i.e. 1-2 years)
Definitions:
Animation - The creation of artificial moving images.
CBL - Computer Based Learning
Multimedia - sequential or simultaneous use of a variety of media formats, such as audio,
video, static graphics, text, or animations.
Rendering - The conversion of a high-level object-based description into a graphical image for display.
Solid Modeling – Solid modeling a process of creating a full 3-D representation of an object with a computer database.
Spatial Abilities - The perceptual and cognitive abilities that enable a person to deal with spatial relations, in other words the visualisation and orientation of objects in space. (http://www.intelligencetest.com/any.html)
Spatial Cognition – Spatial cognition is information processing as applied to space and spatial relations. (http://www.cs.nott.ac.uk/~geb/IHF-L8.pdf.)
Spatial Visualization - the ability to solve multi-step problems involving configurations of shapes, primarily using mental imagery or other mental representations and transformations of same which explicitly preserve the topological and geometric relations of the problem, while optionally involving additional logical, verbal and symbolic reasoning.
Working Memory - Working memory is conceptualized as an active system for temporarily storing and manipulating information needed in the execution of complex cognitive
CHAPTER 2
REVIEW OF LITERATURE Introduction
Multimedia will become a dominant force in the next decade and the two most significant applications will consist of entertainment and education (Naisbitt 1994). For example, the number of distance education courses, degree programs, and enrollment in the US nearly doubled from 1995 to 1998 (Flowers, 2001). “The technology needed by
companies and their employees is changing so fast that the American Society of Training and Development estimates 75% of the U.S. work force will need retraining in the next few years to keep pace with market demands and increasingly global competition” (Eberts, 2000).
Competition
With increasing enrollments and higher demands on education, colleges and universities are being pressured to provide a higher quality education to a larger market of students. If universities follow the traditional approach in delivering education, they must continue to incur the cost of building new campuses and maintaining existing ones, thus causing the cost of education to increase (Minoli, 1996, p7).
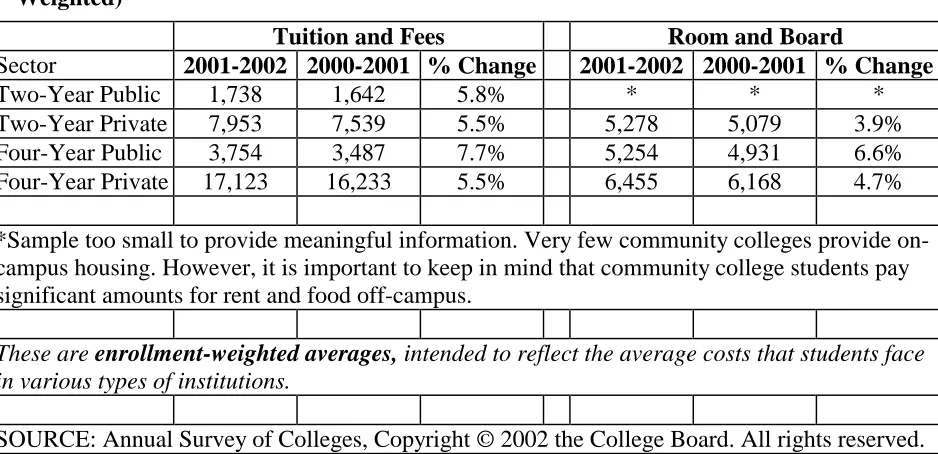
Students can also expect to face charges of between 3.9 and 6.6 percent more for room and board (see Exhibit 1). Trends in College Pricing 2001 is based on data collected in the College Board's Annual Survey of Colleges, 2001-2002.
Figure 2.1: Average Fixed Charges for Undergraduates, 2001-2002 (Enrollment-Weighted)
Tuition and Fees Room and Board
Sector 2001-2002 2000-2001 % Change 2001-2002 2000-2001 % Change
Two-Year Public 1,738 1,642 5.8% * * *
Two-Year Private 7,953 7,539 5.5% 5,278 5,079 3.9%
Four-Year Public 3,754 3,487 7.7% 5,254 4,931 6.6%
Four-Year Private 17,123 16,233 5.5% 6,455 6,168 4.7%
*Sample too small to provide meaningful information. Very few community colleges provide on-campus housing. However, it is important to keep in mind that community college students pay significant amounts for rent and food off-campus.
These are enrollment-weighted averages, intended to reflect the average costs that students face in various types of institutions.
SOURCE: Annual Survey of Colleges, Copyright © 2002 the College Board. All rights reserved.
Potential for Distance Education in Technical Areas
With college enrollments and tuition on the rise, many universities have sought cheaper alternative methods for delivering course content in order to keep costs down. Outside of their traditional in-class courses, about 70% of the U.S. universities and colleges have begun offering distance courses over the last four or five years (Serdiukov, 2001).
923 respondents noted that they personally used the Internet to learn about some aspect of technology. Two questions asked respondents for their general opinion about the need for online technology education. The first question in this area asked: "How much of a need do you think there is for online education in technology education (above the high school level)? The mean response to this item was 3.81 (1 representing "no need" to 5 representing "great need”). Sixty-three percent chose the top two levels, 30% chose "great need," whereas only 1% chose "no need."
Although respondents had an overall positive feeling toward online courses, there were some drawbacks noted. Respondent’s expressed concerns about low interaction ("No interaction with instructor/classmates"); low quality ("Quality is near zero."); time, work, and cost requirements ("Cost / time"); personal characteristics ("Motivation"); computer concerns ("Not being totally comfortable with using the Internet"); ignorance and fear ("Unsure of what it is all about"); and availability ("Finding one to take.") (Flowers, 2001).
From the assessment survey, Flowers (2001) concluded that there is a perceived need for online education. Respondents showed interest in courses and workshops covering activities to teach about technology, new and emerging technologies, technology education curriculum, and using the Internet to teach about technology. Great interest was expressed for “information and communication” and for “technological design” and may meet a greater need than other areas creating a greater yield in enrollments (Flowers, 2001).
matter who we are, where we live, or what we do, we will be required to be continuously educated” (Bersch, 1999).
Flowers’ (2001) needs assessment survey of educational opportunities in technology education, found that there was a potential need for distance education from current
professional and student members of the International Technology Education Association (ITEA). What about those that have graduated and joined the workforce before the arrival of computers and high-tech telecommunications and need retraining? Will they have a potential need for education? The answer is most likely yes.
“The technology needed by companies and their employees is changing so fast that the American Society of Training and Development estimates 75% of the U.S. work force will need retraining in the next few years to keep pace with market demands and increasingly global competition” (Eberts, 2000). Those that will need retraining will be a new type of student. This new type of student is nontraditional and very different from the typical 18-year-old college freshmen. These new students maybe adults, employed, in charge of families, homebound, travel-prone, variously prepared or unprepared for advanced study (Jones, 2000).
Many just can’t be on campus or study full time. As you can imagine, being an adult and a veteran of the workforce, a classroom full of younger students less experienced in life can be pretty daunting to this new type of student (Jones, 2000). Distance education suits the new student and will provide a means of reeducation and life long learning.
interest in courses and workshops covering activities to teach about technology, new and emerging technologies, technology education curriculum, and using the Internet to teach about technology.
Potential for multimedia in Science, Math and Technology Education
One area in which these types of courses are currently offered is through math, science, and technology education. Both online and in-class courses in math, science, and technology education utilize multimedia to deliver instructional material. In-class courses utilize a combination of: CBLs, lecture, textbooks, and some form of multimedia, i.e.
PowerPoint slides, online materials, or video. Most online courses offered utilize text similar to a textbook or class notes while more advanced courses deliver course material through streaming video, computer interaction, or computer animation (Eberts, 2000).
Some of these courses, both online and in class, have replaced lengthy instruction manuals with video to instruct students on how to assemble probes, use equipment properly, and conduct experiments. Without the aid of video instruction several elements of math, science and technology education would be too dangerous, expensive, and impossible to experience first hand.
instruction delivers information consistently (Minoli, 1996). Every student will receive the same content in the same style of delivery eliminating instructor differences in interpretation, style, or emphasis of the course.
Video is a visual medium and has the ability to hold student interest while illustrating difficult concepts, clarify information, accelerate learning, improve comprehension, increase recognition, and reduce errors (Minoli, 1996, p. 292). Role simulations, process flows, and subject demonstrations are facilitated through the motion element of video.
Definitions of Media Elements
Research has shown that some media are better than others at communicating certain kinds of information (Najjar, 1998). Text, static graphics, animation, and video are all capable of instructing spatial information to some degree, but which medium is more
effective? To help determine which medium that will likely communicate spatial information more effectively, knowledge of how information is communicated needs to be addressed.
An instance where conflicting studies occur is in the retrieval of information from memory. One study indicated that text appears to be better than sound for communicating verbal information for retaining information over longer periods of time (Najjar, 1998). This was supported when text was found to be superior to sound when the verbal information was a list of words (Severin, 1967), instructions (Sewell & Moore, 1980), four line poems
(Menne & Menne, 1972), and nonsense syllables (Chan, Travers, &Van Mondfrans, 1965; Van Mondfrans & Travers, 1964). It is likely that the reason text is better than sound for communicating verbal information for longer retention is that the learner can visualize the words and characters in his or her working memory.
Another study indicated that information that is similar, such as verbal or textual material, is difficult to differentiate and retrieve from memory (Eberts, 2000). Research has shown that learners cannot retain large quantities of text, rather retain individual "chunks" of text (Wickens & Carswell, 1997, p. 106). Long sentences and passages place a great demand on the working memory, which is limited to retain about five to nine independent items or “chunks”. Learners cannot hold large quantities of text in their heads, no matter how important the information is (Soulier, 1988, p. 190).
For recalling, recognizing items, and communicating spatial information, Najjar (1998) states that pictures are better than text. Pictures have more information available for
processing than text alone allowing the learner to access meaning more quickly and completely than words, hence the phrase: A picture is worth a thousand words.
Spatial Visualization
According to Najjar (1998), pictures effectively communicate spatial information, but how does one decipher spatial information? The answer is through spatial visualization. The term “spatial visualization” has been combined into broader terms of “visualization” and “spatial ability” (Braukmann, 1991). The term “spatial ability” has many definitions, which makes it difficult to be definitive about its precise meaning (Eliot, 1983). According to Roger and Strong (2002), two main factors that consistently emerge from within the visualization discipline are spatial orientation and spatial visualization. Spatial orientation can be defined as, “The comprehension of the arrangement of elements within a visual stimulus pattern and the aptitude to remain unconfused by the changing orientation in which a spatial
configuration may be presented” (McGee, 1979, p. 893). For example, in a wrestling match, even though a wrestler may end up in various awkward positions, he knows where he his relative to his opponent; a gymnast knows where the ground is during their maneuvers.
object in an imaginary 3-D space and create a representation or the object from a new
viewpoint” (Roger & Strong, 2002). For example, one can sketch or visualize the front, back, and side of their car. They can also imagine what the top or bottom may look like.
Spatial orientation and spatial visualization require some use of short-term visual
memory (Roger & Strong, 2002). Mental manipulation of configurations of two-dimensional space is associated with spatial orientation while serial operations such as rotation in three-dimensional space is associated with spatial visualization (Roger and Strong, 2002).
Spatial visualization is an important factor in student success in a variety of spatial domains such as geometry, other higher forms of mathematics, chemistry, and physics (Smith, 2001). In math, science and technology education, spatial visualization is needed to interpret visual information depicted through illustrations, graphics, animation, and video. In many cases the visual information that is communicated is intended to instruct a student to do something spatial. By its very nature spatial visualization is non-verbal and is accepted as a valid psychological construct.
One aspect that has repeatedly made a statistically significant correlation to spatial abilities is gender. Deno (1995), conducted a study of 396 beginning engineering students that examined the effects of previous design and mechanical experience on the basis of spatial visualization ability. Male students that were highly involved in non-academic activities such as model building, sketching, and assembly of parts during high school years scored high on spatial visualization tests. Among females, this correlation was not
statistically significant. According to Deno (1995), actively playing video games was the only activity for high school-aged women that significantly improved their spatial ability skills. Boys who had played with Lincoln Logs and Lego type toys in preschool and elementary school also scored significantly higher on spatial visualization tests. Girls had similar results from activities that were more visual, such as educational TV, during this same period. Further evidence that spatial ability differences exist between the sexes has also been found by Eisenburg and McGinty (1977), but depended on the students’ field of study. They concluded that women might be two to three times more likely to lag behind males in 3D spatial skills.
If spatial visualization is an important factor in a students’ success in a spatial domains such as geometry, higher forms of mathematics, chemistry, then how can a student with poor spatial visualization skills succeed in math, science and technology education. How can these students’ spatial visualization skills be improved?
Studies have claimed spatial visualization skills cannot effectively be taught through typical instructional methods (Salkind, 1976), while others have found that spatial
appropriate and the delivery time sufficiently long (Sexton, 1992). A second study indicated that it was possible to significantly improve spatial visualization skills during just eighteen hours of engineering graphics instruction (Braukman, 1991). The question of whether spatial visualization can be taught remains unanswered.
One possible instructional medium that may help improve spatial visualization skills is through video instruction. Deno (1995) found that of the female students in his study that had viewed educational TV in preschool an elementary school and actively played video games during high school scored well on spatial visualization tests.
Conclusion
One possible instructional medium that may help improve spatial visualization skills is through video instruction. Deno (1995) found that of the female students in his study that had viewed educational TV in preschool an elementary school and actively played video games during high school scored well on spatial visualization tests. As stated earlier; video, in whatever form it may be delivered in, brings the advantages of compression, consistency, and visualization to the learning process (Minoli, 1996).
Video is a visual medium and has the ability to hold student interest while illustrating difficult concepts, clarify information, accelerate learning, improve comprehension, increase recognition, and reduce errors (Minoli, 1996). Role simulations, process flows, and subject demonstrations are facilitated through the motion element of video.
From this, the conclusion could be reached that spatial information should be
CHAPTER 3
METHODOLOGY
Introduction
This study examined the effective use of video compared to traditional text and static graphics for providing instruction on a spatial task. One must use their spatial abilities to complete a spatial task. According to Scali and Brownlow (2000), spatial ability has three components: spatial visualization, spatial perception, and mental rotation. Spatial
visualization involves the multi-step perceptual manipulation of complex spatial information in space (Smith, 2001). Spatial perception involves making judgments of horizontal and vertical orientation in space despite distracting background information (Halpern, 1986). Mental rotation is the ability to imagine the transformation of a multidimensional figure (two or three dimensions) (Linn & Peterson, 1985).
In search of a testing medium that combines the use of spatial visualization, spatial perception and mental rotation skills to complete a spatial task, the researcher decided to use origami; the art of paper folding. Origami is a form of visual / sculptural representation that is defined primarily by the folding of the medium (usually paper) (Wu, 1997).
One other reason the researcher chose origami, as a testing medium is to avoid gender bias. Experience with spatial tasks is positively related to spatial task performance and the experiences that provide such practice are more common for boys (Scali & Brownlow, 2002). Activities using Lego Tech (TM) modules in Technology Education are very close in
relation to Legos (TM). Children learn how to construct and assemble Legos (TM) and similar
activities are comprised of modular components and assemble very similar to Legos (TM). If
this experiment were to use a testing medium for spatial task similar to the Lego Tech (TM),
individuals with previous experience would have an unfair advantage over those with no previous experience due to having prior knowledge in assembling similar types of components.
Maximum effect of instructional differences will be seen with novices. If subjects have prior experience with the spatial task, it would be less likely to see a difference that one method of instruction would be better than the other. Origami is less widespread and less intuitive. The likelihood that either males or females have prior experience in paper folding is low.
Participants and Design
Subjects with no assumed prior origami experience and who were enrolled in Digital Media at the School of Communication Arts during the 2003 Spring were recruited and randomly grouped into two groups of twelve. Group one was the control group and was tested with the traditional text and static graphics medium. Group two was the experimental group and was tested through the audiovisual medium.
and the experimental group was instructed via video (dynamic instruction). Accuracy (Error), time for completion, and preference were the response measures.
Prior to conducting the experiment, subjects were asked if they had experience in origami. Students that had little to no experience were candidates for the experiment and given the Paper-Folding Test VZ-2 from the Kit of Factor-Referenced Cognitive Tests (Ekstrom, French, Harman, & Dermen, 1976). The paper-folding test score was used as a covariate. The test measures one aspect of a subject’s spatial visualization abilities. This factor encompasses one’s ability to mentally manipulate through deformation of a 3D object in 3D space.
Materials
Students were given a seven-question questionnaire to determine who was eligible to participate in this study. The questionnaire asked students their age, gender, academic status, ethnicity, number of graphic design courses taken, level of experience with graphic design, and level or experience with origami (Appendix A).
The Paper-Folding Test VZ-2 from the Kit of Factor-Referenced Cognitive Tests (Ekstrom, French, Harman, & Dermen, 1976) was used to determine a subject's spatial visualization ability. The test is a two-part test with 10 questions in each section (total of 20). Students were allowed six minutes to complete the test. Each question contained five
An instruction sheet explaining the types of folds and symbols was given to the subjects (See Appendix B). The instruction sheet consists of descriptions of the various folds and symbols that are commonly used for instructing origami. Students in both groups were able to view and refer to these instructions throughout the experiment. Both forms of instruction used the same nomenclature when instructing the subject to complete a fold. For example, when a subject is instructed to make a "mountain" fold, both groups will know that they are being instructed to fold the paper so that the crease pokes up.
The subjects were given three paper folding exercises, ranging from easiest to hardest. The number and complexity of the folds utilized to complete the model was used to distinguish between beginner and advanced origami models. Almost all origami consists of various combinations of mountain and valley folds (Wu, 1997). A mountain fold is when a piece of paper is folded and the crease pokes up. A valley fold is simply the inverse of a mountain fold. Often, in an origami model, mountain and valley folds tend to come in groups of three or four creases. These groups are called combination folds (Wu, 1997). As the number and complexity of combination folds increase, so does the degree of skill and
complexity of the model. Therefore origami models with relatively simple combination folds consisting of a few number of mountain and valley folds are considered beginner level models. The models used in this experiment will use mainly mountain and valley folds, with more advanced combination folds, as the modules get harder.
object resembling a frog. The third and most complex exercise was considered to be intermediate. It consists of 15 folds to create an object resembling a bird.
There were two sets of instructional delivery; paper based (static instruction) and video based (dynamic instruction). The paper based set of instructions (static instructions) was composed of text and static graphics (see Fig 3.1).
The video based instruction utilized both a dynamic visual and audio component of a person demonstrating the paper-folding exercises. The visual portion of the video only showed the hands of the instructor and materials needed to complete the exercise. Each step of the three paper folding exercises was recorded to show the necessary folds and mechanics needed to complete each exercise. The camera angle was adjusted as needed to produce the optimal viewing angle for the folding procedure at that moment.
Audio was recorded while the instructor demonstrates how to complete the folding exercise. The video (dynamic instruction) closely mimicked the paper-based instructions (static instruction) in that the instructor repeated the exact same instructions the control group receives.
Video editing software (Adobe After Effects or Adobe Premire) was used to edit the video to eliminate any unnecessary visual or auditory information. A TV and VCR were used to display the video instruction. The subject was able to rewind and replay any of the steps shown.
Procedure
Subjects were randomly selected from Digital Media classes at the School of Communication Arts. The subjects were given a preliminary questioner to determine their experience level in graphic design and origami. Only twenty-four subjects that have little to no assumed prior origami experience will be selected and randomly placed into the control (static instruction) and experimental (dynamic instruction) groups.
of Factor-Referenced Cognitive Tests (Ekstrom, French, Harman, & Dermen, 1976). The paper-folding test will help determine the subject’s spatial abilities.
After taking the paper-folding test, the groups will be instructed to complete three paper-folding exercises (Appendix B), ranging from easiest to hardest. The control group will complete the exercises as they follow paper-based (static instruction) instruction. The
experimental group will complete the exercises viewing video instruction (dynamic instruction) from a TV and VCR.
A video camera was used to record the subjects performing the task for both the control and the experimental group. The videotape will be analyzed for the accuracy and time to complete the exercises. Each paper folding exercise will be completed in a number of steps, which can be monitored for errors. Errors include: folding the paper incorrectly for a specific step and then corrected; and incorrectly folding the final product. In other words, does the completed exercise look and function correctly. All of the exercises will be functional after completion. When the grasshopper, frog, and bird exercises are completed, the frog and grasshopper will be able to hop and the bird will be able to flap its wings.
After completing the three-origami exercises, the subjects will be given a
questionnaire to determine their preference for video or paper based instruction (Appendix C).
CHAPTER 4
FINDINGS
Introduction
In the following chapter, data collected from the study will be presented and
analyzed. The results were used to test the null hypothesis presented in Chapter 1 along with a discription of the group demographics. The analysis began with a univariate test to check for outliers: data points residing more than three standard deviations from the mean. Once any outliers where identified and removed from the data set, an analysis of covariance (ANCOVA) was conducted to evaluate the significance of the covariate. Next, the first hypothesis concerning completion times of the tasks was analyzed for any significant differences using an analysis of variance (ANOVA). Paralleling the previous analysis, the frequency of errors was also analyzed for any significant differences. Next, the subjects’ level of retention of the first task was analyzed. Finally, the preference for the type of instruction was analyzed. Using an analysis of variance (ANOVA). The data for this study were analyzed using SAS®, from SAS Institute Inc. All hypothesis were tested to the p=.05 level of significance.
Population Demographics
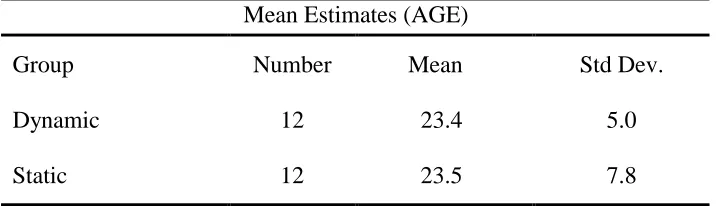
(Table 4.1). The mean age for the control group (static instruction) was 23.4 while the experimental group (dynamic instruction) was 23.5.
Table 4.1: Mean Estimates (Age)
Mean Estimates (AGE)
Group Number Mean Std Dev.
Dynamic 12 23.4 5.0
Static 12 23.5 7.8
Determining Outliers
A univariate analysis for each combination of group, task, and dependent measure was used to test for outliers. Any point further than three standard deviations from the mean was determined to be and outlier. For the dependent measure of task time, one outlier was
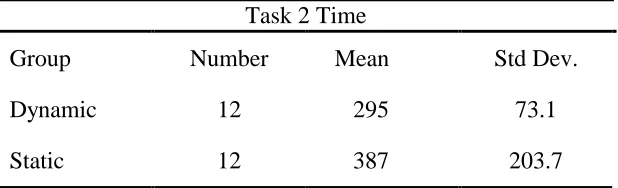
indentified in control group (static instruction) for task 1 (1053 sec.) while two outliers were identified in the experimental group (dynamic instruction); one for task 2 (688 sec.) and one for task 3 (0 sec.). Tables 4.2, 4.3, and 4.4 represent the descriptive statistics before outliers were removed for tasks 1, 2, and 3.
Table 4.2: Task 1 Time
Task 1 Time
Group Number Mean Std Dev.
Dynamic 12 205 64.2
Table 4.3: Task 2 Time
Task 2 Time
Group Number Mean Std Dev.
Dynamic 12 295 73.1
Static 12 387 203.7
Table 4.4: Task 3 Time
Task 3 Time
Group Number Mean Std Dev.
Dynamic 12 89 29.7
Static 12 111 33.4
In attempting to complete task 3, 100% of the subjects had a problem in completing step 5 of the exercise. Some subjects had such a problem, that several either spent an inordinate amount of time completing step 5 or could not continue the exercise. For that reason, the data collected for task 3 ended at step 5 of the exercise.
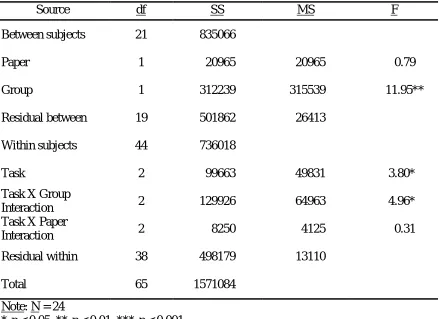
Testing of Analysis of Covariance (ANCOVA)
Table 4.5: Analysis of Covariance (Paper Test - Time)
Source df SS MS F
Between subjects 21 835066
Paper 1 20965 20965 0.79
Group 1 312239 315539 11.95**
Residual between 19 501862 26413
Within subjects 44 736018
Task 2 99663 49831 3.80*
Task X Group
Interaction 2 129926 64963 4.96*
Task X Paper
Interaction 2 8250 4125 0.31
Residual within 38 498179 13110
Total 65 1571084
Note: N = 24
* p < 0.05, ** p < 0.01, *** p < 0.001
Using error as the dependent measure, results were analyzed using a 2-way
Table 4.6: Analysis of Covariance (Paper Test - Error)
Source df SS MS F
Between subjects 21 312
Paper 1 8 8 1.12
Group 1 162 162 21.81***
Residual between 19 142 7
Within subjects 44 291
Task 2 1 1 0.09
Task X Group
Interaction 2 37 19 3
Task X Paper
Interaction 2 7 4 0.55
Residual within 38 246 6
Total 65 558
Note: N = 24
* p < 0.05, ** p < 0.01, *** p < 0.001
Testing of the Hypothesis
In the next four sections, each null hypothesis will be presented along with an analysis of the data. An acceptance or rejection of that hypothesis will also be given. In this study, each null hypothesis had an alpha level of p < 0.05.
Ho1 Students will complete video-based exercises in less time than using traditional
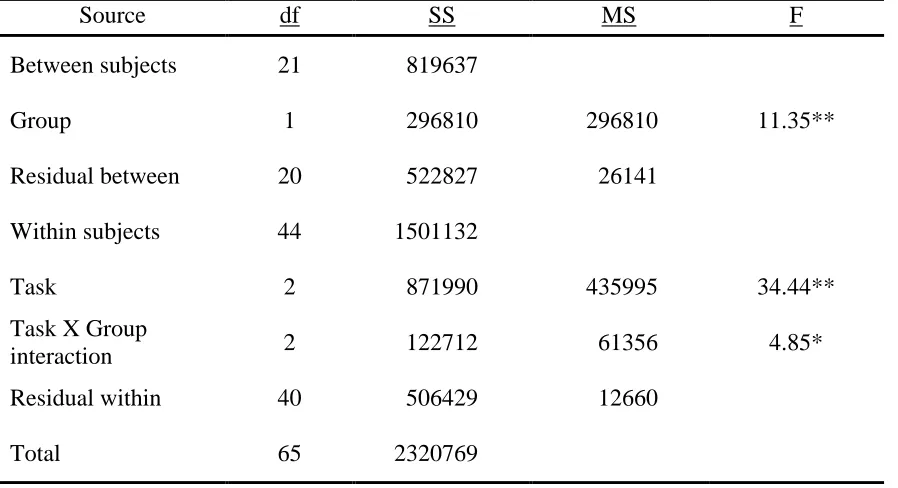
Analyzed using a 2-way ANOVA with group as a between subjects variable, task as a within subjects variable, the Task X Group interaction was significant, F(2, 40) = 4.85, p < 0.013 (Table 4.7). There was a significant simple effect for Group F(1,20) = 11.35, p < 0.003 and a significant simple effect for Task F(2,40) = 34.44, p< 0.0001. Post-hoc contrasts using Least Squares Means showed that the Dynamic group completed Task 1 in a significantly shorter time than the Static group (p < 0.002) (Fig. 4.1). The Dynamic group also completed Task 2 in a significantly shorter time that the Static group (p < 0.046) (Fig. 4.1). There was no significant difference in time to complete Task 3 for the Dynamic or the Static group (p < 0.10) (Fig. 4.1).
Table 4.7: Analysis of Variance (Time)
Source df SS MS F
Between subjects 21 819637
Group 1 296810 296810 11.35**
Residual between 20 522827 26141
Within subjects 44 1501132
Task 2 871990 435995 34.44**
Task X Group
interaction 2 122712 61356 4.85*
Residual within 40 506429 12660
Total 65 2320769
Note: N = 24.
Figure 4.1: Time Mean Plots
TIME MEAN PLOTS
0 100 200 300 400 500 600
1 2 3
TASKS
TIME
DYN STATIC
Ho2 There will be a lower frequency of errors for students viewing an instructional
video compared to reading instructions for completing a spatial task.
Analyzed using a 2-way ANOVA with Group as a between subjects variable, Task as a within subjects variable (Table 4.8) a significant main effect for Group (F(1,20) = 20.62, p
< 0.0002). There was also a significant main effect for Task (F(2,40) = 11.95, p< 0.0001). Post-hoc contrasts using Least Squares Means showed that the Dynamic group completed Task 1 with significantly fewer errors than the Static Group (p < 0.0007) (Fig 4.2). The Dynamic group also completed Task 2 with significantly fewer errors than the Static group (p
Table 4.8: Analysis of Variance (Errors)
Source df SS MS F
Between subjects 21 304
Group 1 154 154 20.62**
Residual between 20 149 7
Within subjects 44 438
Task 2 151 76 11.95**
Task X Group
interaction 2 32 16 2.60
Residual within 40 253 6
Total 65 742
Note: N = 24.
*p < 0.05, ** p < 0.01, *** p < 0.001
Figure 4.2: Errors Mean Plots
ERRORS MEAN PLOTS
0 1 2 3 4 5 6 7 8
1 2 3
TASKS
ERRORS
Ho3 Students will retain more information with video instruction than text and static
graphics based instruction.
Using the Number of Steps remembered on task 1 as the dependent measure and Group as the independent measure, results were analyzed using the Kruskal-Wallis non-parametric test (Table 4.9). Figure 4.3 shows a difference in distribution in number of steps the Static and Dynamic groups were able to remember, however these differences proved to be not significant (ChSq(1,22) = 1.92, p = .17).
Table 4.9: Kruskal-Wallis non-parametric test (number of steps remembered)
N 24 df 1
chi square 1.92
critical value at .05 0.17
Figure 4.3: Mean number of steps remembered
Mean number of steps remembered
0 1 2 3 4 5 6 7 8
GROUP
Number of Steps
DYN
Ho4 Students will indicate a preference for video instruction over traditional text and
static graphics.
Using Overall Reactions to the Instruction as the dependent measure and Group as the independent measure, questionnaire results were analyzed using the Kruskal-Wallis non-parametric test. Question 1 measured overall reactions to the instruction from terrible to wonderful (Table 4.10). These reactions were found not to be significant (ChSq(1,24) = 1.65,
p = 0.20). Question 2 measured overall reactions to the instruction from frustrating to satisfying (Table 4.11). These reactions were found not to be significant (ChSq(1,24) =0.10,
p = .75). Question 3 measured overall reactions to the instruction from dull to stimulating (Table 4.12). These reactions were found not to be significant (ChSq(1,24) = 2.73, p =0 .10). Question 4 measured overall reactions to the instruction from difficult to easy (Table 4.13). These reactions were found not to be significant (ChSq(1,24) = 1.19, p =0 .27). Question 5 measured overall reactions to the instruction from inadequate power to adequate power (Table 4.14). These reactions were found not to be significant (ChSq(1,24) = 1.94, p =0 .16). Question 6 measured overall reactions to the instruction from rigid to flexible (Table 4.15). These reactions were found not to be significant (ChSq(1,24) = 0.22, p =0 .64).
Table 4.10: Overall reactions to the instruction (terrible to wonderful)
N 24 df 1
chi square 1.65
Table 4.11: Overall reactions to the instruction (frustrating to satisfying)
N 24 df 1
chi square 0.10
critical value at .05 0.75
Table 4.12: Overall reactions to the instruction (dull to stimulating)
N 24 df 1
chi square 2.73
critical value at .05 0.10
Table 4.13: Overall reactions to the instruction (difficult to easy)
N 24 df 1
chi square 1.19
critical value at .05 0.27
Table 4.14: Overall reactions to the instruction (inadequate power to adequate power)
N 24 df 1
chi square 1.94
Table 4.15: Overall reactions to the instruction (rigid to flexible)
N 24 df 1
chi square 0.22
CHAPTER 5
SUMMARY, CONCLUSIONS, AND RECOMMENDATIONS
Introduction:
This chapter summarizes the procedures of the study, findings, and implications. The conclusions of the researcher as well as recommendations and discussion for further studies are also presented.
Summary:
With the advent of the Internet came the birth of distant education. Distant education has enabled students the ability to receive their education anywhere and at anytime. The review of the literature revealed that over the last four or five years about 70% of the U.S. universities and colleges have begun offering distance courses outside of their traditional in-class courses. Further review of the literature has revealed that a big part of these
nontraditional online courses are made up of extensive web pages filled with text and static graphics and some universities have now begun to stream video across the Internet to broadcast lectures and demonstrations.
who were enrolled Digital Media at the School of Communication Arts during the 2003 Spring were randomly selected and placed in two format groups of twelve: a control group and an experimental group.
Prior to conducting the experiment each group was administered the Paper-Folding Test VZ-2 from the Kit of Factor-Referenced Cognitive Tests (Ekstrom, French, Harman, & Dermen, 1976). The paper-folding test score was used as a covariate and measured one aspect of a subject’s spatial visualization abilities. After taking the paper-folding test, the control group was instructed through text and static graphics (static instruction) and the experimental group was instructed via video (dynamic instruction). After completing the three-origami exercises, the subjects were given a questionnaire to determine their preference for video or paper based instruction (Appendix F). After completing the questionnaire, the subjects were then instructed to repeat the first paper folding exercise without any
instructional materials. Accuracy (Error), time for completion, and preference were the response measures.
The analysis began with a univariate test to check for outliers: data points residing more than three standard deviations from the mean. After the outliers were identified and removed from the data set an analysis of covariance (ANCOVA) was conducted to evaluate the significance of the covariate. Next, the first hypothesis concerning completion times of the tasks was analyzed for any significant differences using an analysis of variance
(ANOVA). Paralleling the previous analysis, the frequency of errors was also be analyzed for any significant differences. Next, the subjects’ level of retention of the first task was
remaining analysis were also analyzed using an analysis of variance (ANOVA). All hypothesis were tested to the p=.05 level of significance.
Discussion of the Findings
In analyzing the data, the covariate, score on the paper folding test, was found not to be significant with either error rate or response time and therefore was not used in the
analysis. One possible reason for this insignificance could be that both the static and dynamic instruction communicated the spatial information effectively; enough so that both subjects with good or poor spatial abilities could complete the same exercises in essentially the same amount of time and number of errors. Therefore, the paper-folding test used as a contributing factor of how well someone would complete the origami exercises was insignificant.
The findings indicate that the Dynamic group completed Tasks 1 and 2 in
significantly shorter time than the Static group, but there was no significant difference in time to complete task 3 for the either group. One possible reason there was not a significant difference found for completing task 3 would be that in attempting to complete task 3, 100% of the subjects had a problem in completing step 5 of the exercise. Some subjects had such a problem, that several either spent an inordinate amount of time completing step 5 or could not continue the exercise. For that reason, the data collected for task 3 ended at step 5 of the exercise. These findings generally supported the first null hypothesis that students would complete the video-based instructional exercises in less time than using traditional text and static graphics instructional exercises.
hypothesis that there will be a lower frequency of errors for students viewing an instructional video compared to reading instructions for completing a spatial task.
When determining retention, no significant difference was found. These findings did not support the third null hypothesis that students would retain more information with video instruction than text and static graphics based instruction. Although no significant difference was found, Figure 5.1 shows the Dynamic group was able to remember more steps than the Static group.
Figure 5.1: Mean number of steps remembered
Mean number of steps remembered
0 1 2 3 4 5 6 7 8 GROUP
Number of Steps
DYN
STATIC
In measuring user preference, no significant difference was found. These findings did not support the forth null hypothesis that students will indicate a preference for video
instruction over traditional text and static graphics. Conclusion:
communicated using a spatial medium rather than a verbal or textual medium as stated in Chapter 1. These findings are in line with research cited by Najjar (1998) that pictures seem to be better than text or auditory instructions for communicating spatial information and motion-based information that changes continuously over time. When it is important to show how the information changes over time, animation and video appear to be the best.
With college enrollments and tuition on the rise, many universities have sought cheaper alternative methods for delivering course content in order to keep costs down. Outside of their traditional in-class courses, about 70% of the U.S. universities and colleges have begun offering distance courses over the last four or five years (Serdiukov, 2001).
In the past, students with low bandwidth, 56k modem or below, had problems taking distance education courses that streamed video. In order to view video from the Internet with a reasonable download time or stream rate, students would need a cable or dsl modem to obtain a larger bandwidth. Over the past few years the ability to deliver video over the Internet at a low bandwidth has become a reality. New software developments have
revolutionized the way video is delivered via the Internet. New codecs and file compression have enabled a 5MB video file to be compressed down to less than 1MB without substantial loss of video playback quality. In the future, students taking distance education classes over the Internet will be able to view class lecture, participate in group discussion via web cams, and view video instruction with relative ease.
Recommendations:
1. Run the study on a non-graphic design population.
2. This study should be replicated with different types of origami exercises.
3. This study should be replicated at the four-year university and high school level to allow for different educational settings, facilities, and age groups. This would help the generalization of the study.
LIST OF REFERENCES
Alesandrini, K. (1984). Pictures and adult learning. Instructional Science, 13, 63-67. Alesandrini, K., & Rigney, J. (1981). Pictorial presentation and review strategies in science
learning. Journal of Research in Science Teaching, 18, 465-474.
Alington, D. E., Leaf, R. C., & Monaghan, J. R. (1992). Effects of stimulus color, pattern, and practice on sex differences in mental rotations task performance. The Journal of Psychology, 126, 539-553.
Baddeley, A. (1986). Working memory. Oxford: Clarendon Press, 1986.
Bersch, C. (1999). Making the Grade. Communication News. Retrived April 20, 2002, from the World Wide Web: http://www.findarticles.com/cf_0/m0CMN/12_36/
58410652/p1/article.jhtml?term=retraining+and+distance+education
Braukmann, J., (1991). A comparison of two methods of teaching visualization skills to college students. Doctoral Dissertation, University of Idaho.
Carswell, C. M. & Wickens, C. D. (1997). Information processing. Handbook of Human Factors and Ergonomics / [editor, Salvendy, Gavriel]. (pp. 89-129). New York: Wiley & Sons.
Chan, A., Travers, R. M. W., & Van Mondfrans, A. P. (1965). The effects of colored
embellishments of visual array on a simultaneously presented audio array. Audio Visual Communication Review, 13, 159-164.
College Costs Increase but Record Amount of Financial Aid Is Available to Students; Loan - Grant Imbalance Remains a Concern. The College Board for Education Professionals.
Retrieved March 16, 2002, from the World Wide Web: http://www.collegeboard.com/press/cost01/html/011023.html
Deno, J. A. (1995). The relationship of previous spatial visualization ability. TheEngineering Design Graphics Journal. 59 (3), 5-17.
Devon. R., Engel, R. S., Foster, R. J., Sathianathan, D., & Turner, F. F. W. (1994). The effect of solid modeling on 3D visualization skills. The Engineering Design Graphics
Journal, 58 (2), 4-11.
Eberts, R. (2000). Design of education and training in the 21st Century. Proceedings of the IEA 2000/HFES 2000 Congress. (pp.774-775).
Eisenberg, T.A., McGinty, R. L., (1977). On spatial visualization in college students. The Journal of Psychology,95, 95-104.
Farr, Marshall J. & Psotka, J. (1992). A thematic introduction to intelligent instruction: progress toward practice. Intelligent Instruction by Computer: Theory and Practice.
(pp.1-12).
Flowers, J. (2001). Online learning needs in technology education. The Journal of Technology Education. Retrieved February 25, 2002, from the World Wide Web: http://scholar.lib.vt.edu/ejournals/JTE/v13n1/flowers.html
Gillespie, W. H. (1995). Using solid modeling tutorials to enhance visualization skills. Doctoral Dissertation, University of Idaho.
Halpern, D. F. (1986a). Sex differences in cognitive abilities. Hillsdale, NJ: Erlbaum. Jones, D. R. (2000). The distance education debate an australian view. Change. Retrived
April 21, 2002, from the World Wide Web: http://www.findarticles.com/cf_0/ m1254/6_32/67884314/p1/article.jhtml?term=distance+education
Koroscik, J. S. (1982). The effects of prior knowledge, presentation time, and task demands on visual art processing. Studies in Art Education,23 (3), 13-22.
Linn, M. C., & Petersen, A. C. (1985). Emergence and characterization of sex differences in spatial ability: A meta-analysis. Child Development, 56, 1479-1498.
McGee, M. G. (1979). Human spatial abilities: Psychometric studies and environmental, genetic, hormonal, and neurological influences. Psychological Bulletin, 86, 889-918. Menne, J. M., & Menne, J. W. (1972). The relative efficiency of bimodal presentation as an
aid to learning. Audio Visual Communication Review. 20, 170-180.
Minoli, D. (1996). Distance learning technology and applications. Norwood, MA: Artech House, Inc.
Naisbett, J. (1994). Global paradox. New York: William Morrow Co Inc.
Najjar, L. J. (1998). Principles of educational multimedia user interface design. The Journal of Human Factors and Ergonomics Society, 40 (2), 311-323.
Nuallain, O. (Ed.). (2000). Spatial cognition: Advances in consciousness research.
Philadelphia, PA: John Benjamins Publishing Co.
Palmer, S. E. (1975). The effects of contextual scenes on the identification of objects.
Memory & Cognition, 3, 519-526.
Penny, C. G. (1975). Modality effects in short-term verbal memory. Psychological Bulletin,
2, 68-84.
Poohkay, B. (1994). Effects of computer-displayed animation on achievement and attitude in mathematics computer based instruction. Unpublished masters thesis. Edmonton, AB: University of Alberta.
Rigney, J., & Lutz, K. (1976). Effects of graphic analogies of concepts in chemistry on learning and attitude. Journal of Educational Psychology, 68, 305-311.
Salkind, N. J., (1976). A cross-dimensional study of spatial visualization in young children.
Journal of Genetic Psychology,129 (2), 339-340.
Scali, R. M., & Brownlow, S. (in press). Impact of stereotype activation and experimental instructions on spatial performance. Psi Chi Journal.
Scali, R. M., & Brownlow, S. (2002). Gender differences in spatial task performance as a function of speed of accuracy orientation. Sex Roles: A Journal of Research. Retrieved September 2, 2002, from the World Wide Web: http://www.findarticles.com
/cf_0/m2294/2000_Sept/71118812/p1/article.jhtml
Serdiukov, P. (2001). Models of distance higher education: Fully automated or partially human? Educational Technology Review, 9, (1).
Severin. W. J. (1967). The effectiveness of relevant pictures in multiple-channel communications. Audio Visual Communication Review, 15, 386-401
Sewell, E. H., Jr., & Moore, R. L. (1980). Cartoon embellishments in informative presentations. Educational Communication an Technology Journal, 28, 39-46. Sexton, T. J. (1992). Effect on spatial visualization: Introducing basic engineering graphics
concepts using CAD technology. The Engineering Design Graphics Journal,56 (3), 36-43.
Smith, G. (2001). Interaction evokes reflection: Learning efficiency in spatial visualization.
Interactive Multimedia Electronic Journal of Computer-Enhanced Learning, 3, (2).
Soulier, S. J. (1988). The design and development of computer based instruction. Newton, Massachusetts: Allyn and Bacon, Inc.
Watkins, O. C., & Watkins, M. J. (1980). The modality effect and echoic persistence.
Wu, J. (1997). Joseph Wu origami Inc. Retrieved June 01, 2002, from the World Wide Web: http://www.origami.vancouver.bc.ca/Info/history.html
Student Information Sheet
1. Age: ____
2. Gender: M / F
3. Academic Status
a. ____ Fresh
b. ____ Soph c. ____ Jr. d. ____ Sr. 4. Ethnicity
a. ____ African American b. ____ Caucasian c. ____ American Indian d. ____ Asian American e. ____ Hispanic
5. How many graphic design courses have you taken? a. ___ High school
b. ___ College
6. Experience with graphic design. a. ____ None
b. ____ One year or less c. ____ More than one year 7. Experience with origami.
a. ____ None
b. ____ Have built one or two pieces c. ____ A few years ago
Appendix C
Questionnaire for User Interaction Satisfaction Name:________________________
Adopted from the Questionnaire for User Interaction Satisfaction ( University of Maryland, 1997)
Part 3: Overall User Reactions
Please circle the numbers that most appropriately reflect your impressions about using this instructional method. Not Applicable = NA
3.1 Overall reactions to the instruction: terrible wonderful 1 2 3 4 5 6 7 8 9 NA
3.2 frustrating satisfying
1 2 3 4 5 6 7 8 9 NA
3.3 dull stimulating
1 2 3 4 5 6 7 8 9 NA
3.4 difficult easy
1 2 3 4 5 6 7 8 9 NA 3.5 inadequate power adequate power
1 2 3 4 5 6 7 8 9 NA
3.6 rigid flexible
1 2 3 4 5 6 7 8 9 NA Part 4: Screen
4.1 Characters displayed (TV or paper) hard to read easy to read 1 2 3 4 5 6 7 8 9 NA 4.1.1 Image of characters fuzzy sharp
1 2 3 4 5 6 7 8 9 NA 4.1.2 Character shapes barely legible very legible
1 2 3 4 5 6 7 8 9 NA 4.2 Highlighting on the screen unhelpful helpful
4.2.1 Use of reverse video unhelpful helpful
1 2 3 4 5 6 7 8 9 NA 4.2.2 Use of blinking unhelpful helpful
1 2 3 4 5 6 7 8 9 NA 4.2.3 Use of bolding unhelpful helpful
1 2 3 4 5 6 7 8 9 NA 4.3 Screen layouts were helpful never always
1 2 3 4 5 6 7 8 9 NA 4.3.1 Amount of information can inadequate adequate be displayed on screen 1 2 3 4 5 6 7 8 9 NA 4.3.2 Arrangement of information illogical logical
can be displayed on screen 1 2 3 4 5 6 7 8 9 NA 4.4 Sequence of screens confusing clear
1 2 3 4 5 6 7 8 9 NA 4.4.1 Use of reverse video unpredictable predictable 1 2 3 4 5 6 7 8 9 NA 4.4.2 Going back to the previous impossible easy