DUVERNET, AMY MARGARET. Reducing the Time and Effort Required by
Meta-Analysis through the Use of Random Sampling. (Under the direction of Dr. Mark Wilson and Dr. Joan Michael.)
Meta-analysis has become a foundation of scientific inquiry. It is used to statistically integrate the findings of many studies to come to generalizable conclusions. Unfortunately, in some cases, the number of studies available for the analysis can make the meta-analysis process extremely difficult and lengthy. The current study attempted to alleviate this problem by investigating the effects of random sampling of the studies used in the analysis in recently published meta-analyses to determine if a subsample of studies could produce accurate results. In the process, the characteristics of recent meta-analyses were investigated, as well as the percentage of randomly sampled studies that is needed to produce accurate moderator findings. Results of this investigation provide preliminary support for the use of random sampling in medium and large-scale meta-analyses, or analyses in which a medium (35 or more) to large number (91 or more) of studies fit the analyst’s inclusion criteria. Random sampling was able to reproduce the main effect sizes found in these types of meta-analyses. The use of random sampling to replicate the results of meta-analyses involving moderators, however, was only successful in large scale analyses. It is hoped that these results will
by
Amy Margaret DuVernet
A thesis submitted to the Graduate Faculty of North Carolina State University
in partial fulfillment of the requirements for the Degree of
Master of Science
Psychology
Raleigh, North Carolina 2008
APPROVED BY:
_______________________________ ______________________________
Dr. Joan J. Michael Dr. Mark A. Wilson
Committee Co-Chair Committee Co-Chair
DEDICATION
BIOGRAPHY
Amy Margaret DuVernet was born April 2, 1982 in Charleston, SC. She graduated from the North Carolina School of the Arts in Winston Salem, NC in 2000 having earned a high school degree concentrated in music. Next, she completed her undergraduate education at the University of North Carolina in 2004, earning a Bachelor of Arts degree in
Psychology. After graduation, she worked as an assistant media buyer for Mullen Advertising in Winston Salem, NC.
In the fall of 2005, Amy began her graduate studies at North Carolina State University in the Industrial and Organizational Psychology Doctoral program. She is employed as a teaching assistant and currently serves as a lab instructor for a research methods and statistics course. She has also served as a primary instructor and an
ACKNOWLEDGEMENTS
I would like to thank my committee co-chair, Dr. Mark Wilson for his invaluable feedback and guidance during the course of this project. I would also like to thank my committee co-chair, Dr. Joan Michael, and committee member, Dr. Bartholomew Craig, for their advice and support.
Additionally, I would like to thank Dr. Michael Riketta, Dr. James Combs, and Dr. Christina Underhill for allowing me to use their original data to complete my research. Without their assistance, this would have been a more daunting process.
I would also like to thank my cohort, Nichole Ayers (“What’d you move away for?”), Clara Hess (“Bubbles”), Tom Whelan (“The Dancer”), and Will Stoughton (“Our Adoptee”), for their encouragement, support, and sense of humor. In addition, I want to thank Jennifer London for her assistance with the data collection and coding phases of my research. I also want to thank my dear friends, Krystal Lutz and Jennifer McLean, for their “major”
contribution to my life and for the much needed distractions they provided.
TABLE OF CONTENTS
LIST OF TABLES……… vi
Section I: Literature Review...……….. 1
Meta-analysis………. 3
Properties of a Sampling Distribution…..………. 13
Meta-analytic Moderator Analyses……..………. 16
Section II: Method………. 19
Meta-Analyses Criteria………. 19
Retrieving the Effect Size Databases………. 22
Main Effect Size Analysis……….. 22
Moderator Analyses……….. 24
Section III: Results……… 25
Characteristics of Recently Published Meta-analyses……….. 25
Meta-analyses Chosen for Reproduction……….. 27
Main Effect Size Reproduction……….. 29
Homogeneity Tests……… 31
Moderator Analysis………... 33
Section IV: Discussion……….. 37
Limitations and Future Research……….. 38
Implications………... 39
Section V: Conclusion………... 41
References………. 43
LIST OF TABLES
Page Table 1. Descriptive Statistics for the Meta-Analyses Published in 2006……….. 48 Table 2. Main Effects Found in Each Sample from Underhill’s (2006)
Meta-analysis………... 49 Table 3. Main Effects Found in Each Sample from Riketta and Van Dick’s
(2005) Meta-analysis.………..….. 50 Table 4. Main Effects Found in Each Sample from Combs et al.’s (2006)
Meta-analysis……….……… 51 Table 5. Moderation Results from Each Sample of Underhill’s (2006)
Meta-analysis………. 52 Table 6. Moderation Results from Each Sample of Riketta and Van Dick’s
(2005) Meta-analysis………. 57 Table 7. Moderation Results from Each Sample of Combs et al.’s (2006)
Section I: Literature Review
Meta-analysis is a statistical technique used to integrate the results of a large number of independent studies in order to draw generalizable conclusions (Mullen, 1989). This technique has become a powerful influence in both scientific research and public policy. Meta-analysis has been applied to a broad range of subjects including medicine, economics, entomology, education, organizational studies, neuropsychology, and psychiatric treatments (Shadish, Cook, & Campbell, 2002). In fact, there were over 15 meta-analyses published in the Journal of Applied Psychology last year (2007) alone.
One of the main goals of meta-analysis is to produce generalizable results. Therefore, a meta-analyst seeks to include as many kinds and types of studies in his or her analysis as are relevant to the topic being investigated. Unfortunately, this can sometimes lead to an enormous amount of data, as hundreds of studies may be available for inclusion in the analysis. Because the resources required to perform a meta-analysis increase as the number of studies included in the analysis increase, it appears that meta-analysts must always balance the goal of generalizability with that of practical resources and time. In addition, as the number of studies included increases, so too do the opportunities to make clerical and coding mistakes (Wolf, 1986). For these reasons, many authors have suggested that in situations where the population of studies that fit a analyst’s inclusion criteria is large, the meta-analyst may take a random sample of those studies (Glass, McGaw, & Smith, 1981; Hunter & Schmidt, 1990; Mullen, 1989).
appears that many researchers choose to minimize the number of studies included in their meta-analyses by narrowing their inclusion criteria, which can limit the generalizability and accuracy of their findings (Mullen, 1989). One reason why many meta-analysts may choose to narrow their inclusion criteria instead of using random samples may be a general lack of guidance on how to choose an appropriate sample size. To my knowledge, there have been no formal guidelines published to direct meta-analysts in the choice of sample size. This paper will address this limitation, by providing evidence that the use of random samples does not necessarily adversely impact the results of meta-analysis and by developing general guidelines that meta-analysts can use to determine if and when the use of random sampling is appropriate.
Meta-analysis
Single experiments cannot provide sufficient evidence to draw concrete conclusions and generalizations about the relationships being studied. Instead, numerous study findings are typically required before definitive judgments can be made. This, however, becomes a difficult task as the vast number of studies available on a given topic will generally employ different operationalizations, settings, samples, times, and outcomes (Wolf, 1986). While some social scientists choose to use simple narrative reviews to summarize the findings of numerous studies, generally, these reviews are not sufficient, as it is virtually impossible for a reviewer to survey all the different and often conflicting results of individual studies and come to concrete conclusions about the relationships being studied. Clearly, researchers need a method of statistically integrating and interpreting the results of large numbers of studies (Hunter, Schmidt, & Jackson, 1982). Meta-analysis provides such a method by allowing researchers to statistically combine individual studies and summarize their findings to obtain more accurate and generalizable estimates of the effects in question. This technique also allows researchers to determine which characteristics of the individual studies contribute to the variation in effect sizes found across studies. Thus, meta-analysis not only offers more credibility than narrative reviews, but also offers the ability to state more conclusively what relationships exist among a set of variables (Shadish, Cook, & Campbell, 2002).
account for that variability through theoretical predictions (Hunter & Schmidt, 1990; Hunter, Schmidt, & Jackson, 1982; Mullen, 1989). The main difference between this type of
secondary-level analysis and primary-level analysis is the unit being studied; the unit of analysis included in secondary-level research is the results of individual studies, whereas the unit that is studied in primary-level analyses is typically participant data. In addition, meta-analytic techniques differ from primary-level analyses because the techniques generally apply corrections for study artifacts and weight units, or studies, by their sample size (Mullen, 1989).
Number and Type of Studies Included in Meta-analysis
As previously mentioned, the main goal of meta-analysis is to synthesize findings in order to draw generalizable conclusions. Due to this goal of generalizability, meta-analytic techniques seek to cast a wide net when gathering and analyzing studies. Unfortunately, while the use of broad inclusion criteria can increase the generalizability of meta-analytic results, broad criteria can also yield an overwhelming amount of data. In the past, meta-analyses have been criticized for including too few studies. It seems that some researchers feel that a meta-analysis should only be conducted when a researcher can gather a large number of studies on a given topic area (Hunter & Schmidt, 1990). In fact, Arthur, Winston, and Huffcutt (2001) have suggested that meta-analyses should ideally include several
hundred studies. This, however, is not necessarily true; the number of data points, or study effect sizes, included in a meta-analysis does not bear on the appropriateness of the statistical techniques used (Mullen, 1989). In fact, meta-analytic techniques can be applied when there are as few as two or three relevant studies (Hunter, Schmidt, & Jackson, 1982; Lipsey & Wilson, 2001; Mullen, 1989). Most meta-analytic guidelines suggest that the most important point to consider is that all relevant studies are represented in the meta-analysis. If there are a large number of studies available, but only a small portion of those are used, the
meta-analytic results will be compromised if the portion of studies chosen for inclusion do not represent the population of studies available (Mullen, 1989). For this reason, most meta-analysts seek to include all relevant studies in their analysis, which, in some cases, can be a very large number.
more recently conducted meta-analyses. Because research continues to build around specific topics, there may be more studies available for meta-analytic research than there were in 1990. In some highly developed and researched areas, the number of studies that are eligible for inclusion in a given meta-analysis could be enormous. In addition, the increasing
prevalence of electronic technologies and databases may allow meta-analysts to more easily and quickly access relevant publications. For these reasons, it seems logical to assume that meta-analysts may be including a much larger number of studies in their analyses than Hunter and Schmidt (1990) estimated almost two decades ago. For example, in their recent meta-analysis on the relationship between job satisfaction and job performance, Judge, Thoresen, Bono, and Patten (2001) found 254 studies that met their inclusion criteria. In addition, it appears that even a decade ago meta-analysts were struggling with the number of possibly relevant studies that could be included in their analysis. Lipsey (1992) found over 8,000 possibly relevant citations for his meta-analysis on juvenile delinquency treatment; he eventually narrowed these citations down to 443 studies. Devine (1992) also found a large number of possible studies for inclusion in her meta-analysis. She narrowed down her
When researchers do identify a large number of relevant citations, some researchers may seek to limit their analyses to published studies. In this way, they can minimize the number of data points in their database and ease the burden of tracking down fugitive research. There has, however, been a consistent debate about whether or not this technique produces valid estimates of the true population effect size. Many researchers feel that a meta-analysis which is not based on both published and unpublished literature will be subject to publication bias. This criticism is based on the idea that certain studies, such as those that do not find statistically significant results, will not make it through the publication process and therefore the studies that are published will be biased such that they are all statistically significant. Most meta-analytic guidelines suggest using studies from a variety of different resources including professional journals, books, theses, dissertations, papers presented at conferences, archives and other unpublished sources (Mullen, 1989; Shadish, Cook, & Campbell, 2002). It is unclear, however, whether or not meta-analysts are actually seeking out these unpublished sources
The first question that this paper attempts to answer deals with the characteristics of recently published meta-analyses. By surveying the meta-analyses published in 2006, it will become clear whether meta-analysts are including relatively large or small numbers of studies in their analyses and whether or not they are including a mix of published and unpublished studies in their analyses.
Research Question 1b: What is the mean proportion of published studies included in meta-analyses published in 2006?
Minimizing the Resources Required through the Use of Random Sampling
Thorough meta-analyses that include all relevant studies can take an enormous amount of effort. The gathering, reading, and coding required for large-scale meta-analyses are not only extremely time-consuming, but these tasks can also require a large budget (Mullen, 1989). A meta-analyst must first conduct a literature search to gather citations for all studies that could be relevant to the question being investigated. Next, the meta-analyst must read, or at least skim, all the articles that were revealed in the literature search to determine which studies fit the inclusion criteria. After a literature search is conducted and the studies that bear on the relationships being investigated have been selected for inclusion, the real work begins. The meta-analyst must gather all the effect sizes from each individual study and convert those into a common metric. During this process, the meta-analyst will also choose possible moderator variables and code for the presence of these variables in each individual study, producing a database of all study effect sizes, sample sizes, variances, and moderator codes. Hunter, Schmidt, and Jackson (1982) estimate that coding the individual studies can make up ninety-nine percent of the work involved in meta-analysis. It seems clear that larger numbers of included studies greatly increase the amount of time needed to conduct a meta-analysis as well as the opportunities for the meta-analyst to make mistakes (Wolf, 1986).
criteria to produce a more manageable number of studies for analysis. In some cases this narrowing could provide a more insightful and focused understanding of the phenomena being studied; however, in other cases, narrowing the inclusion criteria could be detrimental to the generalizability of the meta-analytic findings (Mullen, 1989). In fact, there has been a consistent debate between researchers on whether to use broad inclusion criteria or more narrow criteria. Those who advocate for narrow inclusion criteria often criticize meta-analyses for comparing ‘apples and oranges’ (Mullen, 1989). This means that these critics feel that meta-analysis is often used to compare the results of studies that are not comparable. Because meta-analysts attempt to gather as many studies as possible, they may include research studies that differ dramatically in their operationalizations, procedures, and
theoretical underpinnings. Researchers who advocate for broad inclusion criteria argue that because the goal of meta-analysis is generalizability, meta-analysts should survey a wide-range of studies. Advocates of broad inclusion criteria assert that the wider the inclusion criteria, the more generalizable the results will be (Mullen, 1989). If meta-analysts are selective and do not gather sources from all available resources, they risk conducting an analysis on a sample of studies that is both incomplete and biased; however, if meta-analysts retrieve studies from the full range of sources available, the meta-analytic results should be more accurate and useful (Mullen, 1989).
but that all possible sources of studies have been tapped so that the sample obtained will not be biased against a certain type of study or finding. Cooper (1984) asserts that the biggest threat to the validity of a meta-analysis is that all of the studies that bear on the topic will not be included and that those that are excluded will be systematically different from the
included studies. Therefore, it seems that the search for relevant studies should be broad and exhaustive.
An exhaustive search, however, can yield a large number of relevant studies that fit the inclusion criteria. When this occurs, the meta-analyst will have to decide among three options. The first option is to include every study that bears on the topic at hand, which as discussed earlier can be costly and time consuming. The second option is to narrow the inclusion criteria at the expense of generalizability. The third solution to this dilemma is to take a random sample from all relevant studies that fit the inclusion criteria (Glass, McGaw, & Smith, 1981; Mullen, 1989; Hunter & Schmidt, 1990). Meta-analytic results should
uncovered over 8,000 possible citations, which he narrowed to 443 studies that fit his inclusion criteria (Lipsey, 1992).
Aside from Lipsey and Wilson (2001), most authors agree that it is not as important for a meta-analysis to include all studies ever conducted on the topic of interest as it is for the meta-analysis to include a sample of studies that is representative of the studies that have been conducted on that topic (Wachter & Straf, 1990). This important consideration can be achieved through random sampling. In addition, because each individual study will have different sample sizes, a small number of studies could in fact include a large sample of participants when these studies are combined. Given these considerations, it seems
reasonable to believe that the use of random sampling could alleviate some of the burdens involved in meta-analysis. Unfortunately, to date, there have been no published guidelines instructing researchers on how to choose a sample size, which may be a deterrent to meta-analysts who could benefit from the use of random sampling. Most experts admit that there are no clear answers to the question of how many studies should be included in a meta-analysis (Hedges & Olkin, 1985); therefore, the second research question that this paper attempts to answer relates to how many studies should be randomly sampled in meta-analysis.
Research Question 2: What percentage of randomly sampled studies is necessary to produce accurate population effect size estimates in meta-analysis?
Rubin’s (1978) meta-analysis on interpersonal expectancy effects in experimentation. The authors collected 345 studies that examined interpersonal expectancy effects and from those 345 possible studies, they took a stratified probability sample of 113 studies. They choose these studies by first selecting the most statistically significant studies available and then randomly selected from the rest of the studies in each of the subtopic areas of interest. The authors justified the combination of the nonrandom subsample of the most significant studies with a random sample of studies by arguing that the most significant studies allowed for more precise estimates of the effect sizes. Another example of random sampling comes from Miller’s (1977) meta-analysis on drug therapy. He located 1,100 studies that fit the inclusion criteria for his meta-analysis and from those 1,100 studies he took a stratified random sample of 90 studies to represent the major drug categories he wished to investigate. He also chose six extra articles to ensure that both well-known and recently published studies were included (as cited in Glass, McGaw, & Smith, 1981). While these examples are notable for their use of random sampling, they are flawed in that they did not choose the included studies in a
completely random manner. Unless the studies are chosen at random, the results of a meta-analysis should be interpreted with caution as these results may be biased in some way.
In addition to lightening the work load of the meta-analyst, the use of random
and includes all relevant studies, the meta-analysis will not be based on a random sample and will, therefore, violate the assumptions of these random effects models.
Additionally, the applications of significance tests to meta-analyses are not logical given that most meta-analyses claim to have included the entire population of studies on a given topic. Significance tests are intended to determine if a sample statistic can be inferred to reflect a population parameter; therefore, a significance test should only be applied when one is trying to ascertain whether a sample statistic is reflective of a population or if it could have occurred by chance. Because most meta-analysts strive to include the entire population of studies in their analysis, significance tests should not be applied (Arthur, Winston, & Huffcutt, 2001; Hunter & Schmidt, 1990). Unfortunately, it is very common for
meta-analysts to test for significance and in fact many reviewers and editors require these kinds of tests (Abrami, Cohen, & d’Apollonia, 1988; Arthur, Winston, & Huffcutt, 2001). These techniques, however, can and should be applied when a meta-analysis employs a random sample of studies to derive its results.
Properties of a Sampling Distribution
The previous discussion on the inappropriateness of conducting statistical
population parameter in a random manner. Therefore, a sampling distribution can be used to determine the probability that a specific sample statistic would be obtained from a population using statistical significance tests (Berk, in press; Ott & Longnecker, 2001). Because of this, sampling distributions and all statistical analyses that assume sampling distributions,
including statistical significance tests, will not apply unless a random sample or random assignment exists, which is not the case in meta-analyses that use the entire population of studies or a convenience sample (Berk, in press; Berk & Freedman, 2003). These tests, however, can be applied if a meta-analyst employs random sampling to produce his or her results.
A random sample of individual studies included in a meta-analysis is considered random if each study has an equal probability of being selected for the analysis (Berk & Freedman, 2003; Ott & Longnecker, 2001). The sample statistic derived from a random sample will be random and therefore subject to random variation from the true population parameter (Ott & Longnecker, 2001). The certainty with which one can assume a specific sample statistic is representative of a population parameter is dependent on the sample size. That is, the accuracy of the inferences that are drawn from a given sample statistic will be greater if the sample size used is large. If the n or the k is small, the sample statistic is much more likely to deviate from the true population mean or µ than if the n, or k, is large. This means that one extreme data point or value will have a much larger effect on the sample statistic if it is derived from a small sample (Ott & Longnecker, 2001).
large, the reviewer will risk wasting valuable time and money, as a smaller sample may have produced the same results as a large sample; if the sample of included studies is small, the reviewer again risks wasting valuable time and money because the effect size obtained may not accurately reflect the population effect size. The balance between these considerations should be determined by the desired tolerable error and the desired confidence interval width. A reviewer will want to consider how wide the confidence interval can be; if it is too wide, the results become meaningless as the effect size obtained by the meta-analysis will be imprecise and uninformative. In most individual studies, researchers want to achieve at least 90-95% certainty and this standard can be applied to the certainty derived from
meta-analyses (Ott & Longnecker, 2001).
A related issue that a meta-analyst must consider when choosing a sample size deals with the power of the meta-analysis (Shadish, Cook, & Campbell, 2002). In statistics, power indicates the ability of an experiment to accurately reject a false null hypothesis. More specifically, statistical power in a meta-analysis refers to the probability that the analysis will correctly detect a significant effect when the population mean is truly greater than zero. This statistic depends on the size of the effect, the alpha level chosen (as indicated by the
confidence interval), and the sample size used. This means that as the researcher’s desired power level increases, so too does the necessary sample size to achieve that level of power (Keith, 2006).
necessary to produce an accurate effect size could vary based on the number of studies in the population of all relevant studies. Therefore, the third research question that this paper attempts to answer relates to whether or not the number of studies needed to produce adequate power for detecting an effect size differs based on the number of studies in the population of studies that fit an analyst’s inclusion criteria.
Research Question 3: Does the percentage of randomly sampled studies necessary to produce accurate population effect size estimates in meta-analysis vary as a function of the size of the population?
Meta-analytic Moderator Analyses
There are two possible causes of variance in the observed effect sizes collected for a meta-analysis. The first is that the population of individual studies is homogenous, meaning that the effect sizes are consistent across the population of studies and any variation in effect sizes across studies is due only to chance or sampling error (Arthur, Winston, & Huffcutt, 2001; Hunter & Schmidt, 1990; Lipsey & Wilson, 2001; Shadish, Cook, & Campbell, 2002). The second possibility implies that the population of individual studies is heterogeneous, meaning the variation in the effect sizes of the individual studies is systematic or due to some factor(s) other than chance (Arthur, Winston, & Huffcutt, 2001; Hunger & Schmidt, 1990; Shadish, Cook, & Campbell, 2002). Meta-analysts will typically test their population of individual studies for homogeneity; if homogeneity is rejected, meaning that the variance is heterogeneous, the meta-analyst will then begin a search for moderator variables (Lipsey & Wilson, 2001; Shadish, Cook, & Campbell, 2002).
In the heterogeneous case, the use of a small sample size will make it much more difficult for a meta-analyst to detect the presence of a true moderator. This means that the analyst’s power to detect heterogeneity will be low. If, however, the meta-analysis contains of very large sample, the analyst will run the opposite risk: a Type I error is very possible. Any small and inconsequential variance from homogeneity could lead the analyst on a search for moderators that do not exist (Hunter & Schmidt, 1990). Because of these issues, it seems clear that a meta-analyst must strike a balance when choosing a sample size; when a
significance tests, and could alleviate the possibility of a Type I error. However, when a smaller number of studies are available for inclusion in a meta-analysis, the use of a random sample could limit the accuracy of the meta-analytic results as well as the meta-analyst’s ability to detect heterogeneity. The fourth research question that this paper addresses relates to the percentage of sampled studies needed to produce accurate homogeneity results.
Research Question 4: What percentage of randomly sampled studies is necessary to produce true population results of homogeneity tests?
Because the homogeneous case is very unlikely to exist, meta-analytic results will generally include variance due to moderators. Meta-analysts can search for moderator variables using one of two techniques. The first technique splits the sample of included studies into subgroups depending on their level of a particular moderator. The various
subgroups are then tested again for homogeneity to determine if the moderator accounts for a significant amount of variance. In addition, the subgroup effect sizes are derived and
compared to determine if the moderator significantly affects the results (Arthur, Winston, & Huffcutt, 2001). The other option for examining a moderator variable is to use regression modeling to test which variables can account for the extra variance (Lipsey & Wilson, 2001; Shadish, Cook, & Campbell, 2002).
The final research question that this paper attempts to answer relates to the level of sampling needed to produce accurate moderator results. Because most meta-analysts will find that their population or sample of studies are heterogeneous, they will need to conduct
available to instruct her or him on what level of sampling will be necessary to produce accurate moderator results.
Research Question 5: What percentage of randomly sampled studies is necessary to produce accurate moderator effect size results in meta-analysis?
This study tested five research questions intended to advance the existing knowledge of the process of conducting meta-analysis. The first question examined the number and kind of studies were included in recently conducted meta-analyses. The second research question examined the percentage or level of random sampling that is needed to produce accurate meta-analytic results. The third research question extended the second by examining whether the level of sampling needed to produce accurate main effect estimates varied with the size of the population of studies. In addition, the fourth research question investigated the level of sampling needed to produce accurate homogeneity. Finally, the fifth research question examined the percentage or level of random sampling that is needed to produce accurate moderator results. It is hoped that in answering these question, I can provide guidelines to future meta-analysts that can be used to direct their choice of random sample size; in this way, they can ensure that their samples will produce a reasonable estimate of the true population value for all studies as well as accurate moderator results.
Section II: Method Meta-Analyses Criteria
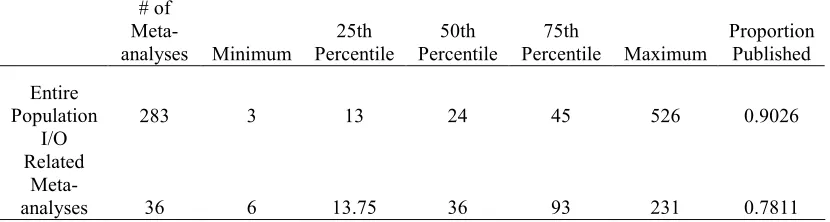
meta-analyses being published today. The first question addressed by this paper asked was: What characteristics make a meta-analysis representative of those being conducted and published recently? To answer this question, a PsycINFO search was carried out on all citations from the year 2006 that listed meta-analysis as a keyword. This search produced 574 citations (as accessed 6/2/07). These citations were examined and 246 were eliminated because they were not meta-analyses. The remaining studies were further investigated to determine how many studies each included in the analysis. During this process, an additional 45 studies were eliminated because they either were not meta-analyses or they did not indicate the number of studies that were included in the analysis. This left a total of 283 remaining meta-analyses from 2006 (see Appendix for a list of these studies). A database of the number of studies included in each meta-analysis was then created. These citations were also examined to determine what kinds of studies were used in the analysis; an index was created to indicate the proportion of the studies in each meta-analysis that were published.
Retrieving the Effect Size Databases
After the meta-analyses were chosen, the first author of each meta-analysis was contacted and asked to provide the original data files containing effect sizes and moderator codes for their meta-analysis. All three of the authors were reached and agreed to provide their files. This step was undertaken to ensure that the effect sizes and moderator codes used in each random sample were accurate representations of those that were used in the original meta-analyses.
Main Effect Size Analysis
After gathering all three of the meta-analysis databases, I first attempted to reproduce the results of each published analysis using 100% of their sample. Because most meta-analyses are conducted using a bare-bones analysis scheme, I used this technique to
reproduce the results of 2 of the 3 meta-analyses; therefore the main and moderator effects that I gathered from the medium and large scale meta-analyses were always compared to the uncorrected main and moderator effects reported by the original authors. This technique estimates the population correlation based on the following formula:
∑
∑
= i i i N r Nr [ ]
where Ni is the sample size of each individual study and ri is the effect size found in each
individual study. In addition, bare-bones meta-analysis estimates the meta-analytic variance based on the following formula:
∑
∑
− = i i i r N r r Ns [ ( ) ]
where Ni is the sample size of each individual study , ri is the effect size found in each
individual study, and ris the estimated population correlation (Hunter & Schmidt, 1990). In reproducing the results of the small scale meta-analysis, I employed the same technique that the original author used by employing MeanES, a SPSS macro created by Lipsey and Wilson (2001). During all stages and levels of sampling in each of the three meta-analyses, I
concluded that I had reproduced the results of the original meta-analysis if my analysis produced results that fell within a 99% confidence interval of the original meta-analytic results.
Moderator Analyses
In addition to determining the optimum percentage of random sampling for reproducing the main effects found in the original meta-analyses, I also investigated the optimum percentage of random sampling for reproducing one of the moderator effects found in each of the original meta-analyses. Because meta-analysts employ different methods of testing for homogeneity including the chi-square test and the 75% rule (Hunter & Schmidt, 1990; Mullen, 1989), my choice of homogeneity test depended on the method that was chosen by the original meta-analyst; all of the original analyses used the chi-square test. The formula for the chi-square test for homogeneity is as follows:
2 2 2 1 ) 1 ( r i K s r N − =
∑
2 − χwhere Ni is the sample size used in each individual study, ri is the effect size found in each
individual study, ris the meta-analytic effect size and sr2 is the variance of the meta-analysis. If the chi-square produced by this formula was not significant, I concluded that there was variation across studies due to moderator variables (Hunter & Schmidt, 1990).
Using this test for homogeneity, I determined whether the effect sizes at each level of sampling (75%, 50%, and 25%) were homogeneous or heterogeneous. If the results at each level indicated that the effect sizes were heterogeneous, I then conducted the same moderator analyses that were used in the original meta-analyses. As previously stated, moderator
whether the tests for homogeneity produced the same conclusions about the variance in effect sizes as were found in the original meta-analysis. In addition, when the homogeneity test indicated a lack of homogeneity, I investigated whether moderator analyses could reproduce the moderator results found in the original meta-analysis in each of the samples. I concluded that I had reproduced the results of the original meta-analysis if my analysis produced moderator results that feel within a 99% confidence interval of the original moderator findings.
Section III: Results Characteristics of Recently Published Meta-analyses
The I/O related meta-analyses had a higher average of included studies (µ = 59.97), and it appears that the I/O related meta-analyses also included a higher proportion of studies from unpublished sources than did the entire population; the average proportion of published studies used in the I/O related meta-analyses was 0.78.
Based on these results, I set the criteria for choosing a small, medium and large scale meta-analysis for reproduction that would be representative of those published in 2006. I chose to use the data gathered from the subset of I/O related meta-analyses in this decision for several reasons. The first reason was that I/O psychology is my field of study; therefore, I felt I would be better equipped to understand the theoretical underpinnings of meta-analyses that were conducted on I/O related topics. Secondly, because the use of random sampling may not be as appropriate when the population of relevant studies is small, I felt that random sampling would be more relevant in meta-analyses that included larger numbers of studies in the analysis. The data gathered indicated that the I/O related meta-analyses from 2006 included, on average, 20 more studies in their analysis than did the entire population; therefore, I felt random sampling in these meta-analyses would be more relevant to the purposes of this study. Finally, I chose to base my criteria on the data gathered from the I/O related meta-analyses because of their inclusion of larger proportions of unpublished studies. If, in fact, a publication bias does exist, random samples drawn from meta-analyses that were based on mostly published studies could provide biased effect sizes. This is because the population of studies could be relatively homogeneous in their level of statistical
studies could produce an effect size similar to the effect size that would be found using 100% of the studies, as the original population would presumably contain less variability. In
contrast, random sampling from both published and unpublished studies may be less likely to produce similar effect sizes, because the population would presumably contain more
variability.
The results obtained from the I/O related meta-analyses showed that the 25th
percentile of the distribution of included studies represented 14 studies. The 50th percentile represented 35 studies, and the 75th percentile represented 91 studies. I, therefore, sought to find three meta-analyses that corresponded to each of these percentiles. In addition, the results showed that 77.75% of the studies included in these meta-analyses were published. Therefore, I also set the criteria for the proportion of published studies included in the 3 meta-analyses chosen for reproduction to be within 1 standard deviation (SD = 0.25) of the average proportion of published studies included in the I/O related meta-analyses from 2006. Meta-analyses Chosen for Reproduction
proportion of published studies included (0.86) was within one standard deviation of the average proportion of published studies included in the I/O related meta-analyses from 2006.
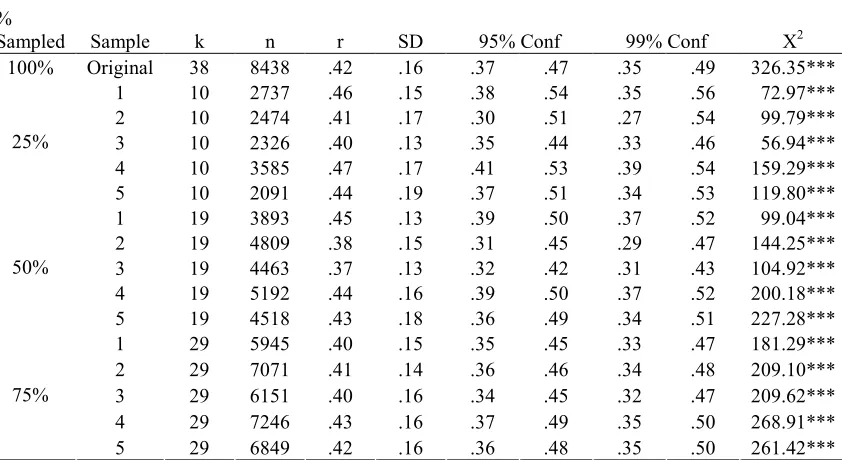
Medium size meta-analysis. The second meta-analysis that I choose for reproduction was Riketta and Van Dick’s (2005) meta-analysis on the effects of organizational and team attachment; as part of their analysis, the authors calculated an effect size between
organizational attachment and team attachment. For the purposes of my analysis, I focused specifically on this relationship, which was investigated using 38 studies, of which 28 were obtained from published sources. This study fit my criteria for a medium size meta-analysis well; the number of studies included in the analysis was similar to the 50th percentile (35 studies) of the distribution of included studies in the I/O related meta-analyses from 2006. In addition, the proportion of published studies included (0.7368) was within 1 standard
deviation of the average proportion of published studies included in the I/O related meta-analyses from 2006.
Main Effect Size Reproduction
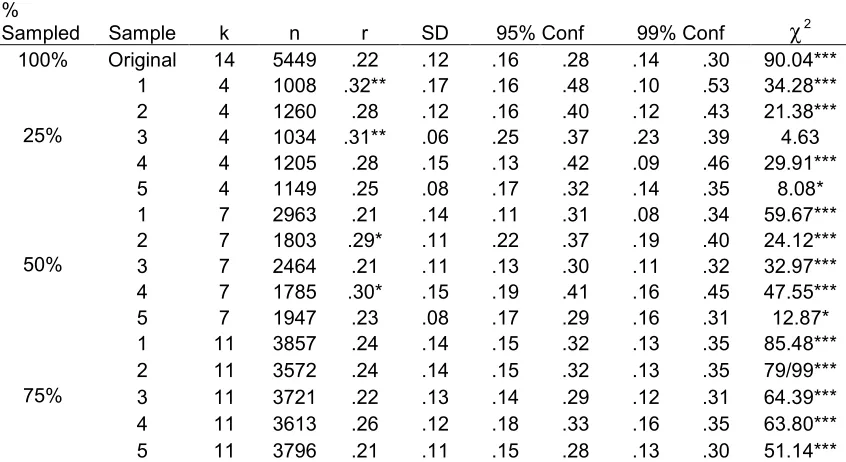
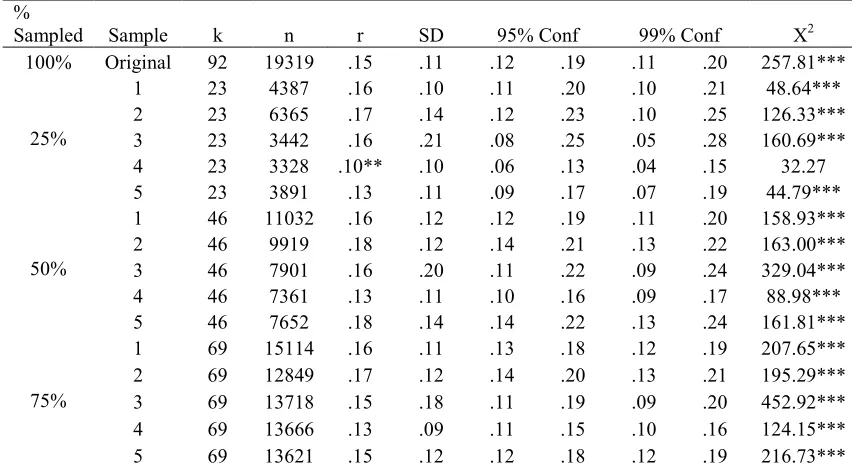
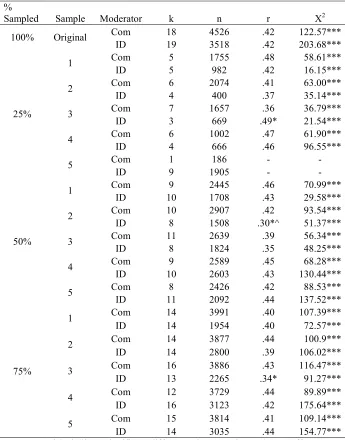
Five random samples were drawn from the population of studies in each of the three meta-analyses chosen for reproduction. From these random samples, approximately 25%, 50%, and 75%1 of the studies used in the original analysis were used to reproduce each meta-analytic main effect size. Tables 2, 3, and 4 present the results of these investigations.
The absolute difference between the effect sizes produced by each sample and the original effect sizes from each of the 3 meta-analyses ranged from 0.00 to 0.10. The differences between the effect size reported in Underhill’s (2006) original analysis and the ones produced by each sample ranged from 0.00 to 0.10. The differences between the effect sizes produced by each sample and that reported by Riketta and Van Dick (2005) ranged from 0.00 to 0.05. Finally, the range of differences between the effect sizes produced by each sample and that reported by Combs et al. (2006) was 0.00 to 0.05.
with the largest difference being 0.05. Four out of 5 of these samples reproduced Combs et al.’s (2006) effect size at an alpha level of both 0.05 and 0.01.
50% sampling. Thirteen of the 15 random samples reproduced the original effect sizes at the 50% level of sampling. The average absolute difference between the effect sizes produced by the 5 samples drawn from the small meta-analysis and the effect size reported in the original analysis was 0.04, with the largest difference being 0.08. In addition, 3 out of the 5 samples reproduced Underhill’s (2006) effect size at an alpha level of 0.05 and all of the 5 samples reproduced Underhill’s (2006) effect size at an alpha level of 0.01. The average difference between the samples drawn from the medium sized meta-analysis and that produced by the original analysis was 0.03, with the largest difference being 0.05. All 5 of these samples reproduced Riketta and Van Dick’s (2005) effect size at an alpha level of both 0.05 and 0.01. Finally, the average difference between the effect size produced by the
samples drawn from the large meta-analysis and the effect size reported in the original analysis was 0.02, with the largest difference being 0.03. All of these samples reproduced Combs et al.’s (2006) effect size at an alpha level of both 0.05 and 0.01.
75% sampling. All of the 15 random samples reproduced the original effect sizes at an alpha level of both 0.05 and 0.01. The average absolute difference between the effect sizes produced by the 5 samples drawn from the small scale meta-analysis and that produced by the original analysis was 0.02, with the largest difference being 0.04. The average difference between the effect sizes produced by the samples drawn from the medium sized
samples drawn from the large scale meta-analysis and the effect produced in the original analysis was 0.01, with the largest difference being 0.02.
Percentage of sampling necessary for accurate results. A comparison of the results from the main effect analyses using the random samples from each of the 3 meta-analyses provides an answer to both research questions 2 and 3, which asked about the percentage of random sampling necessary to produce accurate main effect results. Based on my findings, it appears that the percentage of randomly sampled studies that is necessary to produce
accurate main effect size estimates does not vary as a function of the size of the population of studies that fit the inclusion criteria. The results indicated that in both small and large scale meta-analyses, random samples composed of at least 50% of the studies that fit the inclusion criteria produced accurate main effects. The medium sized meta-analysis indicated that random samples composed of at least 26.32% of the studies produce accurate main effects; however, because the large scale meta-analysis did not indicate that this lower percentage of sampling could reproduce the effect size, it appears that the population size is not important in producing accurate main effect sizes. Instead, it appears that meta-analyses that use random samples composed of at least 50% of the studies that fit the inclusion criteria will produce accurate main effect size estimates.
Homogeneity Tests
25% sampling. Three of the 5 samples drawn from the small scale meta-analysis reproduced the significant χ2 at an alpha level of 0.005; in addition, 4 of these were
significant at an alpha level of 0.05. All of the 5 samples drawn from the medium sized meta-analysis reproduced the significant χ2, and 4 of the 5 random samples drawn from the large scale meta-analysis reproduced the significant χ2.
50% sampling. Four of the 5 samples drawn from the small scale meta-analysis confirmed the significant χ2 at an alpha level of 0.005, and all of the samples confirmed the significant χ2 at an alpha level of 0.05. All of the 5 samples drawn from the medium sized meta-analysis and from the large scale meta-analysis confirmed the significant χ2.
75% sampling. All of the samples from each of the meta-analyses reproduced the original significant χ2 results at this level of sampling.
Percentage of sampling necessary for accurate homogeneity test results. Therefore, it appears that in small scale meta-analyses, random sampling will produce accurate
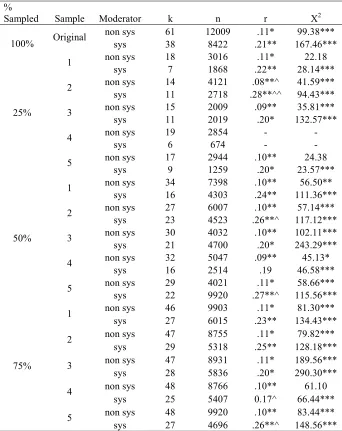
Moderator Analysis
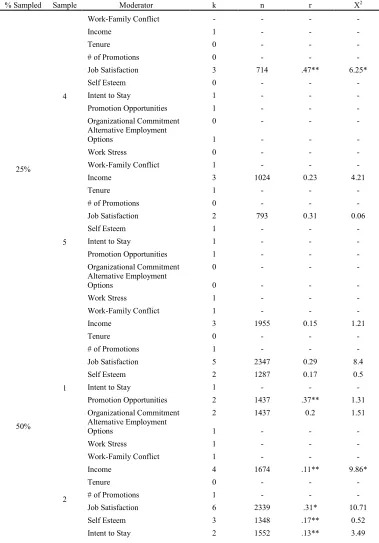
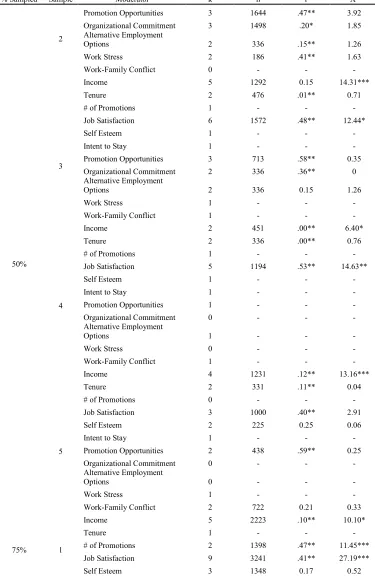
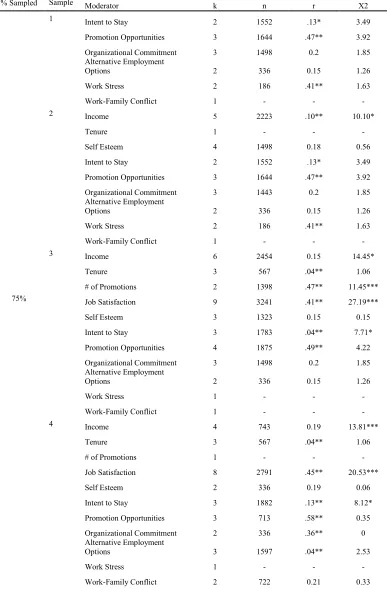
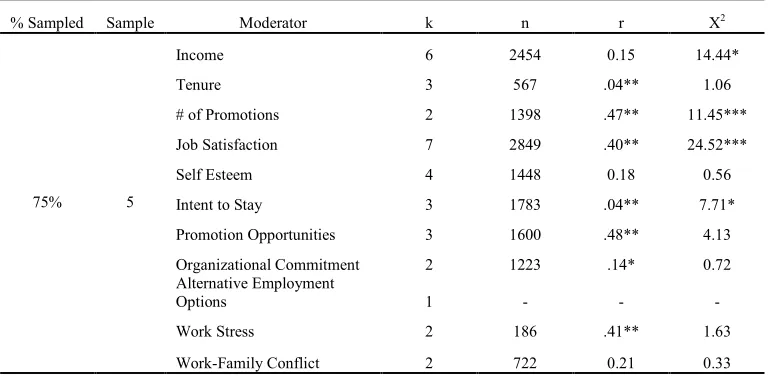
The random samples that produced significant χ2 values indicated that moderators of the main effect relationship might exist; therefore, these samples were further investigated using the authors’ original moderator codes. Underhill (2006) investigated whether the effects of being involved in a mentoring relationship varied by the particular outcome being studied; specifically, she investigated whether the effect varied across a variety of outcomes, including income, tenure, number of promotions, job satisfaction, self esteem, intent to stay, promotion/career advancement opportunities, organizational commitment, perceived
alternative employment opportunities, work stress, and work-family conflict. It should be noted that because Underhill (2006) used 11 different subgroups in this moderator, none of the random samples was able to provide enough individual effect sizes to test for every type of outcome; however, every random sample did provide enough individual effect sizes to test whether or not at least one of the outcomes was a moderator. In total, 81 of the possible 154 moderator tests were performed. In contrast, Riketta and Van Dick (2005) did not report any moderator tests for their main effect results between organizational attachment and team attachment in the write up of their analysis; however, an examination of their coding sheet provided a moderator code that could be used to test the effects of random sampling on moderator results in this meta-analysis. The authors coded each effect size by the
operationalization of both the organizational attachment construct and the team attachment construct. The constructs were either operationalized using a measure of organizational/team identification or they were operationalized using a measure of organizational/team
performance work practices and actual performance was moderated by the systematic nature of the work practice; that is, they dichotomously coded the studies into either an individual practice category or a systematic practice category to indicate the scale of the implementation of the work practices.
I first tested each of these moderators with 100% of the included studies in each of the meta-analyses; in the case of the medium sized meta-analysis, the results of this test were used to provide the comparison for the moderator effects produced by each random sample. Next, I used the moderator codes provided by the authors of each of the meta-analyses to test each random sample at each level of sampling. Tables 5, 6, and 7 present the results of these tests.
25% sampling. Three of the 5 moderator effects produced using Underhill’s (2006) studies reproduced her significant moderator findings and none of these were significantly different than the moderator effects produced in her original analysis. In addition, 4 of the 5 homogeneity tests of the subsamples produced by Underhill’s (2006) moderator codes were erroneously nonsignificant. Three of the 5 random samples drawn from the medium sized meta-analysis reproduced Riketta and Van Dick’s (2005) original nonsignificant moderator finding; however, 1 of these samples was not tested for moderator differences, because, by chance, it only included one study that used commitment as its operationalization. In addition, all of the 8 subsamples created from the 2 moderators produced accurate
moderator findings; 1 of the moderator effects obtained was significantly different from that produced by their population at an alpha level of 0.01 and another of the effects was
significantly different at an alpha level of 0.05. Two of the 8 subsamples produced erroneously nonsignificant χ2 values.
50% sampling. Four of the 28 moderator effects produced using 50% of Underhill’s (2006) studies failed to reproduce her significant moderator findings. In addition, 3 of the 28 moderator effects erroneously indicated that the specific outcome being tested was a
significant moderator when the original analysis had not indicated significance. None of the moderator effects was significantly different from those produced by the original analysis; 5 of the 28 χ2s were erroneously nonsignificant. Additionally, 4 of the 5 random samples drawn from Riketta and Van Dick’s (2005) meta-analysis reproduced their nonsignificant moderator finding and 1 of the 5 samples produced a moderator effect that was significantly different from the moderator effect produced by the original analysis at an alpha level of 0.05. All of the χ2s produced by each of the moderator subsamples reproduced Riketta and Van Dick’s (2005) significant findings. Finally, all of the 5 random samples drawn from the large scale meta-analysis reproduced Combs et al.’s (2006) original moderator findings, indicating that the moderator was significant, but 2 of these moderator effects were significantly different from the moderator effects produced in the original analysis at an alpha level of 0.05. One of the 10 homogeneity tests of the subsamples produced an erroneously nonsignificant χ2.
original analysis did not. None of the moderator effects was significantly different from the ones produced by the population. Additionally, 3 of the 45 χ2s produced by the homogeneity tests of the subsamples were erroneously nonsignificant. Four of the 5 random samples drawn from the medium sized meta-analysis reproduced the original nonsignificant moderator findings; none of the effect sizes was significantly different than the moderator effect sizes produced by the population of studies. In all cases, the χ2 test for homogeneity indicated heterogeneity of the effect sizes based on the moderator subsamples, as was found using 100% of the studies for each subsample. Finally, all of the 5 random samples drawn from the large scale meta-analysis reproduced Combs et al.’s (2006) significant moderator findings; however, 2 of these produced effect sizes that were significantly different than those produced by the population. Additionally, 1 χ2 produced by the homogeneity tests was erroneously nonsignificant.
relationship. Therefore, it appears that random sampling in large scale meta-analyses does produce accurate moderator results when the sample is composed of at least 50% of the studies that fit the inclusion criteria.
Section IV: Discussion
This study sought to investigate the effects of random sampling in meta-analysis. In order to explore this possibility, I first examined all of the meta-analyses in the PsychINFO database that were published in 2006 to determine the average number of studies that were included in these analyses, as well as the proportion of these studies that were published. In addition, I compared the population of meta-analyses retrieved from PsychINFO to the population of I/O related meta-analyses that were retrieved. This comparison showed that the I/O related analyses included more studies and a smaller proportion of published studies on average than the full population of meta-analyses did.
The results of this examination were used to choose three previously conducted meta-analyses for further examination of the use of random sampling; specifically, a small,
medium, and large scale meta-analysis were chosen. Five random samples were drawn from each analysis and these samples were then used to determine if the results of each meta-analysis could be reproduced using approximately 25%, 50%, and 75% of the studies that were included in the original analysis.
These examinations provide preliminary support for the use of random sampling in meta-analysis. In almost all of the random samples drawn from the three previously
Finally, in a majority of the random samples drawn, the moderator results obtained in the original meta-analyses were reproduced.
Limitations and Future Research
While this study provided promising findings, there are several limitations that should be addressed by future researchers. First, while I did weight individual effect sizes by sample size, I did not apply any of the more sophisticated corrections that meta-analysts often use to control for study artifacts, such as corrections for range restriction or unreliability; therefore, the results of this study may not apply in cases where meta-analysts apply these types of corrections. Future research should investigate how or if the use of random sampling may differ in meta-analyses that use these types of corrections.
In addition, because it was impossible to investigate the effects of random sampling in all of the diverse kinds of meta-analyses that are regularly conducted, only three
previously conducted meta-analyses were used in this investigation; they were chosen based on their similarities to the I/O related meta-analyses published in 2006. For this reason, the results of this study may not apply to other kinds of meta-analyses that have differing characteristics; however, because these meta-analyses were chosen based on their
representativeness, it is hoped that the results of this study are generalizable. Future research should investigate the effects of random sampling in meta-analyses in which different numbers and proportions of published studies fit the inclusion criteria for the analysis.
Another limitation of this study stems from the moderator analyses conducted. The moderator variables from both the medium and the large scale meta-analysis were
levels. It is possible that the effects of random sampling on meta-analytic moderator results may vary as a function of the number of levels of the moderator variable that is studied, which may explain why the moderator results were more accurate for the 2 meta-analyses that had dichotomous moderator variables. Future research should investigate this possibility. In addition, all of the moderator variables investigated were categorical; future research should investigate whether random sampling can or should be applied when moderator variables are on an ordinal, interval or ratio scale. The strengths of the moderators investigated were diverse; the medium sized meta-analysis provided a moderator investigation that did not yield significant moderator results, while the other two
meta-analyses provided an investigation that did yield significant findings. It was important to pick a range of moderators in order to make this investigation as complete as possible; however, future research should continue to investigate whether the effects of random sampling on moderator results varies as a function of the size or the strength of the moderator. Finally, all the moderator analyses conducted used subgrouping to test for effects; future research should investigate how random sampling could affect moderator results in meta-analyses that
employ regression techniques. Implications
samples and that of the population of studies in the small scale meta-analysis was 0.10; the biggest difference between the effect sizes produced by the random samples and that
produced by the population of studies from the medium sized and from the large scale meta-analysis was 0.05. While a few of these differences did reach statistical significance, it could be argued that a difference of 0.05 is not practically significant. The random samples drawn also reproduced the results of the original homogeneity tests in almost all cases, with the exception of 2 samples that included approximately 25% of the studies from the original meta-analyses. Finally, the random samples were also quite successful at reproducing the original moderator results in the large scale meta-analysis. Random sampling also reproduced the original moderator results from the medium sized meta-analysis in almost all cases; however, the exceptions are of concern.
The random samples drawn from the small scale meta-analysis were the least
effective at reproducing the original meta-analytic results; however, with only 14 studies, the amount of work associated with the analysis is minimal, therefore, the use of random
meta-analyses, random samples composed of at least 50% of the studies that fit the inclusion criteria will produce accurate homogeneity test results.
Finally the results of this investigation showed that in the majority of random samples drawn from each of the meta-analyses, the same moderator conclusions would be made as were made in the original analysis. All of the moderator analyses from the large scale meta-analysis reproduced the significant moderator findings of the original meta-analysis. Most of the moderator analyses from the medium sized meta-analysis reproduced the nonsignificant moderator findings of the original analysis; however, the cases that did not reproduce these findings are of concern. Future analysts should exert caution when drawing conclusions based on moderator results from random samples, as these results may not be accurate. Based on these findings, it appears that moderator analyses based on random samples should only be used when the population of studies is large (>92 studies) and the random sample is composed of at least 50% of the studies that fit the analyst’s inclusion criteria.
Section V: Conclusion
References
Abrami, P.C., Cohen, P.A., & d’Apollonia, S. (1988). Implementation problems in meta- analysis. Review of Educational Research, 58, 151-179.
Arthur, W., Jr., Winston, B., Jr., & Huffcutt, A.I. (2001). Conducting meta-analysis using SAS. Mahwah, NJ: Lawrence Erlbaum Associates.
Berk, R.A. (in press). Statistical Inference and Meta-Analysis. Journal of Experimental Criminology.
Berk, R.A. & Freedman, D.A. (2003). Statistical assumptions as empirical commitments. In T. G. Blomberg and S. Cohen (Eds.) Law, Punishment, and Social Control: Essays in Honor of Sheldon Messinger (2nd ed., pp. 235-254).
Combs, J., Liu, Y., Hall, A., & Ketchen, D. (2006). How much do high-performance work practices matter? A meta-analysis of their effects on organizational performance. Personnel Psychology, 59(3), 501-528.
Cooper, H.M. (1984). The integrative researcher review. In L. Brickmann & D. Rog (Series Eds.), Applied social research methods series (Vol. 2). Beverly Hills, CA: Sage. Desu, M.M., & Raghavarao, D. (1990). Sample size methodology. San Diego, CA:
Academic.
Glass, G.V., McGaw, B., & Smith, M.L. (1981). Meta-analysis in social research. Beverly Hills, CA: Sage.
Guzzo, R.A., Jackson, S.E., & Katzell, R.A. (1987). Meta-analysis analysis. Research in Organizational Behavior, 9, 407-442.
Hedges, L.V., & Olkin, I. (1985). Statistical methods for meta-analysis. Orlando, FA: Academic Press.
Hunter, J.E., & Schmidt, F.L. (1990). Methods of meta-analysis. Newbury Park, CA: Sage. Hunter, J.E., Schmidt, F.L., & Jackson, G.B. (1982). Meta-analysis: Cumulating research
findings across studies. Beverly Hills, CA: Sage.
Judge, T. A., Thoresen, C. J., Bono, J. E., & Patton, G. K. (2001). The job satisfaction-job performance relationship: A qualitative and quantitative review. Psychological bulletin, 127(3), 376-407.
Keith, T. Z. (2006). Multiple regression and beyond (S. Hartman, T. Felser & K. Natale, Eds.). Boston: Pearson Education.
Lipsey, M.W. (1992). Juvenile delinquency treatment: A meta-analytic inquiry into the variability of effects. In Cook, T.D., Cooper, H., Cordray, D.S., Hartmann, H., Hedges, L.V., Light, R.J. et al. (Eds.), Meta-analysis for explanation (pp. 83-128). New York: Russell Sage Foundation.
Mullen, B. (1989). Advanced BASIC meta-analysis. Hillsdale, NJ: Lawrence Erlbaum Associates.
Ott, R.L., & Longnecker, M. (2001). An introduction to statistical methods and data analysis (5th ed.). Pacific Grove, CA: Duxbury Thomson Learning.
Overton, R.C. (1998). A comparison of fixed-effects and mixed (random-effects) models for meta-analysis tests of moderator variable effects. Psychological Methods, 3, 354-379.
Riketta, M., & Van Dick, R. (2005). Foci of attachment in organizations: A meta-analytic comparison of the strength and correlates of workgroup versus organizational
identification and commitment. Journal of Vocational Behavior, 67(3), 490-510.
Rosenthal, R. & Rubin, D.B. (1978). Interpersonal expectancy effects: The first 345 studies. Behavioral and Brain Sciences, 1, 377-415.
Shadish, W.R. (1992). Do family and marital psychotherapies change what people do? A meta-analysis of behavioral outcomes. . In Cook, T.D., Cooper, H., Cordray, D.S., Hartmann, H., Hedges, L.V., Light, R.J. et al. (Eds.), Meta-analysis for explanation (pp. 129-208). New York: Russell Sage Foundation.
Shadish, W.R., Cook, T.D., & Campbell, D.T. (2002). Experimental and quasi-experimental design for generalized causal inference. Boston: Houghton Mifflin.
Wachter, K.W., & Straf, M.L. (1990). The future of meta-analysis. New York: Russell Sage Foundation.
Footnotes 1
Table 1
Descriptive Statistics for the Meta-Analyses Published in 2006
# of
Meta-analyses Minimum
25th Percentile
50th Percentile
75th
Percentile Maximum
Proportion Published
Entire
Population 283 3 13 24 45 526 0.9026
I/O Related
Table 2
Main Effects Found in Each Sample from Underhill’s (2006) Meta-analysis
%
Sampled Sample k n r SD 95% Conf 99% Conf χ 2
100% Original 14 5449 .22 .12 .16 .28 .14 .30 90.04***
1 4 1008 .32** .17 .16 .48 .10 .53 34.28***
2 4 1260 .28 .12 .16 .40 .12 .43 21.38***
3 4 1034 .31** .06 .25 .37 .23 .39 4.63
4 4 1205 .28 .15 .13 .42 .09 .46 29.91***
25%
5 4 1149 .25 .08 .17 .32 .14 .35 8.08*
1 7 2963 .21 .14 .11 .31 .08 .34 59.67***
2 7 1803 .29* .11 .22 .37 .19 .40 24.12***
3 7 2464 .21 .11 .13 .30 .11 .32 32.97***
4 7 1785 .30* .15 .19 .41 .16 .45 47.55***
50%
5 7 1947 .23 .08 .17 .29 .16 .31 12.87*
1 11 3857 .24 .14 .15 .32 .13 .35 85.48***
2 11 3572 .24 .14 .15 .32 .13 .35 79/99***
3 11 3721 .22 .13 .14 .29 .12 .31 64.39***
4 11 3613 .26 .12 .18 .33 .16 .35 63.80***
75%
5 11 3796 .21 .11 .15 .28 .13 .30 51.14***
Note. Asterisks (*) by main effects indicate that the effect produced by the random sample was significantly
different than the main effect found in the population. Asterisks (*) by χ 2 results indicated the χ 2 was
significantly different than 0.
Table 3
Main Effects Found in Each Sample from Riketta and Van Dick’s (2005) Meta-analysis
%
Sampled Sample k n r SD 95% Conf 99% Conf Χ2
100% Original 38 8438 .42 .16 .37 .47 .35 .49 326.35***
1 10 2737 .46 .15 .38 .54 .35 .56 72.97***
2 10 2474 .41 .17 .30 .51 .27 .54 99.79***
3 10 2326 .40 .13 .35 .44 .33 .46 56.94***
4 10 3585 .47 .17 .41 .53 .39 .54 159.29***
25%
5 10 2091 .44 .19 .37 .51 .34 .53 119.80***
1 19 3893 .45 .13 .39 .50 .37 .52 99.04***
2 19 4809 .38 .15 .31 .45 .29 .47 144.25***
3 19 4463 .37 .13 .32 .42 .31 .43 104.92***
4 19 5192 .44 .16 .39 .50 .37 .52 200.18***
50%
5 19 4518 .43 .18 .36 .49 .34 .51 227.28***
1 29 5945 .40 .15 .35 .45 .33 .47 181.29***
2 29 7071 .41 .14 .36 .46 .34 .48 209.10***
3 29 6151 .40 .16 .34 .45 .32 .47 209.62***
4 29 7246 .43 .16 .37 .49 .35 .50 268.91***
75%
5 29 6849 .42 .16 .36 .48 .35 .50 261.42***
Note. Asterisks (*) by main effects indicate that the effect produced by the random sample was significantly
different than the main effect found in the population. Asterisks (*) by χ 2 results indicated the χ 2 was
significantly different than 0.
Table 4
Main Effects Found in Each Sample from Combs et al.’s (2006) Meta-analysis
%
Sampled Sample k n r SD 95% Conf 99% Conf Χ2
100% Original 92 19319 .15 .11 .12 .19 .11 .20 257.81***
1 23 4387 .16 .10 .11 .20 .10 .21 48.64***
2 23 6365 .17 .14 .12 .23 .10 .25 126.33***
3 23 3442 .16 .21 .08 .25 .05 .28 160.69***
4 23 3328 .10** .10 .06 .13 .04 .15 32.27
25%
5 23 3891 .13 .11 .09 .17 .07 .19 44.79***
1 46 11032 .16 .12 .12 .19 .11 .20 158.93***
2 46 9919 .18 .12 .14 .21 .13 .22 163.00***
3 46 7901 .16 .20 .11 .22 .09 .24 329.04***
4 46 7361 .13 .11 .10 .16 .09 .17 88.98***
50%
5 46 7652 .18 .14 .14 .22 .13 .24 161.81***
1 69 15114 .16 .11 .13 .18 .12 .19 207.65***
2 69 12849 .17 .12 .14 .20 .13 .21 195.29***
3 69 13718 .15 .18 .11 .19 .09 .20 452.92***
4 69 13666 .13 .09 .11 .15 .10 .16 124.15***
75%
5 69 13621 .15 .12 .12 .18 .12 .19 216.73***
Note. Asterisks (*) by main effects indicate that the effect produced by the random sample was significantly
different than the main effect found in the population. Asterisks (*) by χ 2 results indicated the χ 2 was
significantly different than 0.
Table 5
Moderation Results from Each Sample of Underhill’s (2006) Meta-analysis %
Sampled Sample Moderator k n r Χ2 Income 6 2454 .15* 14.45*
Tenure 3 567 .04** 1.06
# of Promotions 2 1398 .47** 11.45*** Job Satisfaction 10 4502 .39** 28.25*** Self Esteem 4 1448 0.18 0.56 Intent to Stay 4 3044 .10** 10.79* Promotion Opportunities 4 1875 .49** 4.22 Organizational Commitment 3 1498 0.2 1.85 Alternative Employment
Options 3 1597 .04** 2.53 Work Stress 2 186 .41** 1.63 100% Original
Work-Family Conflict 2 722 0.21 0.33
Income 0 - - -
Tenure 0 - - -
# of Promotions 0 - - - Job Satisfaction 2 392 0.47 2.2
Self Esteem 1 - - -
Intent to Stay 0 - - -
Promotion Opportunities 1 - - - Organizational Commitment 1 - - - Alternative Employment
Options 1 - - -
Work Stress 1 - - -
1
Work-Family Conflict 0 - - -
Income 1 - - -
Tenure 0 - - -
# of Promotions 0 - - - Job Satisfaction 3 909 0.27 0.33
Self Esteem 1 - - -
Intent to Stay 1 - - -
Promotion Opportunities 1 - - - Organizational Commitment 1 - - - Alternative Employment
Options 1 - - -
Work Stress 1 - - -
2
Work-Family Conflict 0 - - -
Income - - - -
Tenure - - - -
# of Promotions - - - - Job Satisfaction - - - -
Self Esteem - - - -
Intent to Stay - - - -
Promotion Opportunities - - - - Organizational Commitment - - - - Alternative Employment
Options - - - -
Work Stress - - - -
25%