Electronic Thesis and Dissertation Repository
2-2014 12:00 AM
Micro-Computed Tomography Semi-Empirical Beam Hardening
Micro-Computed Tomography Semi-Empirical Beam Hardening
Correction: Method And Application To Meteorites
Correction: Method And Application To Meteorites
David R. Edey
The University of Western Ontario
Supervisor
Roberta Flemming
The University of Western Ontario Joint Supervisor David Holdsworth
The University of Western Ontario Graduate Program in Geology
A thesis submitted in partial fulfillment of the requirements for the degree in Master of Science © David R. Edey 2014
Follow this and additional works at: https://ir.lib.uwo.ca/etd
Part of the Geology Commons
Recommended Citation Recommended Citation
Edey, David R., "Micro-Computed Tomography Semi-Empirical Beam Hardening Correction: Method And Application To Meteorites" (2014). Electronic Thesis and Dissertation Repository. 2000.
https://ir.lib.uwo.ca/etd/2000
This Dissertation/Thesis is brought to you for free and open access by Scholarship@Western. It has been accepted for inclusion in Electronic Thesis and Dissertation Repository by an authorized administrator of
Thesis format: Integrated Article
by
David Ryan Edey
Graduate Program in Geology
A thesis submitted in partial fulfillment of the requirements for the degree of
Master of Science
The School of Graduate and Postdoctoral Studies The University of Western Ontario
London, Ontario, Canada
ii
Abstract
X-ray micro-computed tomography (µCT) is able to non-destructively provide high-resolution 3D images of the internal structures of dense materials such as meteorites. The widespread availability of instruments capable of biomedical micro-computed tomography means there is ample access to scanners for the investigation of geomaterials, but the scan data can be susceptible to artifacts such as beam hardening, a consequence of high X-ray attenuation in these dense materials.
A semi-empirical correction method for beam hardening and scatter that can be straightforwardly applied to available biomedical scanners is proposed and evaluated. This method uses aluminum as a single calibration material to significantly reduce or remove signal intensity errors (i.e. cupping) that occur as a result of beam hardening artifacts. X-ray transmission data are linearized using custom software. Results show that it is possible through careful analysis to determine an effective method of artifact correction for specified protocols using this implementation.
Following correction and validation, this technique is applied to imaging of meteorite samples. Four meteorites are examined using µCT in combination with this processing technique: Three ordinary chondrites (Grimsby, Gao-Guenie, and Ozona) and an olivine diogenite (NWA 5480). Information from µCT is compared to that of traditional methods of analysis of meteoritic samples, and the advantages and disadvantages are discussed.
iii
Acknowledgments
First I would like to thank my supervisors. David, thank you for taking me in and offering your mentorship, wealth of knowledge and resources to allow me to do this research. Robbie, thank you providing both professional and personal support over the many years, countless coffee breaks and much needed beer breaks, thanks for everything.
Phil, you basically become a third supervisor, something you didn’t need to do. Thank you for all the professional and person support, ideas, and great games nights.
Thanks to everyone in the Robarts lab, you made my day much less productive and lunch breaks much longer, thanks for that. Much thanks to the crew: Adam P, Chris N, Dan L, Dave M, Hristo N, Ivalio P, Jacques M, Jacques M, Justin T, Kevin B, Kim B, Maria D, Steve P, Zing-Bot.
To Robbie’s lab, thanks for listening to me ramble about weird x-ray science and providing much needed feedback. Alex R, Beth D, Jared S, Jeff B, Josh H, Matt I, Mike C, Mike B, Patrick S.
Tim Officer, Laura Sanchez, Jess Stromberg, thanks for being the easiest to convince to go get a beer, the on and off topic discussions, and the late nights.
Simon Deluce and CJ Vitanza thanks for all the support in everything I do, for the advice, ideas, and great times. Thanks for losing at Catan all the time; it made me feel more accomplished even when I wasn’t.
Grace, thank you for being yourself and supporting me though this entire process.
To my Brother, Mike, for everything, ever.
To my parents, Myra and Thomas Edey, for without you I wouldn’t be here, in every step along the way you have provided me with countless opportunities to do what ever I wanted to.
iv
The sun, with all those planets revolving around it and dependent on it,
can still ripen a bunch of grapes as if it had nothing else in the universe
to do.
v
Table of Contents
Abstract ... ii
Acknowledgments ... iii
Table of Contents ... v
List of Tables ... viii
List of Figures ... ix
Chapter 1 ... 1
1 Introduction ... 1
1.1 Meteoritics ... 1
1.2 Micro-Computed Tomography ... 5
1.2.1 Beam Hardening ... 7
1.3 Micro-Computed Tomography of Geomaterials ... 10
1.4 Scope of Thesis ... 11
1.5 References ... 12
Chapter 2 ... 15
Co-Authorship Statement ... 15
2 Extended dynamic range micro-computed tomography of geomaterials using a biomedical scanner ... 15
2.1 Introduction ... 15
2.2 Methods... 17
2.2.1 Theoretical basis of the correction algorithm ... 17
2.2.2 Biomedical micro-CT scanners ... 19
2.2.3 Calibration phantom ... 20
2.2.4 Data analysis ... 21
vi
2.3 Results ... 25
2.3.1 Calibration data ... 25
2.3.2 Reconstruction analysis ... 27
2.3.2.1 PMMA samples ... 29
2.3.2.2 Aluminum samples ... 32
2.4 Discussion ... 34
2.4.1 GE eXplore speCZT ... 35
2.4.2 GE Locus Ultra ... 36
2.4.3 Summary, limitations, and future work ... 37
2.5 Conclusion ... 41
2.6 References ... 42
Chapter 3 ... 43
Co-Authorship Statement ... 43
3 Phase recognition and volumetric analysis of meteoritic samples using laboratory micro-computed tomography ... 43
3.1 Introduction ... 43
3.2 Methods... 46
3.2.1 Equipment and software ... 46
3.2.1.1 LEO 440 SEM ... 46
3.2.1.2 Micro X-Ray diffraction ... 46
3.2.1.3 Biomedical micro-CT scanners ... 47
3.2.1.4 Beam hardening correction ... 47
3.2.1.5 Olympus STM6 measuring microscope ... 48
3.2.2 Sample analysis ... 48
vii
3.2.3 Selection of meteoritic specimens ... 48
3.3 Results ... 49
3.3.1 Ozona ... 49
3.3.2 Gao-Guenie ... 50
3.3.3 Grimsby... 54
3.3.4 NWA 5480 ... 61
3.4 Discussion ... 67
3.4.1 Ozona ... 67
3.4.2 Gao-Guenie ... 68
3.4.3 Grimsby... 69
3.4.4 NWA 5480 ... 70
3.4.5 Summary, limitations, and future work ... 71
3.5 Conclusion ... 71
3.6 References ... 73
Chapter 4 ... 76
4 Conclusions and Future Directions ... 76
4.1 Summary of Results ... 76
4.2 Future Work ... 78
4.2.1 CT Calibration of Mineralogy ... 78
4.2.2 Dual-Energy CT ... 78
4.2.3 Industrial Scanner Calibration ... 79
4.3 References ... 80
viii
List of Tables
Table 2.1 - Formulas and coefficients of determination for each fitting parameters. ... 25
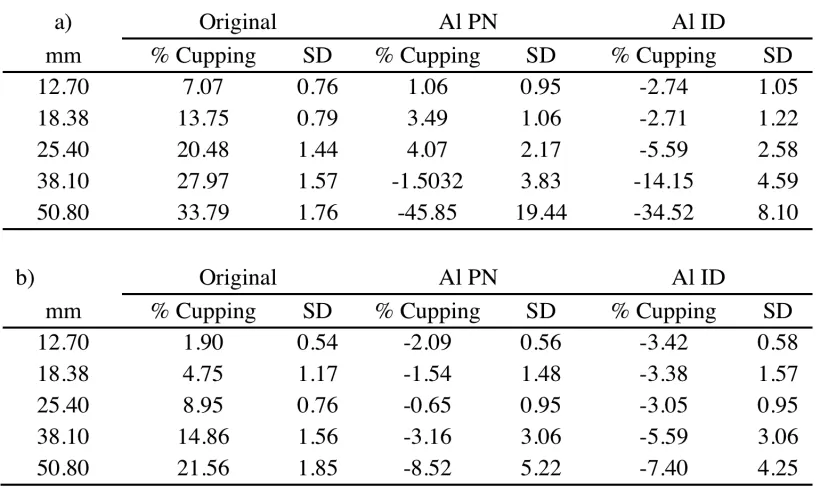
Table 2.2 - Average and standard deviation of percent cupping in PMMA data described by equation 3, for CT scanners a) speCZT and b) Ultra. ... 28
Table 2.3 - Average and standard deviation of percent cupping in aluminum data described by equation 3, for CT scanners a) speCZT and b) Ultra. ... 28
Table 2.4 - Volumetric Analysis for Corrected and Uncorrected Gao Guenie Sample. ... 40
Table 3.1 - Volumetric Analysis of Ozona ... 50
Table 3.2 - Volumetric Analysis of Gao-Guenie ... 54
Table 3.3 - Volumetric Analysis of Grimsby ... 58
Table 3.4 - Mineral Phases in NWA 5480 by µXRD ... 63
ix
List of Figures
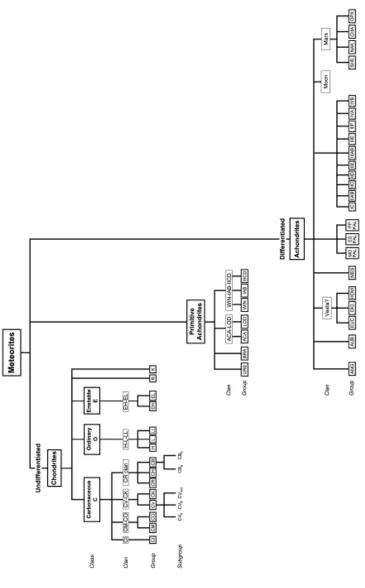
Figure 1.1 - Diagram expressing the systematics of meteorite classification. Showing the major meteorite divisions. (Weisberg et al., 2006) ... 4
Figure 1.2 - GE eXplore speCZT. Located at the Robarts Research Institute, this scanner was utilized for both testing of beam hardening correction as well as collection of volumetric meteoritic data. ... 6
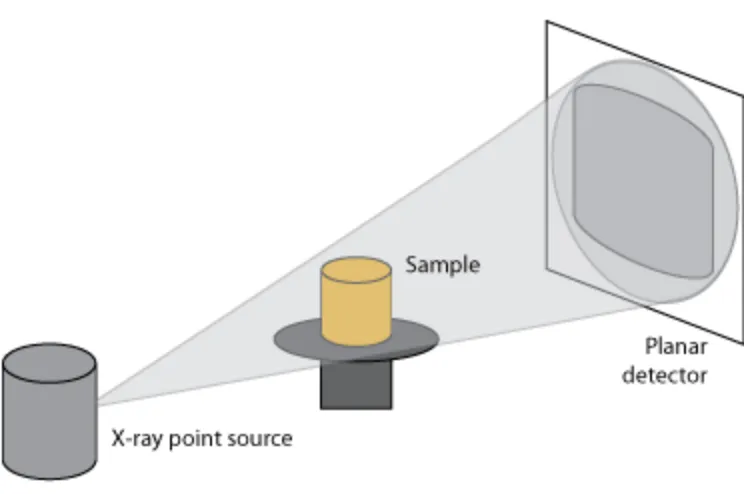
Figure 1.3 - Cone beam CT scanning configuration. To provide multiple projection angles, the sample or the source and detector are rotated around an axis (adapted from
http://serc.carleton.edu/research_education/geochemsheets/techniques/CT.html) ... 7
Figure 1.4 - Idealized X-ray tube spectrum. X-ray spectrum prior to and after filteration thought 1.3 cm of aluminium. ... 8
Figure 1.5 – Artifacts in CT caused by hardening of the beam. a) cupping, or artificially lower density reported in the center of a homogeneous rod of aluminum, and b) streaking, or artificially high and low density streaks reported between two objects with significantly higher density than their surrounding. ... 9
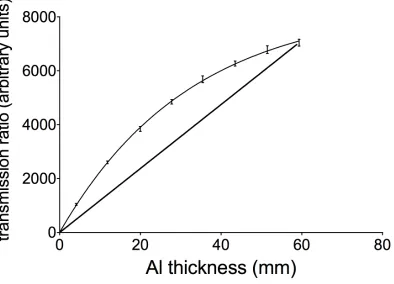
Figure 2.1 - Plot of transmission vs. thickness for aluminum calibrator. CT scans of the aluminium calibrator were completed on the speCZT at 90 kVp and 40 mA. This plot shows the non-linearity of thickness to transmission ratio of photons. The straight line represents the expected linear response. ... 18
Figure 2.2 - Calibration phantoms for beam hardening correction in CT. Phantoms were fabricated from a) PMMA and b) Aluminum by gluing disks of various diameters to each other in an alternating fashion. Scale cube (1 cm) for size reference. ... 21
x
measurements, here shown on 63.5 mm rod, from selected CT scan planes were taken on each testing rod. Four measurements were taken in the edges of the object, four in the
surrounding air and one in the center of the object. ... 24
Figure 2.5 - Plots of transmission ratio vs. thickness of calibration phantoms in speCZT scanner. CT scan data of both calibration phantoms acquired from speCZT (90 kVp, 40 mA) were used to construct transmission ratio vs. thickness plots of the PMMA calibrator data with a) polynomial fit, b) one-phase inverse decay fit, and aluminum calibrator data with c) polynomial fit and d) one-phase inverse decay fit. ... 26
Figure 2.6 - Plots of transmission ratio vs. thickness of calibration phantoms in Ultra scanner. CT scan data of both calibration phantoms acquired from Ultra (120 kVp, 20 mA) were used to construct transmission ratio vs. thickness plots of the PMMA calibrator data with a) polynomial fit, b) one-phase inverse decay fit, and aluminum calibrator data with c)
polynomial fit and d) one-phase inverse decay fit. ... 27
Figure 2.7 - Correction of 63.5 mm PMMA rod scanned on speCZT with image and line profile. CT scan planes and corresponding line profiles of a 63.5 mm PMMA rod scanned on the speCZT (90 kVp, 40 mA) following a) no correction, and correction methods as obtained from the PMMA calibrator using b) polynomial fit, c) one-phase inverse decay fit, and the aluminum calibrator using d) polynomial fit and e) one-phase inverse decay fit. ... 30
Figure 2.8 - Correction of 63.5 mm PMMA rod scanned on Ultra with image and line profile. CT scan planes and corresponding line profiles of a 63.5 mm PMMA rod scanned on the Ultra (120 kVp, 20 mA) following a) no correction, and correction methods as obtained from the PMMA calibrator using b) polynomial fit, c) one-phase inverse decay fit, and the
aluminum calibrator using d) polynomial fit and e) one-phase inverse decay fit. ... 31
xi
profile. CT scan planes and corresponding line profiles of a 50.8 mm aluminum rod scanned on the Ultra (120 kVp, 20 mA) following a) no correction, and correction methods as
obtained from the aluminum calibrator using b) polynomial fit and c) one-phase inverse decay fit. ... 34
Figure 2.11 - Correction of 50.8 mm aluminum rod scanned on speCZT with image and line profile. CT scan planes and corresponding line profiles of a 50.8 mm aluminum rod scanned on the speCZT (90 kVp, 40 mA) following a) no correction, and correction methods as obtained from the aluminum calibrator using b) polynomial fit and c) one-phase inverse decay fit. In this scan, the parameters used on the speCZT did not provide enough flux. ... 36
Figure 2.12 – Pre and Post-Correction of Gao Guenie with line profile. Gao Guenie and associated line profile a) uncorrected and b) corrected with aluminium one-phase decay correction. Bright spots indicate material of high radiodensity, mainly kamacite and taenite, surrounded by the silicate bulk material. ... 40
Figure 3.1 - Photo of Ozona. Scale cube (1 cm) for size reference. ... 50
Figure 3.2 – Photo vs CT scan of Ozona. a) A photomicrograph, obtained using a standard office scanner and b) a CT slice through the surface collected on the speCZT at 110 kVp and 40 mA... 51
Figure 3.3 – CT slices through Ozona. CT slices thought Ozona every 1.3 mm, beginning 650 µm below surface collected on the speCZT at 110 kVp and 40 mA. ... 52
Figure 3.4 - Photo of Gao-Guenie. Scale cube (1 cm) for size reference. ... 53
Figure 3.5 - CT vs. Photo, including point counting grid of Gao-Guenie. a) photomicrograph overlain with a point counting grid and results (red = non-metallic; blue = metallic) b) the original photomicrograph obtained using an Olympus STM 30, and c) a CT slice through the surface collected on the speCZT at 110 kVp and 40 mA. ... 53
xii
Peter. Scale cube (1 cm) for size reference. ... 55
Figure 3.8 – SEM, EDX and CT images of Grimsby sample HP-2. a) SEM image of the surface, b) CT slices though the surface collected on the Locus at 80 kVp and 0.45 mA and EDX elemental maps of the surface (below) of Grimsby sample HP-2. ... 56
Figure 3.9 - SEM, EDX and CT images of Grimsby sample Zbyszek. a) SEM image of the surface, b) CT slices though the surface collected on the Locus at 80 kVp and 0.45 mA and EDX elemental maps of the surface (below) of Grimsby sample Zbyszek. ... 57
Figure 3.10 - SEM, EDX and CT images of Grimsby sample Peter. a) SEM image of the surface, b) CT slices though the surface collected on the Locus at 80 kVp and 0.45 mA and EDX elemental maps of the surface (below) of Grimsby sample Peter. ... 58
Figure 3.11 - CT slices through Grimsby sample HP-2. CT slices thought Grimsby sample HP-2 every 200 µm starting 100 µm below surface collected on the Locus at 80 kVp and 0.45 mA... 59
Figure 3.12 - CT slices through Grimsby sample Zbyszek. CT slices thought Grimsby sample Zbyszek every 200 µm starting 100 µm below surface collected on the Locus at 80 kVp and 0.45 mA... 60
Figure 3.13 - CT slices through Grimsby sample Peter. CT slices thought Grimsby sample Peter every 200 µm starting 100 µm below surface collected on the Locus at 80 kVp and 0.45 mA... 61
Figure 3.14 - Photo of NWA 5480. A coarse-grained olivine diogenite. Scale cube (1 cm) for size reference. ... 62
Figure 3.15 - Photo vs. CT scan, including µXRD locations on NWA 5480. a)
xiii
both locations 1 and 2 with a International Centre for Diffraction Data (ICDD) stick pattern for chromite, indicating diffraction match found. ... 64
Figure 3.17 - µXRD Diffraction pattern at locations 3 and 6 - 10. Diffraction pattern obtained at both locations 3 and 6 - 10 with a ICDD stick pattern for enstatite, indicating diffraction match found. ... 65
Figure 3.18 - µXRD Diffraction pattern at locations 4 and 5. Diffraction pattern obtained at both locations 4 and 5 with a ICDD stick pattern for forsterite, indicating diffraction match found. ... 66
Chapter 1
1
Introduction
Humanity’s fascination with the night sky predates recorded history. For as long as we have existed, humans have looked into the sky and wondered what stories it could tell. From the early study of the skies we began to understand the length of a year, and began to be able to predict the seasons, knowing when to plant crops for the best harvests, giving us a better understanding of the cyclic system that our world is going through. As we established our scientific systems, and our technology to study our solar system developed, it became more obvious that there was more out there than we initially thought. The cosmos was more than just ether, holding the stars in place, or spheres rotating inside of each other allowing all the celestial bodies to move amongst each other. We began to understand that the Earth was not the center of the universe, nor the center of our solar system for that matter. There was much, much more to the story.
Meteorites themselves have been heralded throughout human history, even from before we had any knowledge of what they really were or where they came from, often believing that they were gifts from God or had lost their hold in the celestial ether (McSween, 1999). Humans have had a longstanding fascination with these thunder stones.
1.1 Meteoritics
This fascination with the night sky has turned into multifaceted research studying much of universe outside our own world. We have gained enough knowledge to not only study the environment of our solar system from our home world but we have amassed many hours of human spaceflight, space walks, and maintain permanent residence in orbit around Earth since the 2nd of November, 2000; without the study of our planet this would never have been possible. One major facet in the study of planetary science is the study of meteoritics: the study of meteors, meteorites, and other extraterrestrial materials.
parent bodies, and have provided insight into their geology and composition. These samples often have undergone some level of alteration providing insight into the geological processes that have occurred on their parent body, from bombardment to aqueous and thermal metamorphism (McSween & Huss, 2010). Understanding the minerals and other phases within these meteorites can help us develop more comprehensive models of these systems. Some meteorites, however, have remained mostly unaltered since the time of their formation. These meteorites, containing chondrules, and sometimes calcium aluminum inclusions (CAIs), two of the oldest solid materials from the formation of our solar system, help us better understand the processes that occur during the initial cooling of our protoplanetary disk (Brearley & Jones, 1998). There are, of course, bodies in our solar system that are at every stage between these two extremes. Meteorites that stem from these locations give us information about the history of our solar system. Dating methods allow scientists to arrange these meteorites in chronological order from which we have begun to develop an understanding of the order in which events happened in the formation of our, and possibly other, solar systems (Mittlefehldt et al., 1998).
separated from molten silicates (Figure 1.1) (McSween & Huss, 2010; Weisberg et al., 2006).
There is much to be learned form these space rocks that conveniently get delivered to our home planet on a regular basis, but how do we glean the maximum amount of information from these samples? There are a vast array of methods to study these samples, from traditional petrographic analysis of thin sections by optical microscopy (Brearley & Jones, 1998), electron probe EDX/SEM (Hashimoto & Grossman, 1985; Herd et al., 2010; Merouane et al., 2011) to Rietveld refinement of powder X-ray diffraction data (Cloutis et al., 2013; Izawa, Flemming, et al., 2010; Izawa, King, et al., 2010). Unfortunately these methods require some amount of alteration to the sample to provide analysis, e.g. cutting, powdering or exposure to epoxy and coating agents. All destructive techniques reduce the future analysis capabilities of these samples, which are only few in number and therefore of high scientific value.
Figure 1.1 - Diagram expressing the systematics of meteorite classification.
1.2 Micro-Computed Tomography
In its most basic sense, X-ray computed tomography is a process of collecting a series of total X-ray attenuations through an object along paths of known geometry and using these data to reconstruct images of the interior these objects, allowing the user to non-destructively “see” the inside. The image that is produced consists of a 3D array of volume elements (i.e. voxels, or 3D pixels) that represent the radiodensity, or linear X-ray attenuation, of the material contained within each voxel.
Figure 1.3 - Cone beam CT scanning configuration. To provide multiple projection angles, the sample or the source and detector are rotated around an axis (adapted fromhttp://serc.carleton.edu/research_education/geochemsheets/techniques/CT.html)
Micro-Computed Tomography (µCT) functions in the same manner as clinical CT scanners, but provides higher reconstruction resolution. Additionally, µCT machines are usually constructed to produce images with isotropic voxels, allowing resolution to remain the same in all reconstruction planes. This is achieved by smaller detector pixels, more focused X-ray sources, and a higher dose of photons being produced.
1.2.1
Beam Hardening
Figure 1.4, the result of filtering a idealized X-ray source’s spectrum through 1.3 cm of aluminum is not only a reduction in photon fluence across the spectrum, but also an increased mean energy (from 51.3 to 58.7 keV, in this case).
Figure 1.4 - Idealized X-ray tube spectrum. X-ray spectrum prior to and after filteration thought 1.3 cm of aluminium.
As a result of the artificially low values that are reported in the centers of objects, streaking occurs (Barrett & Keat, 2004). This is a result of the reconstruction algorithm requiring self-consistency. The objects are reporting to be of lower density, resulting in the total attenuation along the paths not adding to the full attenuation observed; the material between the two objects must be assigned a higher density in the reconstruction, resulting in streaking.
Figure 1.5 – Artifacts in CT caused by hardening of the beam. a) cupping, or artificially lower density reported in the center of a homogeneous rod of aluminum, and b) streaking, or artificially high and low density streaks reported between two objects with significantly higher density than their surrounding.
The hardening of the X-ray spectrum occurs more predominately in µCT systems with lower mean energies. Industrial scanners that have more energetic X-ray spectra (> 200 kVp) are less likely to exhibit this artifact. Medical X-ray tomography machines are constructed with X-ray sources that produce lower energy spectra, providing higher contrast in material with low attenuation and critically reducing the X-ray dose to subjects (animal or otherwise). While the number of biomedical µCT scanners outnumbers those built for industrial applications, they are more susceptible to bean hardening artifacts.
reducing cupping without the need for a water path is to apply a filter between the X-ray source and detector, effectively prehardening the beam (Ketcham & Carlson, 2001; Ritman, 2004). This is an effective way of reducing the hardening that occurs through the object, as the beam has already become more penetrating, but reduces the total photons and therefore increases scanning time to produce images of similar quality to those without filtering. Additionally, the more penetrating beam causes contrast in the reconstruction volume to be reduced (Van de Casteele et al., 2002).
1.3 Micro-Computed Tomography of Geomaterials
There have been significant developments in the application of quantitative CT and micro-CT to geomaterials. Current studies have used various forms of CT to provide textural analysis of metamorphic rocks (Denison et al., 1997), determining flow patterns in soils non-destructively (Heijs et al., 1995; Heijs et al., 1996), examining the quality of cataclastic carbonate samples (Christe et al., 2011), correlating the microstructure and permeability of saturated bentonites (Kawaragi et al., 2009) and determining soil pore characteristics (Munkholm et al., 2012). The non-destructive aspect of CT has also proved itself invaluable in the analysis of one-of-a-kind items such as Archaeopteryx fossils (Haubitz et al., 1988). Advanced medical imaging techniques such as dual-energy CT have also been applied to geological sampling (Iovea et al., 2009).
1.4 Scope of Thesis
In this thesis I attempt to correct for micro-CT intensity artifacts by collecting attenuation calibration data across a variety of known thicknesses for a homogeneous material with an X-ray attenuation that approximates meteorites and most other geomaterials. Using this empirical data and modeling the non-linear response of the system on the collected projection data (prior to reconstruction), I propose that it is possible to re-linearize the data and reduce or remove the offending artifacts. This has the benefit of working using the same scan parameters as already used on the system, and provides the ability to post-correct scans that have been previously collected, provided that the original projection data have been preserved. The ability to correct for these artifacts is an important step in the quantitative analysis of meteorites and all geomaterials when scanned on a biomedical scanner. Without correction there will not be a uniform density across samples, resulting in improper segmentation though radiodensity for volumetric analysis as well as confounded qualitative analysis due to cupping, and streak artifacts obscuring detail in the volumes.
The overall scope of this thesis is to provide a method that can accurately provide volumetric analysis of the mineralogy within meteoritic samples. This challenge can be broken into two major objectives, divided into the two following chapters:
1. Produce and validate a correction for beam hardening in X-ray computed tomography methodology that will significantly reduce the resulting artifacts.
1.5 References
Barrett, J.F., & Keat, N. (2004). Artifacts in CT: Recognition and avoidance1. Radiographics, 24(6), 1679-1691.
Benedix, G., Ketcham, R., Wilson, L., McCoy, T., Bogard, D., Garrison, D., . . . Middleton, R. (2008). The formation and chronology of the PAT 91501 impact-melt L chondrite with vesicle–metal–sulfide assemblages. Geochimica et Cosmochimica Acta, 72(9), 2417-2428.
Brearley, A.J., & Jones, R.H. (1998). Chondritic meteorites. Reviews in Mineralogy and Geochemistry, 36(1), 3.1-3.398.
Brooks, R.A., & Di Chiro, G. (1976). Beam hardening in x-ray reconstructive tomography. Phys Med Biol, 21(3), 390-398.
Chen, C.Y., Chuang, K.S., Wu, J., Lin, H.R., & Li, M.J. (2001). Beam Hardening Correction for Computed Tomography Images Using a Postreconstruction Method and Equivalent Tisssue Concept. Journal of Digital Imaging, 14(2), 54-61.
Christe, P., Turberg, P., Labiouse, V., Meuli, R., & Parriaux, A. (2011). An X-ray computed tomography-based index to characterize the quality of cataclastic carbonate rock samples. Engineering Geology, 117(3-4), 180-188. doi: 10.1016/j.enggeo.2010.10.016
Cloutis, E., Izawa, M., Pompilio, L., Reddy, V., Hiesinger, H., Nathues, A., . . . Bell III, J. (2013). Spectral reflectance properties of HED meteorites+ CM2 carbonaceous chondrites: Comparison to HED grain size and compositional variations and implications for the nature of low-albedo features on Asteroid 4 Vesta. Icarus.
Denison, C., Carlson, W.D., & Ketcham, R.A. (1997). Three-dimensional quantitative textural analysis of metamorphic rocks using high-resolution computed X-ray tomography: Part I. Methods and techniques. Journal of metamorphic geology., 15(1), 29.
Ebel, D.S., & Rivers, M.L. (2007). Meteorite 3‐D synchrotron microtomography:
Methods and applications. Meteoritics & Planetary Science, 42(9), 1627-1646.
Ebel, D.S., Weisberg, M.K., Hertz, J., & Campbell, A.J. (2008). Shape, metal abundance, chemistry, and origin of chondrules in the Renazzo (CR) chondrite. Meteoritics & Planetary Science, 43(10), 1725-1740.
Friedrich, J.M., Wignarajah, D.P., Chaudhary, S., Rivers, M.L., Nehru, C., & Ebel, D.S. (2008). Three-dimensional petrography of metal phases in equilibrated L
Grodstein, G.W. (1957). X-ray attenuation coefficients from 10 keV to 100 MeV: DTIC Document.
Hashimoto, A., & Grossman, L. (1985). SEM-petrography of Allende fine-grained inclusions. Paper presented at the Lunar and Planetary Institute Science Conference Abstracts.
Haubitz, B., Prokop, M., Dohring, W., Ostrom, J.H., & Wellnhofer, P. (1988). Computed Tomography of Archaeopteryx. Paleobiology, 14(2), 206-213.
Heijs, A.W.J., de Lange, J., Schoute, J.F.T., & Bouma, J. (1995). Computed tomography as a tool for non-destructive analysis of flow patterns in macroporous clay soils. Geoderma, 64(3–4), 183-196. doi: 10.1016/0016-7061(94)00020-b
Heijs, A.W.J., Ritsema, C.J., & Dekker, L.W. (1996). Three-dimensional visualization of preferential flow patterns in two soils. Geoderma, 70(2–4), 101-116. doi:
10.1016/0016-7061(95)00076-3
Herd, C., Stern, R., Walton, E., Li, J., & Bibby, C. (2010). TEM and SEM-CL analysis of baddeleyite in NWA 3171: Geochronological implications for Martian meteorites. Paper presented at the Lunar and Planetary Institute Science Conference
Abstracts.
Herman, G.T. (1979). Correction for beam hardening in computed tomography. Phys Med Biol, 24(1), 81.
Hirano, T., Funaki, M., Nagata, T., Taguchi, I., Hamada, H., Usami, K., & Hayakawa, K. (1990). Observation of Allende and Antarctic meteorites by monochromatic X-ray CT based on synchrotron radiation. Paper presented at the Proceedings of the NIPR Symposium on Antarctic meteorites.
Iovea, M., Oaie, G., Ricman, C., Mateiasi, G., Neagu, M., Szobotka, S., & Duliu, O.G. (2009). Dual-energy X-ray computer axial tomography and digital radiography investigation of cores and other objects of geological interest. Engineering Geology, 103(3-4), 119-126. doi: 10.1016/j.enggeo.2008.06.018
Izawa, M., Flemming, R.L., King, P.L., Peterson, R.C., & McCausland, P.J. (2010). Mineralogical and spectroscopic investigation of the Tagish Lake carbonaceous chondrite by X‐ray diffraction and infrared reflectance spectroscopy. Meteoritics & Planetary Science, 45(4), 675-698.
Izawa, M., King, P., Flemming, R., Peterson, R., & McCausland, P. (2010).
Mineralogical and spectroscopic investigation of enstatite chondrites by X‐ray
Kawaragi, C., Yoneda, T., Sato, T., & Kaneko, K. (2009). Microstructure of saturated bentonites characterized by X-ray CT observations. Engineering Geology, 106 (1-2), 51-57. doi: 10.1016/j.enggeo.2009.02.013
Ketcham, R.A., & Carlson, W.D. (2001). Acquisition, optimization and interpretation of X-ray computed tomographic imagery: applications to the geosciences. Comput. Geosci., 27(4), 381-400. doi: 10.1016/s0098-3004(00)00116-3
McSween, H.Y. (1999). Meteorites and their parent planets: Cambridge University Press.
McSween, H.Y., & Huss, G.R. (2010). Cosmochemistry: Cambridge University Press.
Mees, F., Swennen, R., Van Geet, M., & Jacobs, P. (2003). Applications of X-ray computed tomography in the geosciences. Geological Society, London, Special Publications, 215(1), 1-6.
Merouane, S., Djouadi, Z., Brunetto, R., Borg, J., & Dumas, P. (2011). Analyses of a few fragments from the Paris meteorite through SEM/EDX, FTIR and micro-Raman spectroscopies. Paper presented at the EPSC-DPS Joint Meeting 2011.
Mittlefehldt, D.W., McCoy, T.J., Goodrich, C.A., & Kracher, A. (1998). Non-chondritic meteorites from asteroidal bodies. Reviews in Mineralogy and Geochemistry, 36(1), 4.1-4.195.
Munkholm, L.J., Heck, R.J., & Deen, B. (2012). Soil pore characteristics assessed from X-ray micro-CT derived images and correlations to soil friability. Geoderma, 181-182, 22-29. doi: 10.1016/j.geoderma.2012.02.024
Ritman, E.L. (2004). Micro-computed tomography-current status and developments. Annu. Rev. Biomed. Eng., 6, 185-208.
Van de Casteele, E., Van Dyck, D., Sijbers, J., & Raman, E. (2002). An energy-based beam hardening model in tomography. Physics in medicine and biology, 47(23), 4181.
Chapter 2
Co-Authorship Statement
Chapter 2 is an original manuscript that is in preparation for submission to the journal Engineering Geology, entitled “Extended dynamic range micro-computed tomography of geomaterials using a biomedical scanner.” The manuscript is co-authored by David. R. Edey, Steven I. Pollmann, Daniel Lorusso, Maria Draganova, Roberta L. Flemming, and David W. Holdsworth. In my role as a M.Sc. candidate, I participated in designing the study, acquired the images, analyzed all data, performed the statistical analysis, and wrote the manuscript text. Steven Pollmann contributed key technical aspects of the methods, and provided editorial input. Daniel Lorusso aided in the analysis of statistical data provided editorial input. Maria Drangonova and David Holdsworth designed the study. Roberta Flemming and David Holdsworth, as my supervisors, reviewed the results, gave editorial assistance and provided mentorship.
2
Extended dynamic range micro-computed tomography
of geomaterials using a biomedical scanner
2.1 Introduction
initial scout work, used to determine the best locations for sectioning (Ketcham & Carlson, 2001).
Biomedical micro-CTs are the ideal machines to utilize in geomaterial analysis; this is because they are: 1) more common than high-energy machines; 2) are installed at various university research centers; 3) exhibit high spatial resolution on small specimens; and 4) allow the specimen to remain stationary (in comparison to industrial scanners that typically rotate the specimen, potentially disrupting samples). Unfortunately, many scanners (particularly widely available biomedical scanners) may not have an adequate dynamic range to study dense objects and often are only available with a lower peak voltage (90 – 120 kVp) when compared with industrial scanners (>200 kVp).
Artifacts due to dense materials can lead to incorrect reconstructed signal levels in the interior of specimens, confounding analysis, and can also lead to streak artifacts that obscure details both on the interior and exterior of the specimens. The major sources of these errors include: beam hardening, an artifact due to the preferential removal of low-energy photons in a polyenergetic spectrum; photon scatter; and under-ranging, inadequate dynamic range manifested as inadequate recording of very dark signals.
2.2 Methods
2.2.1
Theoretical basis of the correction algorithm
Beer’s law states:
I = Ioe-µx
where I is the measured intensity at the detector, Io is the incident intensity from the source, µ is the linear attenuation of the materials in the photon path, and x is the perpendicular distance from source to detector though the materials. This expression describes the expected response for each material inside a CT scanner. Dividing I by Io and taking the natural logarithm, we produce:
ln(Io/I) = µx
We define ln(Io/I) as T (transmission) and produce the linear function:
T = µx [Equation 1]
Figure 2.1 - Plot of transmission vs. thickness for aluminum calibrator. CT scans of the aluminium calibrator were completed on the speCZT at 90 kVp and 40 mA. This plot shows the non-linearity of thickness to transmission ratio of photons. The straight line represents the expected linear response.
plateau value, such as an inverted one-phase (inverse) decay described by the follow equation:
T=(To - P)e(-K*x) + P [Equation 2]
where To is the T value when x is zero. P is the T value at infinite time, K is the rate constant; x is the perpendicular distance from source to detector. This function provides the advantage that it can be extrapolated beyond the global maximum of a second-degree polynomial. In this work, both inverse decay and second-degree polynomial fits will be implemented and compared.
2.2.2
Biomedical micro-CT scanners
In these scanners, as is typical, the raw X-ray images are corrected to produce transmission images following equation 1; pixel-to-pixel variations and known geometric distortions are corrected simultaneously. To create a calibration curve that describes the observed transmission values for fitting, only a single projection of each calibration thickness is necessary. A single-view protocol is used, ensuring the source-detector system is perpendicular to the known thickness of the calibration phantom. This allows for measurement of the transmission data at each thickness. ImageJ software (National Institutes of Health, Bethesda, MD) was utilized for interpretation of the data, wherein an ROI is chosen that accurately represents the observed transmission through the calibration phantom.
Two phantom materials were chosen: water-like PMMA (Poly[methylmethacrylate], or Lucite), due to its current use in tissue-level beam hardening correction (Chen et al., 2001); and aluminum, to mimic dense objects like bone, silicate minerals, and other geomaterials with similar electron densities. The observed data were fitted to each of the proposed correction functions and a custom-written software routine corrected each transmission projection view in a pixel-by-pixel fashion, linearizing the transmission values from the previously observed values. Care must be taken to avoid wrap-around or over ranging of the transmission images. If values are stored in a fixed-width integer (e.g. signed short integer) it may be necessary to use extended dynamic range acquisition scaling, if provided by the manufacturer.
2.2.3
Calibration phantom
materials can be used to create various calibration phantoms for intended needs; for example, concrete forms of several thicknesses could be used to calibrate for scans of concrete cylinders. These calibration scans must be performed at the same acquisition parameters that the corrected object is to be scanned, particularly with respect to kVp.
Figure 2.2 - Calibration phantoms for beam hardening correction in CT.
Phantoms were fabricated from a) PMMA and b) Aluminum by gluing disks of various diameters to each other in an alternating fashion. Scale cube (1 cm) for size reference.
2.2.4
Data analysis
Scans were performed on both PMMA and aluminum rods of various diameters, and then reconstructed natively (no correction or uncorrected) and with beam-hardening corrected projections to examine the range over in which the correction is possible. Rods of a single material were chosen as phantoms to evaluate the correction as the single material provides an easy way to check the uniformity of the correction and the uniform cylindrical shape is not only a good model for CT uniformity but also approximates the intended sample shapes. PMMA was corrected by using all four correction algorithms (two calibration phantoms with two mathematical fitting methods each), examining the possibility to correct materials of lower attenuation using calibration fits obtained with more attenuating materials. Aluminum rods of various diameters were scanned and reconstructed uncorrected and by using both mathematical aluminum corrections to evaluate the separate fitting methods. This also ensures that the corrections work as intended. These scans were performed on each machine at the same acquisition parameters as the calibration phantoms. Using ImageJ, 4x4 px regions of interest (ROIs) were taken at the center of the rods, the edge of the rods, and in the air surrounding the rods, demonstrated in Figure 2.4. Percent cupping (described below), line profiles and images though five slices of each sample were then evaluated. The percent cupping on each profile is described by
%Cupping = 1- ((C-A)/(E-A)) [Equation 3]
Figure 2.4 - Locations of the ROI measurements used for percent cupping analysis. Nine ROI measurements, here shown on 63.5 mm rod, from selected CT scan planes were taken on each testing rod. Four measurements were taken in the edges of the object, four in the surrounding air and one in the center of the object.
2.2.4.1
Calibration data
2.2.4.2
Reconstruction analysis
Using ImageJ on corrected and uncorrected reconstructions of the aforementioned rods, line profiles were constructed and percent cupping was calculated, following equation 3. Line profiles were measured along the diameter within a slice of each rod. Additionally on each of these slices, nine 4x4 voxel ROIs were measured; four within the edges of the rod, four within the air surrounding the rod and an additional ROI placed within the center of the rod as illustrated in Figure 2.4. The measurements of the three regions were averaged before percent cupping was calculated. Averages and standard deviations of percent cupping between each slice were calculated within Prism.
2.3 Results
2.3.1
Calibration data
All fits proved to be highly accurate (R2>0.99). Both scanners yielded similar fitting results, but note that the individual values vary as both scanners store transmission values in different data types and scale the data differently (using arbitrary scaling constants), as shown in Figure 2.5 and Figure 2.6, and summarized in Table 2.1.
Figure 2.6 - Plots of transmission ratio vs. thickness of calibration phantoms in Ultra scanner. CT scan data of both calibration phantoms acquired from Ultra (120 kVp, 20 mA) were used to construct transmission ratio vs. thickness plots of the PMMA calibrator data with a) polynomial fit, b) one-phase inverse decay fit, and aluminum calibrator data with c) polynomial fit and d) one-phase inverse decay fit.
2.3.2
Reconstruction analysis
Table 2.2 - Average and standard deviation of percent cupping in PMMA data described by equation 3, for CT scanners a) speCZT and b) Ultra.
2.3.2.1
PMMA samples
2.3.2.2
Aluminum samples
Figure 2.10 - Correction of 50.8 mm aluminum rod scanned on Ultra with image and line profile. CT scan planes and corresponding line profiles of a 50.8 mm aluminum rod scanned on the Ultra (120 kVp, 20 mA) following a) no correction, and correction methods as obtained from the aluminum calibrator using b) polynomial fit and c) one-phase inverse decay fit.
2.4 Discussion
2.4.1
GE eXplore speCZT
On our speCZT system (90 kV, 40 mA), Al PN performed better than Al ID in three of the four different sized aluminum rods. It was effective at correcting rods up to 38.1 mm in diameter, where it was able to reduce cupping from 28% to -1.5%. Additionally, this correction method was able to outperform Al ID as well as both the PMMA PN and ID corrections in PMMA rods of up to 38.1 mm in diameter; calibrations that were specifically designed for that material. In the 63.5 mm diameter rod it failed to produce optimal results. However, it was able to reduce cupping from 12.9% to 5.85%, compared to the best reduction of 4.91% by PMMA PN. Given these specific set of circumstances (scanner, protocol and phantom), we found Al PN to be the most effective beam hardening correction algorithm.
Figure 2.11 - Correction of 50.8 mm aluminum rod scanned on speCZT with image and line profile. CT scan planes and corresponding line profiles of a 50.8 mm aluminum rod scanned on the speCZT (90 kVp, 40 mA) following a) no correction, and correction methods as obtained from the aluminum calibrator using b) polynomial fit and c) one-phase inverse decay fit. In this scan, the parameters used on the speCZT did not provide enough flux.
2.4.2
GE Locus Ultra
of our PMMA rods. However, in contrast to the speCZT system, Al PN was not able to outperform either PMMA PN or ID. In these conditions, there is little cupping without correction with the 63.5 mm rod, resulting in 4.2% cupping prior to correction. Al PN performed adequately in this situation, especially when considering situations where both high- and low-density regions are within the scan object. Given this specific set of circumstances (scanner, protocol, phantom), we found Al PN to be the most effective beam-hardening correction algorithm.
2.4.3
Summary, limitations, and future work
Although we have found aluminum calibrated, polynomial fitted, beam hardening correction to be the most effective algorithm overall, in order to obtain optimal results specific to one’s scanner and protocol, it may be required initially to reconstruct and analyze calibration data. Results may vary depending on the system and acquisition protocol. Specific situations may also have different requirements and measures of effectiveness. In situations where materials within a close range of X-ray attenuation are being examined, measures of modification for materials with lower attenuation would be unnecessary.
This method is highly modifiable for specific situations and it is advisable to change the methodology for situations for which there could be a benefit. It is always advisable to scale the calibration phantoms to a size comparable to objects that will routinely be scanned. Making calibration phantoms out of different materials has the advantage of providing calibration data specific to scan conditions. With proper equipment it would be possible to mimic our calibration phantom out of various geomaterials, both homogeneous (e.g. clay) and heterogeneous (e.g. granite), which can provide beneficial results for further examination of those materials. The design of our phantom provides the advantage that only one projection image is required to obtain all of the necessary calibration data.
It is important to remember the limitations of individual protocols and scanners; low voltages and currents limit the ability to correct scans adequately. As seen in the large samples of aluminum, it is difficult to properly correct these samples when scanned at lower energies, and corrections yield undesirable results. Therefore it is always advisable to scan materials, and corresponding calibrators, in situations that provide ample photon collection though the highest attenuating paths while ensuring there is no over ranging occurring in paths of lower attenuation.
work could serve to ensure this. Future work to be pursued could also include repeating this study at various protocols on the same scanner in order to provide correction across the range of protocols regularly used. It would also be beneficial to run two scanners at the same energies to see if similar results are obtained. A multi-variable study could also be implemented to examine the change in function forms over various protocols; patterns may emerge to allow for prediction of functional forms without calibration scanning.
Testing of calibration on various real world geomaterial samples is a logical next step. As continued in Chapter 3, this method can readily be applied to various geomaterials. As shown in Figure 2.12, this method has been applied to the meteorite Gao Guenie (H5 chrondrite). It can easily be seen that major parts of the uncorrected volume are not incorporated above the threshold whereas post-correction more of the volume is above the threshold. This is the basis for threshold volume calculations and accurate thresholding is necessary for accurate volume analysis.
There are two distinguishable phases in the sample, a high radiodense metallic phase, consisting of kamacite and taenite, is surrounded by the bulk material. Veins of suphides are said to be found in in some samples of Gao-Guenie (Bourot‐Denise et al., 1998) and
Figure 2.12 – Pre and Post-Correction of Gao Guenie with line profile. Gao Guenie and associated line profile a) uncorrected and b) corrected with aluminium one-phase decay correction. Bright spots indicate material of high radiodensity, mainly kamacite and taenite, surrounded by the silicate bulk material.
2.5 Conclusion
A simple method to correct for beam hardening has been demonstrated to be applicable to individual CT projections in X-ray transmission data prior to reconstruction, showing application on two systems and protocols. This method is applied post data collection and therefore can be retroactively applied to data previously collected, as long as projection data are preserved. It is possible to obtain calibration data with a single projection using a novel alternating step calibration phantom that is constructed of a material that mimics the attenuation coefficient of the materials that require correction. Various numerical fits may then be examined to determine the best method for linearizing the data for the each situation.
2.6 References
Bourot‐Denise, M., Wenmenga, U., & Christophe, M. (1998). The Guenie and Gao
chondrites from Burkina Faso: Probably a single shower of stones. Meteoritics & Planetary Science, 33(S4), A181-A182.
Brooks, R.A., & Di Chiro, G. (1976). Beam hardening in x-ray reconstructive tomography. Phys Med Biol, 21(3), 390-398.
Chen, C.Y., Chuang, K.S., Wu, J., Lin, H.R., & Li, M.J. (2001). Beam Hardening Correction for Computed Tomography Images Using a Postreconstruction Method and Equivalent Tisssue Concept. Journal of Digital Imaging, 14(2), 54-61.
Herman, G.T. (1979). Correction for beam hardening in computed tomography. Phys Med Biol, 24(1), 81.
Kalender, W.A., Perman, W.H., Vetter, J.R., & Klotz, E. (1986). Evaluation of a
prototype dual-energy computed tomographic apparatus. I. Phantom studies. Med Phys, 13(3), 334-339.
Ketcham, R.A., & Carlson, W.D. (2001). Acquisition, optimization and interpretation of X-ray computed tomographic imagery: applications to the geosciences. Comput. Geosci., 27(4), 381-400. doi: 10.1016/s0098-3004(00)00116-3
Meganck, J.A., Kozloff, K.M., Thornton, M.M., Broski, S.M., & Goldstein, S.A. (2009). Beam hardening artifacts in micro-computed tomography scanning can be
reduced by X-ray beam filtration and the resulting images can be used to accurately measure BMD. Bone, 45(6), 1104-1116. doi:
10.1016/j.bone.2009.07.078
So, A., Hsieh, J., Li, J.Y., & Lee, T.Y. (2009). Beam hardening correction in CT myocardial perfusion measurement. Phys Med Biol, 54(10), 3031-3050. doi: 10.1088/0031-9155/54/10/005
Chapter 3
Co-Authorship Statement
Chapter 3 is an original manuscript that is in preparation for submission to the journal Meteroitics and Planetary Science, entitled “Phase recognition and volumetric analysis of meteoritic samples using laboratory micro-computed tomography.” The manuscript is co-authored by David. R. Edey, Phil J. A. McCausland, Roberta L. Flemming, and David W. Holdsworth. In my role as a M.Sc. candidate, I participated in designing the study, acquired the images, analyzed all data, performed the statistical analysis, and wrote the manuscript text. Phil McCausland contributed key technical aspects of the methods, aided in the analysis and provided editorial input. Roberta Flemming and David Holdsworth, as the candidate’s supervisors, reviewed the results, gave editorial assistance and provided mentorship. Roberta Flemming also provided key technical expertise for acquisition of microXRD data.
3
Phase recognition and volumetric analysis of meteoritic
samples using laboratory micro-computed tomography
3.1 Introduction
Meteorites provide a range of “returned” samples from small bodies, Mars and the moon, that are otherwise difficult to obtain for laboratory analysis as geological specimens (Hutchison, 2004). Studies of meteoritic samples provide information about materials and processes that were present in our solar system’s protoplanetary disk (Brearley & Jones, 1998) as well as on the formation of planetesimals and planetary bodies (Mittlefehldt et al., 1998).
Modal mineralogy can also provide useful information regarding the physical properties of the parent bodies, important in predicting impact dynamics and collisional lifetimes of asteroids (Britt et al., 2003). Bulk density can be calculated using the modified Archimdeian method (Consolmagno & Britt, 1998) in a non-destructive manner. Combining this with a non-invasive method to determine grain density would provide denisty and porosity calculations with minimal contamination (Bland et al., 2004).
Current methods of bulk analysis to extract modal mineralogy include Rietfield refinement of powder XRD (pXRD) data (Cloutis et al., 2013; Izawa, Flemming, et al., 2010; Izawa, King, et al., 2010) and calibrated Position Sensitive Detector (PSD) XRD (Bland et al., 2004; Howard et al., 2010). Methods of in situ analysis include Energy Dispersive X-rays (EDX)/Scanning Electron Microscopy (SEM) (Hashimoto & Grossman, 1985; Herd et al., 2010; Merouane et al., 2011), petrographic point counting (Buseck, 1977; Stolper & McSween, 1979), and Micro X-ray Diffraction (µXRD) (Flemming, 2007; Izawa, Flemming, et al., 2010; Izawa, King, et al., 2010). These provide useful results and insight into mineralogical composition and structure, but usually require partial destruction of the samples in order to generate data. Because these samples are generally irreplaceable, it would be ideal if analytical techniques could provide similar information without adversely affecting the sample.
quantitative analysis of reconstructed CT data; in this chapter, this method will be applied to selected meteorite specimens.
Four meteorites of various compositions and characteristics have been chosen for this study. Ozona, found 1929 in Crockett County, Texas, is a highly weathered H6 chondrite (Grady, 2000) with a total of 127.5 kg recovered. Olivine composition has been given as Fa19 (Mason, 1963) but it has been studied little further. Gao-Guenie, an observed fall March 5, 1960 in what is now known as Burkina Faso, is an H5 chondrite. The fall was described as a shower, where the total number of specimens is unknown and where samples are still being found; the largest found sample was 2.5 kg in weight (Grady, 2000). Kamacite and taenite are scattered throughout the bulk material with adjacent chondrule-rich and chondrule-poor areas (Bourot‐Denise et al., 1998). Grimbsy, a fresh fall observed on September 29, 2009 in Grimsby Ontario, with a total of 215g recovered, is an H4-5 chondrite. It is recorded as having low shock olivine, enstatite, kamacite, and troilite as well as polycrystalline magnesioferrite spinel in the fusion crust, and abundant chondrules and chondrule fragments (McCausland et al., 2010; Weisberg et al., 2010). Finally, Northwest Africa 5480 (NWA 5480), a find in Northwest Africa in 2008, is a coarse-grained olivine diogenite, with a total of 4.91 kg having been recovered (Weisberg et al., 2009).
The first three samples, all being classified as H group ordinary chondrites, share similar properties. Ordinary chondrites are the most abundant type of material in meteorite collections, consisting of 85% of observed falls and characterized by large chondrules (Weisberg et al., 2006). The H group or ‘high iron’ group is defined by high Fe/SiO2 ratios and relatively low Fe0/Fe ratios (Van Schmus & Wood, 1967). The number following the H is a petrographic grade, wherein the H group can range between 3 to 6, with 3 being pristine and 6 having the highest amount of thermal metamorphism (Weisberg et al., 2006) with some authors including a 7, for samples that exhibit partial melting (Brearley & Jones, 1998).
in their pyroxenes (Weisberg et al., 2006). Similarities in the mineralogical compositions of the HEDs and the apparent surface mineralogy of asteroid 4 Vesta suggest that the HEDs originate from this asteroid (Kelley et al., 2003).
Methods currently employed and trusted by geoscientists will be employed to characterize the mineralogical composition of these meteorites, and results will be compared to micro-CT data to establish the validity and value of CT analysis as a geological sample evaluation and investigation method.
3.2 Methods
3.2.1
Equipment and software
3.2.1.1
LEO 440 SEM
SEM/EDX examination was carried out with a LEO 440 SEM located at Surface Science Western, The University of Western Ontario, which is equipped with a Quartz XOne EDX system. A 15 kV electron beam was used to obtain back-scattered electron (BSE) images, EDX spectra and X-ray intensity element maps of the surface of Grimsby meteorite samples. The EDX technique can detect all elements above atomic number 5 (carbon to uranium) and it has a minimum detection limit of ~0.5 wt% for most elements. The Quartz XOne system uses full spectral imaging, which allows for live and post- collection data analysis.
3.2.1.2
Micro X-Ray diffraction
mode), it is possible to increase the number of lattice planes that satisfy Bragg’s law to produce diffracted peaks. This setup allows for single crystals to be analyzed by this essentially powder diffractometer. The two dimensional diffraction data are integrated into a linear diffraction pattern, which can be analyzed using DIFFRACplus Evaluation (EVA) software. This software interface allows phase identification by graphical matching of diffraction patterns to standard patterns in the International Centre for Diffraction Data (ICDD) database.
3.2.1.3
Biomedical micro-CT scanners
Two laboratory micro-CT scanners were used in this study, chosen based on specimen size. Both a GE eXplore Locus (Locus) and GE eXplore speCZT (speCZT) were utilized; these instruments are operated by the Robarts Research Institute at The University of Western Ontario. Scans on the Locus were completed at an X-ray tube voltage of 80 kVp and current of 0.45 mA in a 10 cm bore with a 3 cm diameter reconstruction volume. For each scan, 900 views were obtained in 0.4° increments at an exposure time of 4.5 s per frame, with 2 frames captured per view. These scan parameters result in an acquisition duration of approximately 2.75 hours and were reconstructed at 20.2 µm isotropic voxel (volume element) spacing. Scans performed on the speCZT were completed at an X-ray tube voltage of 110 kVp and current of 40 mA using the large focus of the X-ray tube in a 8.89 cm bore. For each scan, 900 views were obtained in 0.4° increments at an exposure time of 16 ms per frame. These scan parameters resulted in an acquisition duration of approximately 5 minutes and are reconstructed at 50 µm isotropic voxel spacing.
3.2.1.4
Beam hardening correction
3.2.1.5
Olympus STM6 measuring microscope
An Olympus STM6 measuring microscope was utilized for reflected light microscopy. An Olympus UC30 digital camera was attached to provide digital imaging.
3.2.2
Sample analysis
3.2.2.1
MicroView
MicoView ABA-Fat 2.2.RC5 (MicroView; GE Healthcare, London, ON) was utilized for examining the 3D images produced by the reconstruction software. This software was used to create regions of interest (ROIs) within the sample to determine the average and standard deviation of the radiodensities within these ROIs. An isosurface tool was used to determine the volumes of regions above specified densities; and subsequently subtraction of the regions of higher densities, allowed the volumetric data to be parsed into various sections by their respective radiodensities, as chosen by the histogram of the material, providing the volume of those regions.
3.2.2.2
Point counting
A point counting technique was employed on the Gao-Guenie sample cut surface to obtain an estimate of the metallic content. A grid was overlain on a reflected light photomicrograph of the entire cut surface, collected on the Olympus STM6, and at each intersection point it was inspected visually to determine if the underlying material was metallic (being free metal) or not. These counts of metallic composition were then compared to the total number of reference points and converted into percentages and used for compositional analysis.
3.2.3
Selection of meteoritic specimens
Grimsby is an H4-5 ordinary chondrite, which was mounted in three small epoxy “pucks”. These samples are fine grained and push the limits of the CT scanner resolution. Finally, 4) NWA 5480 is a coarse-grained olivine diogenite. It was chosen to challenge CT in distinguishing between different silicates (olivine, pyroxene).
These four meteorites were chosen to test and stretch the ability of CT, after correction, to differentiate mineralogy within the samples. They represent a wide range of mineralogical compositions, which, along with their unusual shapes, pose challenges to the current state of CT analysis. By implementing semi-empirical beam-hardening correction, and comparing CT with standard geological methods, the aim is to fully examine the capabilities of this method.
3.3 Results
3.3.1
Ozona
50
Figure 3.1 - Photo of Ozona. Scale cube (1 cm) for size reference.
Table 3.1 - Volumetric Analysis of Ozona
3.3.2
Gao-Guenie
Our Gao-Guenie sample is the triangular end cut of a fragment, it measures 1.8 cm by 2.0 cm on two adjacent sides, as seen in Figure 3.4. Micrographic point counting was done on Gao-Guenie to determine surface metallic percent (Figure 3.5). Veins of sulphides are said to be found in some samples of Gao-Guenie (Bourot-Denise et al., 1998), but were not observed on the surface micrograph or in the CT volume, however their occurrence would be incorporated into the metallic fractionations if they are present. This technique resulted in an estimated metallic content of 14.6% v/v from a total of 5341 points. A surface image of the sample with overlying grid and point counts can be seen in Figure
CT Level Volume (mm3
) Volume Percent
Low 12759.1 > 99.9
High 9.5 < 0.1
3.5. CT data for Gao-Guenie was collected in the speCZT, 6 slices parallel to the XZ plane every 1.4 mm, beginning 700 µm below the surface are shown as a representative of the volume in Figure 3.6. A CT slice along the surface is shown in Figure 3.5, exhibiting the two phases (metallic and non-metallic) that are distinguishable by radiodensity in the CT volumes. Isosurfacing these regions resulted in a total volume of 1247.9 mm3 for the whole sample and a 14% v/v metallic content. Calculated volumes and volumetric percentages are shown in Table 3.2.
Figure 3.4 - Photo of Gao-Guenie. Scale cube (1 cm) for size reference.
54
Figure 3.6 - CT slices through Gao-Guenie. CT slices thought Gao-Guenie every 1.4 mm, beginning 700 µm below surface collected on the speCZT at 110 kVp and 40 mA.
Table 3.2 - Volumetric Analysis of Gao-Guenie
3.3.3
Grimsby
Grismby samples are three small samples encased in epoxy pucks: “Peter,” “HP-2” and “Zbyszek.” The samples range from 0.75 – 1 cm in the major axis and 0.3 – 0.5 cm in the minor axis (Figure 3.7). SEM and EDX were collected on each of the three Grimsby samples providing high-resolution backscattered electron (BSE) images as well as elemental X-ray maps (Figure 3.8 - Figure 3.10). CT data for Grimsby was collected
CT Level Volume (mm3
) Volume Percent
Low 1075.5 86
High 172.3 14
using the Locus CT scanner. Six slices, parallel to the YZ plane, every 200 µm are shown in Figure 3.11 - Figure 3.13, beginning 100 µm below the surface for the three separate samples. A slice though the surface alongside an SEM image of the corresponding surface is shown in Figure 3.8 - Figure 3.10. In the CT volume there are two phases (low and high) that are uniquely distinguishable by radiodensity. Isosurfacing resulted in 3% v/v for the high density phase out of a total volume of 22.3 mm3 for HP-2, 4% v/v high density phase out of 40.0 mm3 total volume for Zbyszek and 5% v/v high density phase out of 13.3 mm3 total volume for Peter. Volumes and percentages are shown in Table 3.3.
Figure 3.10 - SEM, EDX and CT images of Grimsby sample Peter. a) SEM image of the surface, b) CT slices though the surface collected on the Locus at 80 kVp and 0.45 mA and EDX elemental maps of the surface (below) of Grimsby sample Peter.
Table 3.3 - Volumetric Analysis of Grimsby
HP-2 Zbyszek Peter
CT Level
Volume
(mm3) Volume Percent Volume (mm3) Volume Percent Volume (mm3) Volume Percent
Low 21.5 97 29.7 96 12.7 95
High 0.7 3 1.2 4 0.6 5
Figure 3.13 - CT slices through Grimsby sample Peter. CT slices thought Grimsby sample Peter every 200 µm starting 100 µm below surface collected on the Locus at 80 kVp and 0.45 mA.