JOURNIU OF
MNGE
NINWGEMEN~
Published bimonthly-January, March, May, July, September, November-by the Society for Range Management 2120 South Birch Street Denver, Colorado 80222 Copyright @ 1974 by the Society for Range Management Managing Editor
DAVID A. SMITH
2120 South Birch Street Denver, Colo. 80222 Editor
ELBERT H. REID
624 South Shields Street Fort Collins, Colo. 80521 Book Review Editor DONALD N. HYDER
Agricultural Research Service Colorado State University Fort Collins, Colo. 80521 Copy Editor
PATRICIA G. SMITH 2120 South Birch Street Denver, Colo. 80222 Editorial Board 1972-74
LOWELL K. HALLS, Nacogdoches, Tex. ROBERT L. ROSS, Bozeman, Mont. GERALD W. TOMANEK, Hays, Kan. HENRY A. WRIGHT, Lubbock, Tex. 1973-75
DWIGHT R. CABLE, Tucson, Ariz. JOHN P. WORKMAN, Logan, Utah RUSSELL J. LORENZ, Mandan, N.D. LEWIS L. YARLETT, Gainesville, Fla. 1974-76
PHILLIP L. SIMS, Fort Collins, Colo. REX D. PIEPER, Las Cruces, N. Mex. MINORU HIRONAKA, Moscow, Ida. MARK R. KILCHER, Swift Current, Sask. - _-..
\Q INDIVIDUAL SUBSCRIPTION IS by membership in the Society for Range Management.
LIBRARY or other INSTITUTIONAL SUBSCRIP- TIONS, on a calendar year basks, are $15.00 postpaid to all countries. Payments from outside the United States should be remitted in US dollars by international money order or draft on a New York bank.
CHANGE OF ADDRESS notices should be sent to the Managing Editor, 2120 S. Birch St., Denver, CO 80222, no later than the first day of the month of issue. Copies lost due to a change of address cannot be replaced unless adequate notice is given. To assure uninterrupted set- vice, provide your local postmaster with a Change of Address Order (POD Form 35751, indicating thereon to guarantee forwarding postage for second-class mail. BUSINESS CORRESPONDENCE, concerning subscrip- tions, advertising, reprints, back issues, and related matters, should be addressed to the Managing Editor, 2120 S. Bitch St., Denver, CO 80222.
EDITORIAL CORRESPONDENCE, concerning manu- scripts or other editorial matters, should be addressed to the Editor, 624 S. Shields St., Fort Collins, CO 80521. INSTRUCTIONS FOR AUTHORS appear each year in the March issue; copies of these instructions ate available from the editor.
SECOND CLASS POSTAGE paid at Denver, Colorado.
TABLE OF CONTENTS:
Vol. 27, No. 6, November 1974
ARTICLES417 420
424
427
433
437
444
447
450
453
459
462
466
470
473
476
480
Effect of Fire on Southern Mixed Prairie Grasses by Henry A. Wright
Effect of Burning and Mowing on Composition of Pineland Threeawn by
W. G. Kirk, George K. Davis, Frank G. Martin, E. M. Hodges, and J. F. Easley
Management Practices to Minimize Death Losses of Sheep Grazing Halogeton-
Infested Range by Lynn F. James and Eugene H. Cronin
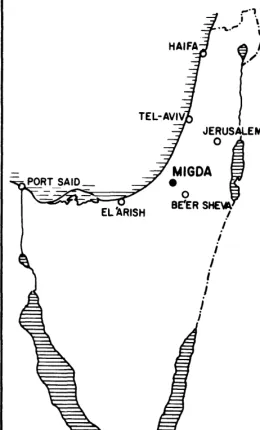
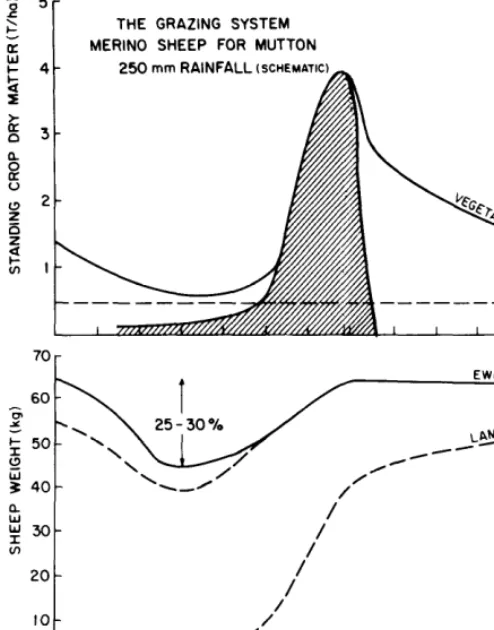
Plant and Sheep Production on Semiarid Annual Grassland in Israel by Nephtali H. Tadmor, Ezra Eyal, and Roger W. Benjamin
Beef Production on Native Range, Crested Wheatgrass, and Russian Wildrye
Pastures by Sylvester Smoliak and Sydney B. Slen
The Physiology of Eating and the Energy Expenditure of the Ruminant at Pasture by P. 0. Osuji
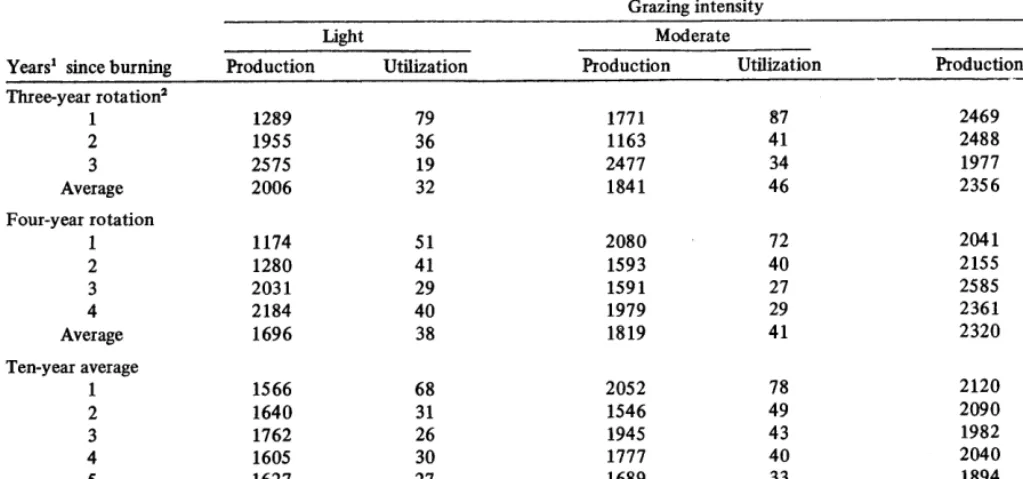
Forage and Cattle Responses to Different Grazing Intensities on Southern Pine Ridge by H. A. Pearson and L. B. Whitaker
Vigor of Idaho Fescue Grazed under Rest-Rotation and Continuous Grazing
by Raymond D. Ratliff and Jack N. Reppert
Influence of Cattle and Big Game Grazing of Understory Structure of a
Douglasfir-Ponderosa Pine-Kentucky Bluegrass Community by William C.
Krueger and A. H. Winward
Biology and Impact of a Grass Bug Labops hesperius Uhler in Oregon Rangelands by J. G. Todd and Jack A. Kamm
Contour-Furrowing and Seeding on Nuttall Saltbush Rangeland of Wyoming by
Herbert G. Fisser, Michael H. Mackey, and James T. Nichols
Vegetation Response Following Spraying a Light Infestation of Honey Mesquite
by C. J. Scifres and D. B. Polk, Jr.
Diurnal Variations of Nonstructural Carbohydrates in the Individual Parts of Switchgrass Shoots at Anthesis by Steven B. Greenfield and Dale Smith Nutritive Quality of Nitrogen Fertilized and Unfertilized Blue Grama by Rex D. Pieper, R. Joe Kelsey, and Arnold B. Nelson
Influence of Nitrogen on Irrigated Buffalograss Yield and Protein Content by R. D. Pettit and Richard E. Fagan
Infiltration Rates and Sediment Production of Selected Plant Communities in
Nevada by W. H. Blackburn and C. M. Skau
An Analysis of Range Conservation Academic Training by C. Wayne Cook and
Charles D. Bonham
MANAGEMENT NOTES
484 Elk and Bison Management on the Oglala Sioux Game Range by Ralph S. Cole
485 One Ranch Family’s Adaptation to Changing Resource Demands and Social
Values by Gordon Stanley BOOK REVIEWS
487 A Study of the Agroclimatology of the Highlands of Eastern Africa (L. H.
Brown and J. Cocheme); Economics and Management Planning of Range
Ecosystems (D. A. Jameson, S. D’Aquino, and E. T. Bartlett); Weeds of Eastern Washington and Adjacent Areas (X. M. Gaines and D. G. Swan).
INDEX
489 Volume 27, 1974
TABLE OF CONTENTS
494 Volume 27, 1974
Returns to Rangelands
W. GORDON KEARL
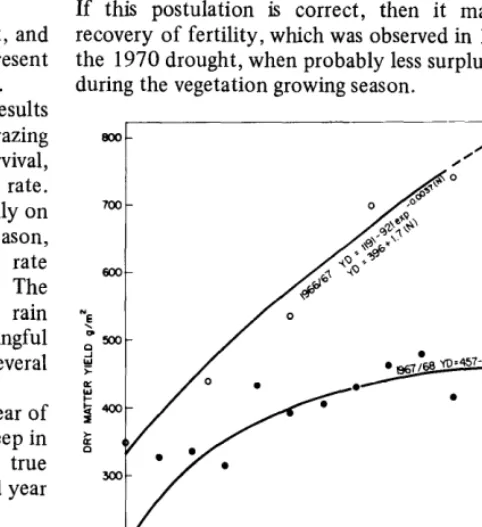
Highlight: Gross value of production from western range- lands average$7.46 per AUM based upon aggregate data from Wyoming, Utah, Nevada, and Oregon for 1966-70 and reached about $10 per AUM in 1972. Privately owned lands leased on an acreage basis but with the lease expressed on an A UM basis generally leased at $1.50 to $2 per AUM during 1966-70 and a little over $2 per AUM in 1972. Returns to rangeland estimated from published research by a real estate appraisal approach in which returns are imputed from an income statement were comparable to the lease rates. The imputa- tional procedures in arriving at returns to land and the definition of an AUM should both be standardized for better comparisons among diverse areas or ranching types where animal-size and herd composition vary.
Gross value of production of rangelands and other associ- ated types of land is significant from the standpoint of society or the economy of an area. It can best be measured by gross receipts adjusted for changes in inventory. It is basic income brought into the local economy as a result of ranching. It is spent and respent within the economy, producing activity which as been estimated conservatively at 2.25 to 3.0 times the actual cash received (Clark, et al., 1972; Osborn and McCray, 1972). It must be carefully distinguished from returns to land, which represents a fair lease from the standpoint of landlord or tenant and is relevant from the standpoint of individual land users and managers.
A third measure, net ranch income is the return to a ranch operator for his labor, management, and use of his capital. It is determined by deducting production expenses, including depreciation from gross value of production. This measure is relevant to individual ranch operators but must be carefully distinguished from either value of production or return to land.
Net ranch incomes and return to capital published in eleven different studies dated from 1926 through 1968 giving the results for 27 different particular situations have been sum- marized (Agee, 1972). A number of other studies since 1968 showing net returns may also be of interest (Goodsell, 1971, 1972; Goodsell and Belfield, 1972, 1973a, 1973b; Gray et al., 1969, 1970, 1971; Kearl, 1972; Stevens, 1971).
Some of these studies will be used in an elaboration of gross value of production and returns to land, which is the major purpose of this paper.
Gross Value of Production
Determination of gross value of production attributable to range or ran&lands, or returns to those factors, is complicated because the yearly production cycle often uses public and
Author is professor of agricultural economics, Department of Agricultural Economics, University of Wyoming, Laramie.
Manuscript received February 2 3, 1974.
private rangelands of differing qualities and also uses croplands and harvested feeds. Published statistics combine value of beef produced from both dairy and beef animals and from rangelands and feedlots or farm lands. Wyoming, Utah, Nevada, and Oregon, are lowest in production from feedlots and the value of beef production from the dairy herds of the public land states in the West.
For purposes of further comparisons, an animal-month (A.M.) will be defined as the monthly forage requirement for five sheep or for cattle over six months of age, without regard to size. Gross value of production per A.M. was $6.31 for the 1966-70 price levels and $9.77 at 1972 price levels, which may represent a reasonable outlook for the longer-term future (Table 1). Variations among the four states are within the range of approximately plus or minus 10% of the four-state average.
Value of production and A.M.‘s for cattle on feed or dairy breeds being grown out for beef have been included. Value of production is exaggerated slightly in relation to A.M.‘s due to sale of cull dairy stock without corresponding allowance for animal months.
Table 1. Gross value of production from cattle and cakes 1966-70 averages, and 1972.
Gross value of production
Item Total Per A.M. Per AUM
1966-70 averages State aggregate data’
Wyoming Utah
$119,184,000 $ 6.83 $ 7.68
Nevada
59,407,ooo 5.89 7.52 43,692,OOO 5.85 6.43
Oregon 126,564,OOO 6.24 7.64
4-States 348,847,OOO 6.31 1.46
Costs and return?
Northern Plains $ 41.763 $ 1.48 $ 8.24
Northwest mountains 42,941 8.71 9.05
Southwest3 34,913 7.42 7.58
University of Wyoming4 45,739 6.86 7.61
1972
State aggregate data’
Wyoming $206,240,000 $10.98 $12.02
Utah 84,302,OOO 9.03 9.84
Nevada 73,556,OOO 9.15 9.55
Oregon 163,585,OOO 9.18 10.07
4-States 527,683,OOO 9.77 10.62
Costs and returns’
Northern plains $ 69,460 $11.76 $13.10
Northern Rockies 71,105 13.62 14.35
University of Wyoming4 67,936 10.19 11.30
Derived from the following sources:
’ Annual Supplements to “Livestock and Meat Statistics, 1962.” Stat. Bull. NO. 333, A.M.S., S.R.S., and E.R.S., U.S. Dep. Agr.
2 (Goodsell, 197 1, 1972) (Goodsell and Belfield, 1973b) (Gray, ’ Goodsell, and Belfield, 1969, 1970, 1971).
19 65-70
4 (Kearl, 1972). averages.
Costs and returns studies of the U.S. Department of Agriculture can also give some useful indications of gross value of production from ranch and rangelands. Those studies indicate values ranging from $7.42 to $8.71 per A.M. at
1966-70 average prices, and considerably higher at 1972 prices, depending upon the area. It should be noted that these studies represent typical commercial ranch operations, rather than averages.
A study from the University of Wyoming indicates a gross value of production of $6.86 for the 1966-70 averages and $10.19 per A.M. at 1972 prices. These returns are reasonably consistent with state aggregate data but do not correspond closely with the costs and returns studies of the U.S. Department of Agriculture.
Coefficients for an animal-unit-month (AUM) related to basal meta$oic requirements can be derived from the formula
AU = -
1,000 *75 W is the average monthly weights of the animal m question; the denominator represents the weight of a mature cow in pounds and puts the AUM coefficients in relation to the maintenance requirements of a 1,000~lb cow, Average weight, AUM coefficients, months in inventory, and AUM’s for annual use for various classes and weights of livestock are shown in Table 2. These coefficients were used to estimate AUM’s more accurately than perhaps was done with the administrative basis for calculating A.M.‘s used previously. AUM coefficients derived by this method have been found to be proportional to requirements for both maintenance and gain derived using net energy methods @earl, 1970). Calcu- lated AUM’s are slightly less than A.M.‘s, and consequently returns per AUM are slightly higher.
Returns to Range and Ranchlands
Returns to rangeland may be indicated by lease rates on rented lands or returns imputed from an income statement or appraisal approach. These two methods are easily and uni- versally applied to the type of data commonly available and are recommended on that basis. The imputation procedure has been subject to criticism by economists on theoretical and other bases. Shadow prices from mathematical programming or marginal value productivities from a production function approach are more acceptable from a theoretical point of view. However, there are other drawbacks to these approaches, primarily related to data requirements and costs.
Based on the imputation process, return to rangeland would be determined by deducting from net ranch income allowances for the non-land inputs including operators’ labor, manage-
Table 2. Animal-unit-month coefficients and head for various average weights of livestock.
requirements
per
Class of stock’
Average weight3
(lb)
~ ~~~
AUM Months AUM’s coeff. reuuired reauired
cows 2+ 1,000 1.00 12 12
Heifers l-2 780 .83 12 10
Weaned calves 505 .60 10 6
Calves-birth to weanini 230 .33 6 2
Steers l-2 780 .83 12 10
Bulls 1,345 1.25 12 15
Cattle on feed 1 so 6 9
’ Numbers indicate age attained January 1.
2Beginning and ending weights which could produce these average weights include: nursing calves, 75-385 lb; weaned calves, 385-625 lb.
ment, and capital invested in livestock and machinery, Obviously, return to rangeland would be much lower than net ranch income,. which in turn must be much lower than gross value of production.
Frequently mentioned lease rates of $3.50 to $5.00 or more per animal month, per AUM, or per cow-calf pair for a month probably cannot be justified for the entire livestock complement on a year-long basis on typical ranches under price and cost conditions prevailing in the past few years. Pasture costs at those levels may be found: (1) under drought conditions; (2) where a ranch operator has a few more cattle than he can carry due to slight drought or over-large inventory and leases pasture for part of his cattle; or, (3) for yearling steers, but even then such lease rates are questionable from the standpoint of economics and from the leasee’s point of view. It should be noted that under pasture leases on head-month basis, the leasor usually takes care of all maintenance of improvements, does herding and moving, and looks after water and salting. Thus, considerably more than just the products of the land (forage) are provided by the leasor.
Public Land Studies
A study of effects of changes in fee levels or permitted use of National Forest or BLM lands was made in 196 l-62. At that time, based upon data from about 100 ranch schedules, 90 to 95% of all privately owned grazing leased in Wyoming was leased on a per-acre basis. Rentals on a per-acre basis converted to costs per AUM were far below the commonly quoted head-month rentals. In fact, many of those leases were in the range of $1.25 to $1.75 per AUM @earl, 1962).
The U.S. Forest Service and Bureau of Land Management sponsored a second study of costs of using privately owned and public lands in 1966. About 14,000 personal interviews were made throughout the western states and information was obtained on 4,271 private leases. The average cost of private leases to Forest Service permittees throughout the study at that time was estimated at $1.86 per A.M. for cattle permittees and $1.64 for sheep permittees (Table 3). Private lease rates paid by BLM permittees in several states are summarized in Table 3. The relatively low lease rates for sheep permittees in Wyoming probably includes much “checker- board” land of the Union Pacific Railroad in southern Wyoming sheep winter range area. Other analyses to be developed later indicate lower returns on winter than on other seasonal ranges (Table 4). It is likely that lack of alternatives to sheep use also depresses the rentals.
Although this study is two years earlier than the mid-point of 1966-70 average gross value of production data presented previously, comparisons are interesting.
GUM Rental Rates Derived from Published Research
Studies reflecting 1966-70 cost and price levels also have been used to gain some insight into earning capacity per AUM for range and ranchlands (Table 3). Weighted average returns per AUM for 5,800 AUM’s of carrying capacity on the Northern Plains cattle ranch amount to $1.60. This is consistent with those indicated previously from the 196 1-62 and the 1966 U.S. Forest Service-BLM fee studies.
Studies on sheep ranching in Wyoming, based on the 1968 year and representing the 1966-70 cost and price averages also show returns to land consistent with other determinations indicated previously (Stevens, 197 1).
Table 3. Summary of returns per animal-month (A.M.) or animal-unit- month (AUM) to rangelands and ranchlands.
Returns per
Studv A.M.’ AUM
Public land studies (1966)’ U.S. Forest Service
All states, cattle, and sheep Cattle
Sheep
Bureau of Land Management Montana, cattle and sheep Colorado, cattle and sheep Idaho, cattle and sheep Utah, cattle and sheep Wyoming, sheep only Published research
Northeast Wyoming cattle ranches ( 1966-70)3 Wyoming sheep ranches ( 1968)4
North-central Northeast Southwest State
Costs and returns studies (1966-70)’ Northern plains cattle
Northern Rocky Mountain cattle Intermountain sheep
$1.82 1.86 1.64
$1.89 1.77 1.76 1.40 1.18
$1.44 $1.60
$1.95 $1.67
2.04 1.79
1.76 1.56
1.88 1.64
$1.36 2.01 1.52
$1.50 2.10
r Per animal-month for cattle over 6 months of age or per five sheep months.
Derived from the following sources:
2Lester Hoffman, Unpublished data, U.S. Dept. of Agriculture, Cheyenne, Wyoming.
3 (Kearl, 1972). 4 (Stevens, 197 1).
’ (Goodsell, 197 1, 1972) (Goodsell and Belfield, 1972).
Returns to land based on cost and returns studies and summarized in Table 3 are also consistent with other information.
The ranches reported in these studies, whether U.S. Department of Agriculture or University of Wyoming cattle or sheep ranches, are all large enough to take advantage of most economies of size.
A study was initiated in 1972 to determine net rental returns on privately owned land in Wyoming (Table 4). A mail survey was used to collect basic data. There were 135 usable responses from ranch operations which made use of a considerable amount of leased rangeland, and 12 responses from complete leased ranch operations. AUM’s were calculated using coefficients based on estimated weights of animals for various seasons of use.
Gross rent is the average of total cash rent reported paid by respondents. Landlord’s cash expenses, except property taxes, and an allowance of 10% of current value of buildings to account for depreciation, repairs, and insurance were entered as costs to the landlord and deducted from gross rent to determine return to taxes and land, including buildings. A percentage of return on current value of buildings equal to percentage return on land was determined and deducted to arrive at return to land and taxes only. The return to land and taxes in this case differs from returns to land derived from the published research, but is probably comparable to the rental costs obtained from the 1966 public land study.
Return to land and taxes for all seasons of use was $2.28 and $2.38 per AUM for cattle ranges in western and eastern Wyoming, and $1.7 1 for the reasonaly well-balanced year-long uses on the complete leased ranch operations.
JOURNAL OF RANGE MANAGEMENT 27(6), November 1974
A regression analysis was used to estimate the net rental return to the landlord as a function of season of use of rented lands. The function was NR = b, SS + b2 F + b3 W + b4H. The variables were: NR, total net returns to land and taxes, as defined above; SS, total AUM’s of spring and summer use; F,
total AUM’s of fall use; W, total AUM’s of winter use; H, AUM equivalents produced by hay. Each separate lease constituted one observation for this analysis. The bi coefficients represent the return to land and taxes for each AUM of a particular seasonal use and are also summarized in Table 4.
The number of observations and acreages involved are sufficient to represent a good sample for western or eastern Wyoming. Most land was leased as marginal additions to an operating ranch unit. The returns are generally lower for fall and winter range than for spring-summer range. The returns are higher but still consistent with those shown previously. Since prices were higher in 197 1 and 1972 than for 1966 or the 1966-70 averages, higher leases would be expected.
Table 4. Summary of returns to land and taxes for Wyoming cattle range and ranchlands.
Cattle ranches Range and
Item Western Eastern hay land
Number of observations 46 89 12
Average acres leased
Rangeland 1,951 3,203 4,263
Hayland - 17 202
Average production
AUM’s 863 1,264 1,182
Hay (tons) - 11 181
Returns per AUM
Weighted average $2.28 $2.38 $1.71
Seasonal coefficient’
Spring-summer 2.26** 2.99** 2.01*
Fall 2.56** 1.58** -
Winter 1.71** 1.53** -
Fall and winter - - 1.35*
Hayland - .45 1.74*
* Statistically significant, P < .05. **Statistically significant, P < .005.
r Return to land and taxes derived from regression analysis.
Variations in returns to rangeland based upon costs and returns studies from 1960 through 1972 are summarized in Table 5. Returns were low in 1960, 1961, 1964 and 1965 due to low prices and drouth problems in some areas. The up-trend in prices for cattle for 1965 through 1972 is reflected in the rather strong increases in returns to land through those years. Prices for sheep and lambs and returns to range and ranchlands for the Intermountain Sheep Area kept pace with those for the cattle ranches up to about 1970. Prices for wool and lambs and sheep failed to keep pace in 1970 and 197 1 with the advancing prices for cattle.
Returns to rangelands reached extremely high levels for the cattle ranches in 1972 as prices achieved high levels and costs were still lagging and increasing only gradually.
Summary and Conslusions
Gross value of production from rangelands and ranchlands is of particular concern to individual ranch operators, com- munities, and society, particularly in areas highly dependent on agriculture and upon the use of range and ranchlands. Gross value of production has been less than generally believed through the time periods perior to 197 1, averaging $7.46 per
Table 5. Variations in returns ($/AUM) to rangelands and mchhds
based on costs and returns studies.
Cattle ranches
Year
Northern Plains
Northern Rocky Mountains
Intermountain sheen
1960 .34 .23 -.12
1961 .OS .75 -.28
1962 1.24 1.61 .84
1963 .84 1.33 .35
1964 -.Ol .lO .57
1965 .19 .73 1.01
1966 .83 1.44 .93
1967 .95 1.43 1.57
1968 1.18 1.85 1.64
1969 1.72 2.81 2.09
1970 2.11 2.51 1.49
1971 2.61 3.08 1.19
1972 4.52 5.47 .89
Derived from the following sources:
(Goodsell, 1971, 1972) Goodsell and Belfield, 1972, 1973a, 1973b).
AUM based upon aggregate data from Wyoming, Utah, Nevada, and Oregon for 1966-70. Gross value of production reached $10 per AUM levels in 1972 when prices were higher.
Clark, Richard T., Robert R. Fletcher, and Harley J. McKinney. 1972.
The economy of Star Valley, Wyoming. Unpub. Study, Div. of Agr. Econ., Univ. of Wyo., Laramie, Wyo.
Goodsell, Wyiie D. 1972. Organization, costs and returns-northwest cattle ranches, 1960-71 Econ. Res. Serv., U.S.Dep. Agr., A. E. R. No. 232, Sept.
Lease rates of $3.50 to $5.00 per AUM or more are commonly quoted as prevailing returns to rangelands. How- ever, privately owned lands leased on an acreage basis but with the lease converted and expressed on an AUM basis generally leased at $1.50 to $2.00 per AUM during 1966-70, and a little over $2.00 per AUM in 1972.
Goodsell,Wylie D. 1971. Costs and returns: migratory-sheep operations, Utah-Nevada, 1960-69. Econ. Res. Serv., U.S. Dept. Agr., A. E. R. No. 195, Feb.
Goodsell, Wylie D., and Macie J, Belfield. 1973a. Costs and returns, northwest cattle ranches, 1972. Econ. Res. Serv., U.S. Dep. Agr., ERS-525, July.
Goodsell, Wylie D., and Macie J. Belfield. 1973b, 1972. Costs and returns, migratory-sheep ranches, Utah, Nevada. ERS-523, and FCR-82 annual reports.
Most of the actual production of value occurs in the spring-summer-fall period when green forage is available. Nevertheless, animals must be maintained through the winter time period, using hay or winter range in some fixed proportion to the summer use. The animal unit must generate enough production and value during the period of a year when both forage and animals make most of their growth and operating costs are lowest, and then part of that value must sustain the animals when forages are in their dormancy, supplemental feeding may be required, and operating costs are high.
Gray, James R., Wylie D. Goodsell, and Macie J. Belfield. 1969, 1970, 1971. Costs and returns-southwest cattle ranches. Econ. Res. Serv., U.S. Dep. Agr., (FCR-78, FCR-81, FCR-83, annual reports).
Kearl, W. Gordon. 1972. Economic comparisons of the cow-calf and cow-yearling systems for northern plains cattle ranching. Wyo. Agr. Exp. Sta. Res. J. 67. Dec.
Kearl, W. Gordon. 1970. Comparisons of net energy and animal-unit- month standards in planning livestock feed and forage requirements. Wyo. Agr. Exp. Sta. Res. J. 35. June.
Kearl, W. Gordon. 1962. Unpublished data, Div. of Agr. Econ., Univ. of Wyo., Laramie, Wyo.
Osbom, James E., and William C. McCray. 1972. The structure of the Texas high plains economy. Texas Tech Univ., Tech. Report T-1-108, August.
Return to land may be determined by marginal value Stevens, Delwin M. 1971. An economic analysis of Wyoming’s sheep productivities from mathematical programming or production industry. (1960, 1964,1968). Wyo. Agr. Exp. Sta. Bull. 546.
function techniques. Those approaches would be preferred for accurately determining returns to specific types of ranching or range types. Land rental rates (a market approach) or imputation procedures similar to those used by an appraiser using an income approach could also be used. These approaches, particularly the appraisal imputation procedures, can be used to give “ball-park” estimates of aggregate or average values for larger areas or more generalized types of ranching and range conditions. Although the data sources used in this paper have some limitations, they are thought adequate to provide such “ball-park” estimates to indicate levels and trends in returns to rangelands.
Literature Cited
Agee, Douglas E. 1972. Rates of return to investment for western cattle ranches. J. Amer. Sot. Farm Managers and Rural Appraisers. 36(2), Oct.
Effect of Fire on Southern
Mixed
Prairie
Grasses
HENRY A. WRIGHT
Highlight: The long-term effect of fire was studied on the major grass species of west Texas when the winter-spring precipitation was 0 to 40% above normal. This and other studies indicate that sideoats grama and Texas wintergrass are harmed by fire. Buffalograss, blue grama, and sand dropseed were neither harmed nor benefited by fire. Vine-mesquite, Arizona cottontop, little bluestem, plains bristlegrass, and Texas cupgrass increased after burning for 1 or 2 years.
Most data that we have on mixed prairie grasses following fire is either short-term or was taken following wildfires during drought years. We lack data on the long-term effects of fire during normal to wet years, when
prescribed burning would be
recommended. Moreover, for several species, we don’t have any information as to how they respond to fire. This study was designed to collect data for several years on major grass species in west Texas, where prescribed burning might be recommended during years with normal to above normal winter and spring precipitation.
In the shortgrass prairie of Kansas, Launchbaugh (1964) found that the recovery time for a buffalograss (Buchloe dactyloides)-blue grama (Bouteloua gracilis) mixture, following a spring wildfire when the soil was extremely dry, took three growing seasons. The mixture recovered 36,62, and 97% following the first, second, and third growing seasons respectively. Hopkins et al. (1948) and Dix (1960) reported similar results following spring burning in west-central Kansas
and western North Dakota,
respectively. Following another wildfire in New Mexico, Dwyer and Pieper (1967) found that production
The author is professor of range management, Department of Range and Wildlife Management, Texas Tech University, Lubbock.
The study is a contribution of the College of Agricultural Sciences, Texas Tech University, No. T-9-l 36.
Manuscript received April 3, 1974.
of blue grama was reduced 30% the first year. With above average precipitation the second year after burning, recovery was 97% of normal. Other studies on blue grama by Trlica
and Schuster (1969) and on
buffalograss by Heirman and Wright (1973) indicated that neither species was harmed by fire during years with average to above average precipitation.
Yield of sideoats grama (Bouteloua curtipendula) was reduced 5 1% by burning during a drought year, but only 12% during a wet year (Wink and Wright, 1973). Hopkins et al. (1948) found that a spring wildfire reduced the basal area of sideoats grama by 9 to 50%. In another study on bluestem ranges the basal cover of sideoats grama remained remarkably stable over a 10 -year burning period (Anderson et al., 1970).
Little bluestem (Schizachyrium scoparium) decreased as much as 42%, if burned during dry years, and increased as much as 8 1% if burned during wet years (Wink and Wright, 1973). Hopkins et al. (1948) found that little bluestem can decrease as much as 58% during dry years. Generally, however, it increases following prescribed burning (Aldous, 1934; Penfound and Kelting, 1950; Kucera and Ehrenreich, 1962; Anderson et al., 1970), unless it is burned too early or too late in the growing season or when soil moisture is low at the time of burning (McMurphy and Anderson, 1965; Owensby and Anderson, 1967; Box
JOURNAL OF RANGE MANAGEMENT 27(6), November 1974
and White, 1969).
The long-term effect of fire on tobosa grass (Hilaria mutica) was reported by Wright (1972). During normal to wet years, tobosa produces two to three times more herbage after burning than the controls. By contrast, during dry years, it produces slightly less than the control. It is well adapted to fire and produces more than unburned tobosa for 3 to 4 years after a burn.
As long as moisture is adequate, vine-mesquite (Panicum ob tusum) and meadow dropseed (Sporobolus asper var. hookeri) thrive after fire (Box et al., 1967; Wink and Wright, 1973). Tall grama (Bouteloua pectinata) also does well after burning during wet years, but declines as much as 60% during dry years (Wink and Wright,
1973). As indicated by changes in basal diameter, sand dropseed (Sporo bolus cryp tandrus) and red t hr eeawn (Aristida longiseta) are generally harmed by fire (Trlica and Schuster, 1969). Dwyer and Pieper (1967) also found sand dropseed to be harmed by fire. Other species that they found to be harmed by fire
included slimstem muhly
(Muhlenbergia filiculmis), ring muhly (M. torreyi), w olftail (Lycurus phleoides), and galleta (HiZarziz jamesii). However, this latter data is
based on a wildfire during a year when precipitation was below average. Spring burns severely harm Texas wintergrass (Dahl and Goen, 1973), which is not surprising since it is a cool season perennial.
On the High Plains, tumble windmill grass (Schedonnardus panicukztus) was not harmed by fire (Trlica and Schuster, 1969). Arizona cottontop (Digitaria califomica) was harmed by fire during dry years, but not during years when the fire was
and 1973.
Buffalograss was burned at three locations in 1968 and at one location in 1972. The yields fluctuated somewhat from year to year, depending on precipitation, but they were similar on burned and unburned areas at all four locations. The data is summarized in Table 1.
Blue grama responded similarly to buffalograss (Table 1) for the one location at Lubbock in which it was studied. Data from both species is in
direct contrast to that of
Launchbaugh’s (1964) and illustrates the difference in response of these species to a dry year vs a wet year. These species are not benefited by any kind of fire, nor are they harmed if burned following a winter-spring period with above-normal precipitation.
Sideoats grama (Table l), the rhizomatous form (predominant form in west Texas), is always harmed by fire. During exceptionally wet years, it tolerates fire reasonably well (Wink and Wright, 1973), but it never benefits from fire. The data for this study were collected near Guthrie,
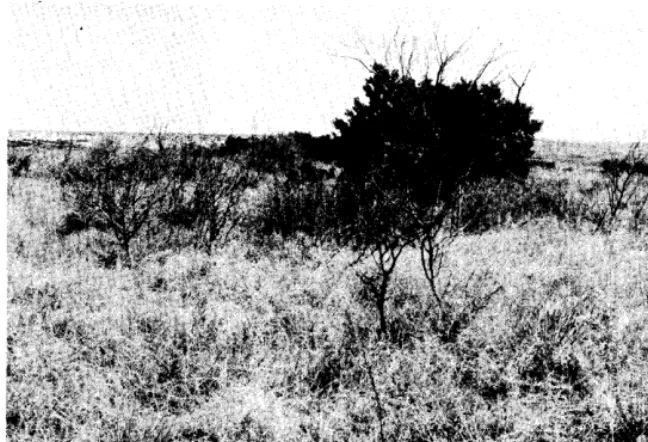
Fig. 1. A variety of grass species existed in
species were sampled. each study area. Only pure stands of grass
followed by favorable moisture (Cable, 1967).
Methods
During years with average to
above-average precipitation, yields of
pure stands of the major grasses in
west Texas were measured on burned
and unburned paired plots for 2 to 4
years after a burn. Data were taken at various locations on the High and Rolling Plains of Texas, including Lubbock, Post, Guthrie, Colorado City, and Baird. Annual precipitation is 19 to 20 inches at all study sites except the one near Baird, which is 26 to 28 inches. Half of this precipitation falls during the winter-spring period. Elevation varies from 1,620 to 3,200 ft.
(1968, 1970, and 1972), winter-spring precipitation was 0 to 40% above normal on all sites. It was 40% above normal in 1968 and 1969, 5% above normal in 1970, 5 to 45% below normal in 197 1, and normal in 1972
Table 1. Yields (lb/acre) of several grass species in west Texas on burned (burned in the spring of the first year listed) and unburned sites following fires when winter and spring precipitation was 0 to 40% above normal.
Species and year after burn
Burned Unburned
Current Current
growth Litter growth Litter
Buffalograss 1968 1969 1970 Blue grama
1970 1971’ 1972 Sideoats
1968 1969 1970 1971* Sand dropseed
1968 1969 1970 Arizona cottontop
1968 1969 1970 Little bluestem
1972 1973
1686 -3 1494 728
2063 306 1928 458
1398 1572 1330 906
Plots were burned in late winter or early spring from March 15 to April 7,
1968, 1970, or 1972, when winter
precipitation had been normal or
above normal. Size of plots varied
from 1 to 90 acres and were protected
from grazing until the end of the
study. A variety of grass species
existed in each area with a few forbs which were considered insignificant on the sampling sites (Fig. 1).
1680 -3 1429 2474
1369 699 1247 2584
2142 1750 1754 1932
1854* -3 2978 -3
1841* 1052 3350 3271
1120 265 1 897 5571
748 1088 789 1933
Ten quadrats (2.4 ft2) were clipped
to sample current growth, and dead
plant material (litter) on burned or
unburned plots at each location.
Vegetation at all sample lbcations was
clipped in late July. Samples were
oven dried and weighed.
2243 -3 2149 -3
2543 2984 2557 4273 2748 3020 2328 4128
5152* -3 2024 -3
2649 2523 2694 4128
456 4770 466 2326
2518* -3 1289 3560
1240 1760 1216 2808
Results and Discussion
During the years of the burns
1 Precipitation was 6% below normal. ‘Precipitation was 45% below normal. 3 Litter data was not taken.
4Different from the control (unburned) at the .05 level of significance.
Table 2. Yields (lb/acre) of vine-mesquite at two locations on burned and unburned
following fires when winter and spring precipitation was 5 to 49% above normal.
sites
Burned Unburned
Location and Current
year after burn Colorado City
1968 1969 1970 Post
1968 1969 1970
growth Litter
4272* -1
659* 3936
790 3874
2527* -1
2742” 2385
3368 4452
Current
growth Litter
708 -1
78 3587
623 1638
1524 -1
1324 2794
3496 5952
Texas, and the first 2 years were relatively wet years with precipitation about 40% above normal. Even with good moisture, vegetative yields were reduced 40 to 45% for the first 2 years after burning. Thus, fire should not be recommended as a range improvement tool where the rhizomatous form of sideoats grama is a dominant species of the vegetation.
Sand dropseed showed no harmful effects from fire during a series of wet years. This is in contrast to data by Dwyer and Pieper (1967) and Trlica and Schuster (1969), who indicated that fire was harmful to sand dropseed. Since it is a bunchgrass, some harm might be expected if the plants are large. However, during this series of wet years at one location near Post, Texas, the small and medium-sized plants were not harmed by fire, nor were they benefited.
Arizona cottontop was studied at Colorado City, Texas, and observed at several other locations. In all cases it responded positively to fire for at least 1 year. On most sites we didn’t know the species was so prevalent until the areas were burned. Seed production was very prolific on this species after being burned.
With average winter and spring precipitation in a 26- to 28-inch precipitation zone near Baird, Texas, little bluestem doubled in production the first year after burning and then reached equilibrium during the second growing season. Unless precipitation is below normal, little bluestem always seems to do well after a fire.
Vine-mesquite thrives after burning and produced more herbage than the controls for 2 years after a fire (Table 2). In addition, it produces many long stolens that spread and occupy new
areas after a burn. It appears to be a true fire species, provided it is not subjected to heavy grazing immediately after burning.
Based on observations, plains bristlegrass (Setaria leucopila) and Texas cupgrass (Eriochloa sericea) do well after fire during wet years. Observations of the bunchgrass form of sideoats grama indicate that it also thrives after fire.
Conclusions and Management Implications
Winter-spring precipitation is the key to a successful prescribed burn. If precipitation is above normal, this and other studies indicate that sideoats grama and Texas wintergrass are the primary perennial grasses that will be harmed by fire in west Texas, and it will take at least 2 years for these species to fully recover. Buffalograss, blue grama, and sand dropseed are neither favored nor harmed by fire. Species that seem to thrive for one to three growing seasons after a fire include Arizona cottontop, little bluestem, vine-mesquite, tobosa, plains bristlegrass, and Texas cupgrass. Generally, these are the species that accumulate the most litter.
Except for tobosa grass, all of these species should be allowed adequate time for recovery before they are grazed. With normal to above normal precipitation, this means a 3- to 4-month rest period after burning. During drouth years the rest period will have to be longer, although we have never had to rest a pasture for longer than 7 months. Since tobosa grass is so coarse, it should be grazed within a few weeks after new growth begins on a burn. Otherwise, cattle will not eat it.
JOURNAL OF RANGE MANAGEMENT 27(6), November 1974
Burning should always be done on a manageable unit basis. If only a portion of a pasture is burned, animals wiII concentrate on the burn, no matter how long it has been rested. This is generally because burned plants are slightly more nutritious and there is no litter in the plants.
Literature Cited
Aldous, A. E. 1934. Effect of burning on Kansas bluestem pasture. Kansas Agr. Exp. Sta. Tech. Bull. 38. 65 p.
Anderson, K. L., E. F. Smith, and C. E.
Owensby. 1970. Burning bluestem
ranges. J. Range Manage. 23:81-92.
Box, T. W., J. Powell, and D. L. Drawe. 1967. Influence of fire on south Texas
chaparral communities. Ecology
48:955-961.
Box, T. W., and R. S. White. 1969. Fall and winter burning of south Texas brush ranges. J. Range Manage. 22:173-176.
Cable, D. R. 1967. Fire effects of
semidesert grasses and shrubs. J. Range Manage. 20:170-176.
DahL B. E., and J. Goen. 1973.2,4,5-T plus fire for management of tobosa grassland. Noxious Brush and Weed Control Res. Highlights 4:20.
Dix, R. L. 1960. The effects of burning on
the mulch structure and species
composition of grasslands in western North Dakota. Ecology 41:49-56. Dwyer, D., and R. D. Pieper. 1967. Fire
effects of blue grama-pinyon-juniper
rangeland in New Mexico. J. Range
Manage. 20:359-362.
Heirman, A. L., and H. A. Wright. 1973.
Fire in medium fuels of west Texas. J. Range Manage. 26:331-335.
Hopkins, H., F. W. Albertson, and A. Reigel. 1948. Some effects of burning upon a prairie in west-central Kansas. Kansas Acad. Sci. Trans. 51:131-141.
Kucera, C. L., and J. H. Ehrenreich. 1962.
Some effects of annual burning of
central Missouri prairie. Ecology
43:334-336.
Launchbaugh, J. L. 1964. Effects of early spring burning on yields of native vegetation. J. Range Manage. 17:5-6. McMurphy, W. E., and K. L. Anderson.
1965. Burning flint hills range. J. Range Manage. 18 :265-269.
Owensby, C. E., and K. L. Anderson. 1967.
Yield responds to time of burning in the Kansas Flint Hills. J. Range Manage. 20:12-16.
Penfound, W., and R. W. Kelting. 1950.
Some effects of winter burning on
moderately grazed pastures. Ecology 31:554-560.
Trlica, M. J., and J. L. Schuster. 1969.
Effects of fire on grasses of the Texas
High Plains. J. Range Manage.
22:329-334.
Wink, R. L., and H. A. Wright. 1973. Effects of fire on an ashe juniper community. J. Range Manage. 26: 326-3 29.
Wright, H. A. 1972. Fire as a tool to manage tobosa grasslands. Proc. Tall Timbers Fire Ecol. Conf. 12:153-167.
Effect of Burning
and
Mowing
on Composition
of Pineland
Threeawn
sufficient
P
for good cattle production.Pineland threeawn (Aristida stricta Michx) (threeawn) commonly known as wiregrass, was the most common grass species on the unimproved flat- woods of central an’d south Florida in the 1940 decade and provided much of the forage for free-roaming range herds. The usual pasture management practice was the uncontrolled burning of different sections of a native range during the November to March period. The new growth for several weeks after burning was sparse but provided nutritious and palatable forage and all cattle responded with improved pro-
At the time of the research, authors were vice director in charge, Range Cattle Station, Ona; animai nutritionist, and associate statistician, Main Station, Gainesville; associate agronomist, Range Cattle Station, Ona; assistant animal nutritionist, Main Station, Gainesville, Florida. Their present positions are: animal scientist, emeritus, Agricultural Research Center (ARC!), Ona; director, Division Sponsored Research, University of Florida, Gainesville; associate statistician, University of Florida, IFAS, Gainesville; agronomist, ARC, Ona; assistant animal nutritionist, University of Florida, IFAS, Gainesville.
The study is a contribution of the Florida Institute of Food and Agricultural Sciences Journal Article 5067.
Manuscript received October 29, 1973.
W. G. KIRK, GEORGE K. DAVIS, FRANK G. MARTIN, E. M. HODGES, AND J. F. EASLEY
Highlight: The object of the experiment was to determine the effect of burning and mowing treatments on the composition of Pineland threeawn (Aristida stricta Michx) over a S-year period. Treatments were control; burning annually; burning in alternate years; and mowing annually and in alternate years both with clippings removed or left on. Annual treatment dates varied from February 20 to March 6. Threeawn samples were analyzed for protein, ether extract, fiber, ash, calcium, magnesium, and phosphorus (P). The grass. from all treatments improved in nutritional quality from March to June and decreased from July to the following March. There was a highly significant difference among collection dates in level of all seven nutritional factors, indicating strong seasonal trends. Effect on new growth was greater for protein than for the other factors. Samples collected from all plots 35 days after treatment averaged 5.9% protein, while grass collected 289 days after triatment had 3.8% protein, a reduction of 36%. Forage from threeawn plots either mowed or burned was higher in protein and lower in fiber and P than the control with no differences between the burned or mowed plots. Grass growth after burning approached the recommended minimum protein level for a nursing cow in only a few instances. Ash was lower in grass from the control than from the treated plots. Burning increased P compared to mowing. Threeawn from all treatments lacked
duction if the range was not too heavily stocked.
Since 1940 there has been a yearly increase in the establishment of improved grass pastures, thus native forage plays a reduced role in provid- ing grazing for the rapidly expanding beef herds. The Institute of Food and Agricultural Sciences (1965), however, estimated there were over 2 million hectares (ha) of unimproved pasture, much of it in central and south Florda. Cattlemen use the combination of native range and highly developed pastures to provide year-round grazing. Native range frequently is reserved for grade cows after their calves are weaned until they freshen again 4 to 5 months later. By this method some improved pastures can be rested and others can be renovated or used to grow a crop of hay for supplemental winter feed. Pineland threeawn is still an important source of forage for the beef herd in the 1970’s.
Yarlett (1965) describes several threeawn grass varieties adapted to the flatwoods of Florida. Pineland three- awn is the most prevalent grass on
much of the cut-over pineland of central Florida. It appears to be adapted to low fertility fine sand soils of the Ona Agricultural Research Center (ARC). Moore (1974) reported that threeawn was a desirable forage for 3 to 4 months after burning but as it matured it became less palatable.
Response of a herd of native cows on a threeawn range, sections of which were burned each fall and winter, averaged 541 lb in March, 623 lb in June, 645 lb in September, and 621 lb in December (Kirk et al., 1945). The higher quality native forage from March to September increased carrying capacity, growth rate of calves, and weight of cows and improved the quality of market cattle.
Methods
The site selected to study the yearly composition change of three- awn under different treatments was cut-over pine land of Immokalee fine sand soil, typical of large areas of flatwoods in central Florida. Saw- palmetto [Serenoa repens (Bartr.) Small] occurred in abundance with a few second-growth pine trees (Pinus palustris Mill.). Palmettos on one half the experimental area were removed by grubbing and the remainder left untouched. Topography of the site was level and drainage was poor, simi- lar to large areas of low fertility flatwoods land.
The treatment plan is shown in Table 1. Treatment date varied each year according to temperature and moisture conditions which affected grass growth. The first forage samples each year were collected from 30 to 43 days after treatment, averaging 35 days for the 5 years. Threeawn blades, approximately 225 grams green weight per sample, were plucked on the same day for all treatments.
Table 1. Treatment plan.
Treatment’
Treatment Burned Mowed, clippings removed
dates Control Every year Alternate years Alternate years Every year
3- 2-45 none burned burned mowed mowed
2-20-46 none burned none none mowed
3- 5-47 none burned burned mowed mowed
2-29-48 none burned none none mowed
2-l 7-49 none burned burned mowed mowed
Number of
samples 39 39 31 31 39
’ Four treatment areas in 1945 and seven in the following four years.
Mowed, clippings left on Alternate years Every year
mowed mowed
none mowed
mowed mowed
none mowed
mowed mowed
31 39
immediate effects of the treatments on
forage composition. A total of 249
samples were analyzed on an air-dry
basis for crude protein, ether extract (EE), fiber, ash, calcium, magnesium, and phosphorus at the nutrition laboratory, University of Florida, Gainesville, by the methods outlined by A.O.A.C. (1940).
Analytical results were calculated on a moisture-free basis using the formula Response/ 1 .OO-moisture with moisture expressed as a decimal frac- tion. Results on this basis were studied statistically using the analysis of vari- ance technique. Differences in results of (P < .OS) or greater reliability were accepted as significant.
Six contrasts among the treatments were studied to maximize the informa- tion from the statistical analysis.
1. Treatment vs control.
2, Annual vs alternate year burn- ing.
3. Burning vs mowing.
4. Mowing, clippings removed vs clippings left on.
5. Annual vs alternate year mow- ing.
6. Interaction between 4 and 5.
Results and Discussion
Rainfall previous to and after burn- ing or mowing affected forage compo- sition. For example, the protein of threeawn obtained from all treatments on April 7, 1947, averaged 8.19% protein after 12.07 inches of rain the previous months, while samples col- lected April 10, 1950, averaged 3.61% protein when rainfall totaled 1.79 inches January to March (McCaleb and Hodges, 1960). Rainfall had more
effect on protein level of threeawn than on the six other nutritional fac- tors studied.
The first collection of grass after treatment was always included in the April to June period. Threeawn forage samples from April to June had higher levels of protein, EE, Ca, Mg, and P and lower levels of ash than for the other periods of the year (Table 2). Fiber and ash percentages were highest in July to September and protein and Mg the lowest in January to March. Analysis of variance showed that there were highly significant seasonal differ- ences for each of the seven nutritional factors in every year except for Ca and P in the first year. The main effect means for all samples of threeawn are given in Table 3.
Crude Protein
The average protein level during the S-year period ranged from 3.7 1% (con- trol) to 4.65% (burned every spring). The highest average protein level, 4.65%, furnished only 51% of the protein required for the adequate nutrition of a producing cow accord- ing to the National Research Council (1963) (NRC). Protein content of threeawn from all treated areas was significantly greater than grass from the control but differences observed among the burned and mowed areas were not significant.
Sampling date means show that protein level in threeawn was highest in late March and April with the most rapid decrease from June to Septem- ber. There was a slight increase in
Table 2. Average composition (%, dry matter) of threeawn by 3-month periods, all treatments.
protein from January to March 1947 when soil moisture and weather condi- tions were favorable for grass growth. The greatest increase in level of pro- tein occurred when nursing cows re- quire this element for milk produc- tion. The effect of the different treat- ments on composition of threeawn was more apparent for protein than with the other six factors studied.
Seasonal trends in percentage pro- tein in threeawn from the control and average of six treated areas for 1947-48 are illustrated in Figure 1. The eight samples from the control averaged 3.59% and the 48 from the six treated areas 4.25% protein, an 18% higher yearly level in favor of the treatment areas. The significant facts to be observed from Figure 1 are: protein in the grass from the control generally decreased throughout the year; treated areas showed a rapid increase in protein after treatment, going from 4.1% 13 days before treat- ment to 8.8% 30 days after treatment, an increase of 115%; after reaching its maximum, protein of treated areas rapidly returned to their pretreated levels, being 4.2% 80 days after treat- ment; and after 110 days, there was no essential difference between con- trol and treated areas.
The protein level of the 249 three- awn samples collected over a 5-year period ranged from 1.20% (l-2048, mature grass mowed every year, clip- pings left on) to 11.46% (4-4-47, burned alternate years and obtained 30 days after treatment). Thus during six short periods after burning treat-
Period Apr. to June July to Sept. Oct. to Dec. Jan. to Mar.
No. of samples
13 10 8 8
Protein EE
5.39 1.96
3.77 1.91
3.59 1.58
3.31 1.80
Composition
Fiber Ash Ca Mg P
35.72 3.30 0.53 0.22 0.085
36.49 3.52 0.45 0.15 0.076
34.66 3.38 0.37 0.14 0.076
35.46 3.51 0.37 0.10 0.076
If
2-20-47 SAMPLES BEFORE TREATMENT2-25-46 J-
3-5-47 TREATMENT DATE
0-L rr ” * ” * A ” fi A CI
DAYS IJ 30 56 110 177 224 ” 273 321 ” 356 0 ‘- +--- SAMPLINQ DAYS AFTER TREATMENT _______+1
Fig. 1. Percentage protein in pineland threeawn grass from control and average of six treated areas for nine collection dates in a year.
ment did protein content of threeawn meet optimum requirements of 9.2% for good animal production (NRC, 1970), while for most periods of the year the grass is inadequate in protein.
between dates with years but no detectable Difference among the six contrasts,
Ether Extract
Fiber
Average from all
fiber content of threeawn treatments varied from Average ether extract of threeawn 35.19% (mowed alternate years, clip- from all treatments ranged from 1.67% pings left on) to 36.05% (control) with (mowed alternate years, clippings left a mean of 35.58% for all samples. on) to 1.86% (burned every year) with Level of fiber in single samples ranged a mean of 1.7 1% for the 249 samples. from 24.73% (8-29-47, mowed alter- The extreme levels in single samples nate years, clippings removed to were from 0.83% (8-3-49, burned 42.20% (9-12-45, mowed alternate alternate years) to 5.54% (8-l-45, years, clippings left on). Davis and mowed alternate years, clippings left Kirk (1952) obtained similar values, on). There was a significant difference 23.24% for very young to 36% to 40% in level of ether extract in threeawn fiber for mature forage, There was a between sampling dates in each of the significant difference in fiber content 5 years. An analysis of variance between collection dates in each of the showed a highly significant difference 5 years and between years, with the
lowest in year 3 (33.25%) and the highest in year 2 (37.90%). A sug gested reason for the variation in fiber level is in the difference in total rainfall, 69.91 inches in year 3 and 52.67 inches in year 2 (McCaleb and Hodges, 1960).
Frequency of mowing had some influence on the fiber level, but this was not consistent over the 5 years of the experiment. The observed differ- ences favoring alternate year mowing were not significant except for year 3, when fiber was higher in plots mowed annually.
Ash
Average ash content of threeawn ranged from 3.17% (control) to 3.63% (burned alternate years). Single samples of forage varied from 2.25% (6-2-48, burned alternate years) to 7.3% (4-4-47, burned alternate years) with an average of 3.43% for all samples. Ca, Mg and P made up 12.8%, 5.5% and 2.2%, respectively, or 20.5% of the total ash. Forage analysis revealed a greater percentage of ash from all treated areas than from the control.
There was a highly significant dif- ference in ash of grass between sampling dates in each of the 5 years. Except for year 1 there was a signifi- cant difference between the control and treated areas, with treated areas having a higher level of ash. The plot which was burned alternate years had a higher ash content than the plot burned annually, Leaving clippings on after alternate-year mowing reduced forage ash below that of the clipping removal treatment. Clipping removal and non-removal had no effect on forage ash under annual mowing.
Ash level was found to significantly interact with years X treatments between treatment vs control, annual
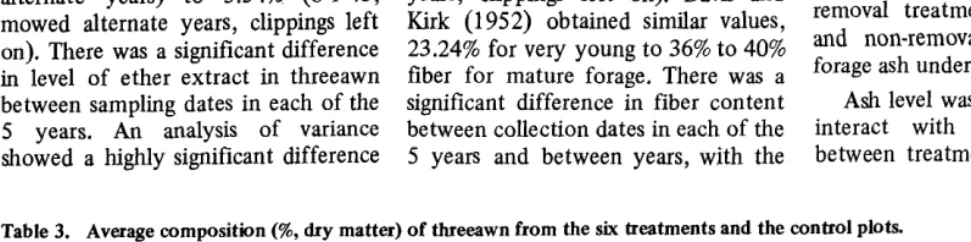
Table 3. Average composition (%, dry matter) of tbreeawn from the six treatments and the control plots.
No. of Composition
No. Treatment samples Protein EE Fiber Ash Ca Mg P
1 Control 39 3.71 1.80 36.05 3.17 0.43 0.19 0.083
Burned :
2 Every year 39 4.65* 1.86 35.44 3.57 0.44 0.18 0.091
3 Alternate years 31 4.09* 1.79 35.34 3.63 0.42 0.19 0.086
Mowed, clippings removed :
4 Alternate years 31 4.07” 1.68 35.19 3.46 0.40 0.17 0.069
5 Every year 39 4.47* 1.79 35.52 3.36 0.46 0.20 0.076
6 7
Mowed,-clippings left on: Alternate years Every year
31 3.93* 1.67 35.43 3.31 0.44 0.19 0.068
39 4.22* 1.78 35.92 3.51 0.45 0.19 0.067
*Significantly higher than control.