Vegetation Response to Contour
Furrowing
J. ROSS WIGHT, E. L. NEFF, AND R. J. SOISETH
Highlight: Over an S-year period, contour furrowing on a panspot range site increased average annual herbage production 165% (527 kg/ha), increased plant available soil water 107%, and reduced total basal cover 73% (from 15.72 to 4.22%). On a saline-upland site, contour furrowing increased available water but had no measurable effect on total herbage production and basal cover. Thickspike and western wheatgrass accounted for most of the increased yields on the contour- furrowed panspot site. High yields on the furrowed plots were due primarily to increased soil water resulting from increased overwinter recharge and reduced summer runoff.
Range forage production in arid and semiarid regions is closely associated with soil water availability, which is limited by precipitation amounts and runoff. Contour furrowing was one of the first land surface modification treat- ments applied to rangeland to reduce runoff. Since this treatment was intro- duced in the 1930’s, it has been applied in a wide variety of furrow sizes and spacings. While optimum spacing is related to furrow size, spacings wider than 1.5 to 1.8 m have generally been ineffective (Bennett 1939; Barnes 1950). In the past 20 years, most contour furrowing has been done with the Arcadia Model B contour furrower developed by the U.S. Forest Service. Herbage yield responses to contour furrowing have ranged from none to increases of 100% or more and have ken closely associated with the type of furrowing treatment and site character- istics (Wight 1976). In addition to increasing forage production, contour furrowing has been used extensively, primarily by the Bureau of Land Management, to reduce runoff and erosion on fine-textured, erodible rangelands.
Authors we rilnee wentist, research hydraulic en- glneer, and agric&ral research technician; respective- ly, U.S. Department of Agriculture, Agricultural Re- search Service, Northern Plains Soil and Water Re- search Center, Sidney, Montana 59270. R. J. Solseth IS now supervisory range conservationist, U S. Depart- ment of the Interior, Bureau of Land Management, P 0 Box B, Malta, Mont. 59538.
Thl\ repon is acontrtbution lrom the U.S. Dep. Agr.. Agr Res. Serv.. mcooperation ith the Mont. Agr. Exp. Sw. Journal Sern No. 755
Manuscript received June 16. IY77.
At present, contour furrowing is generally not used as a range improve- ment practice because unfavorable economics have discouraged its use by private landowners, and changes in
management philosophies have re-
stricted its use by the Bureau of Land Management and other land manage- ment agencies. However, on range- lands with high runoff and resultant low productivity, contour furrowing can significantly reduce runoff and increase forage production. More information is needed regarding long-term vegetation responses and site-treatment inter- actions. The purpose of this paper is to examine the vegetation responses of panspot and saline-upland range sites to contour furrowing. Vegetation re- sponses were examined in terms of herbage production, species composi- tion, and associated environmental factors. The results and data presented here are part of a cooperative study between the Agricultural Research Service, U.S. Department of Agri- culture, and the Bureau of Land Management, U.S. Department of the Interior, to evaluate contour furrowing effects on the vegetation and hydrology of fine-textured rangelands in south- eastern Montana.
Site Description and Methods This study was conducted about 29 km south of Ekalaka in the southeast comer of Montana. The climate is arid to semiarid continental with cold, relatively dry winters and warm summers. The long-time average annual precipitation is about 300 mm. with DIURNAL OF RANGE MANAGEMENT 31(2), March 1978
80% of the precipitation received during April through September. Based on data from nearby weather stations, the precipita- tion during 1968-76 study was about 120% of the 76-year average and about I 15% of the last 22-year average. The average frost- free season is 127 days.
The contour furrowing treatments were applied to panspot and saline-upland range sites, which are characterized by imperv- ous saline-sodic soils with low forage productivity. The panspot soils are in the Bickerdyne and Bascovy series, fine or very fine, montmorillonitic, Borollic Vertic Camborthids. The saline-upland soils are in the Dilts series, clayey, montmorillonitic, acid, frigid, shallow Ustic Torriorthents. A dominant feature of these soils is low infiltration and high runoff. Neff and Wight
(I 977) estimated that approximately 40% of the late fall, winter, and early spring precipitation was lost by runoff.
Vegetation of the panspot site included thickspike wheatgrass (Agropyron dasy-
stachy urn), western wheatgrass (A.
smithii), Sandberg bluegrass (Poa se- cunda), prairie Junegrass (Koelrria crisfa- ta), big sagebrush (Artemisia tridentata), and pricklypear cactus (Opuntia sp.). Small residual pedestals of coarse-textured mate- rials had abundant blue grama (Bouteloua gracilis), buffalograss (Buchloe dactylo- ides), and clubmoss (Selaginella densa). Tne saline-upland site was dominated by alkali sacaton (Sporobolus b-aides) and Nuttall alkaligrass (Puccinellia airoides). Other species present were Nuttall saltbush (Atriplex nuttallii), broom snakeweed (Gutierrezia sarothrue), racemed poison- vetch (Astragulus racemosus), and Eri- ogonum multiceps.
Sixteen O.&Hectare watersheds, twelve on the panspot range site with average slopes of I to 5% and four on the saline- upland range site with an average slope of 3%, were established in November 1967. Half of the watersheds at each site were contour furrowed with the Arcadia Model B contour furrower. Two pairs of offset disks
I .S m apart formed two furrows approxi- mately 50 cm wide and IS to 25 cm deep. Rippers ahead of the disks fractured the soil to a depth of 25 to 40 cm. Intrafurrow dams were constructed about every 5 m. The furrow and the ridge portions represented
about 40 to 60%, respectively, of the treated area. The treatments were applied in a randomized complete block design with treatments replicated six times on the panspot site and two times on the saline- upland site.
Table 1. Average annual herbage yields (kg/ha) and composition on check and furrowed plots for 1969-1976.
Site
Annual herbage production was deter- mined by clipping vegetation at ground level in eight randomly located 0.25 x
2-m quadrats or four 0.5 x 2-m quadrats in
each watershed. Plots were clipped when vegetation reached peak standing crop, usually in late July or early August. No yield measurements were made in 1973 because of early grazing. Yields were determined separately for the dominant species and major species groups (i.e., grasses, forbs, and shrubs). Because of the difficulty in separating thickspike and western wheatgrass, the thickspike-western wheatgrass complex was harvested as a single category. No estimates were made of annual big sagebrush growth. Furrows and ridges were harvested separately in 1968, 1969, 1970, 1972, and 1976; in the other years, sampling quadrats were located to include a proportional amount of ridge and furrow. There was no measurable produc- tivity in the furrows until 1971. Grazing was not a treatment but plots were grazed in
1969, 1971, and 1973 to remove accumu- lated residue.
Species
Saline-upland Panspot
Furrowed/ Furrowed/
Check Furrowed check Check Furrowed check**
Nuttall alkaligrass 23 80 3.47 - - -
Alkali sacaton 59 73 1.26 - - -
Thickspike-western wheatgrass 23 29 1.22 119 558* 4.64
Total grass 139 218 1.55 271 704* 2.60
Forbs 78 114 1.49 31 129* 4.00
Total 241 350 1.45 320 847* 2.65
Percent grass 58 62 - 85 83 -
* Means significantly different from the check (P=O. I ).
**Furrowed/check data not analyzed statistically.
and analyzed statistically. All data were analyzed with a split-plot analysis of variance with furrowing treatments as the main plots and years as the subplots.
Results and Discussion
Herbage Production
Soil water was measured by the neutron scatter method to a depth of 120 cm periodi- cally (biweekly to monthly) during the growing seasons at two locations in each watershed and included both ridges and furrows of the treated plots. Cm-days of available water was determined by plotting soil water content for the April 1 to July 31 growing season and measuring the area between the plot and a base line represent- ing the water content below which water was unavailable to plants. This integrated area is an index reflecting both the amount and duration of available soil water. The base line or lower limit of soil water availability was determined as the lowest water content that occurred naturally in the field during the 9-year study. Because most of the root activity on these two sites is limited to the top 60 cm of soil profile, available soil water was determined for this zone only.
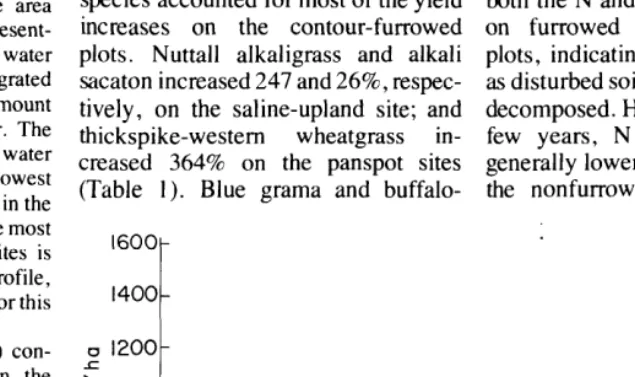
The effect of contour furrowing on herbage production is shown in Table 1 and Figure 1. Except for the treatment year, contour furrowing generally in- creased herbage production on all plots. On the saline-upland site, yield increases due to contour furrowing were not significant (P = 0.1). How- ever, with only two replications and two treatments, an analysis of variance was not very discerning. On the pan- spot site, furrowing increased average herbage production 527 kg/ha (165%).
grass, which represented about 25% of the basal cover on the nonfurrowed panspot site, accounted for only 17.8 and 1.7% of the total production on the check and furrowed plot, respectively. Forbs, which accounted for only 10 and 32% of the total production on the untreated panspot and saline-upland sites, respectively, responded to con- tour furrowing in about the same pro- portion as did the dominant grasses. The major forb response to contour fi.n-rowing on the panspot site in 1976 was a heavy infestation of yellow sweetclover (Melilotus ojficinalis).
N and P Uptake
Increases in the dominant forage species accounted for most of the yield increases on the contour-furrowed plots. Nuttall alkaligrass and alkali sacaton increased 247 and 26%) respec- tively, on the saline-upland site; and thickspike-western wheatgrass in- creased 364% on the panspot sites (Table 1). Blue grama and buffalo-
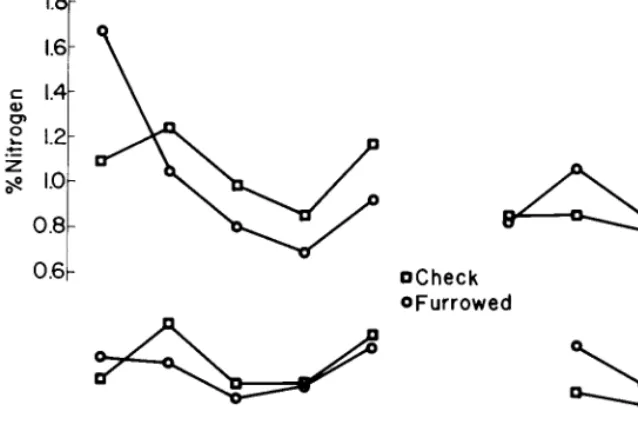
Herbage quality as determined by N and P contents of thickspike-western wheatgrass was significantly affected by contour furrowing (Fig. 2). In 1968, both the N and P contents were higher on furrowed than on nonfurrowed plots, indicating a nutrient enrichment as disturbed soil and sod weathered and decomposed. However, during the next few years, N and P contents were generally lower in the furrowed than in the nonfurrowed plots, indicating a
1600
Nongrass Species 8 Nitrogen (N) and phosphorus (P) con-
tents were determined annually on the mature thickspike-western wheatgrass plants.
Basal cover was determined for the years 1968-71 and again in 1974 with the point quadrat method. Species composition based on basal cover was determined in 1974. Point data were taken along six permanently located line transects at 5-cm intervals with a 20-point frame for a total of 1,200 points per plot. Only the basal hits are discussed in this paper. The percentage basal cover data were normalized by the trdnsformation
,” 1000 u ; 800 .-
Grass
1968 1969 1970 1971 1972 1974 1975 1976 Avg.
Fig. 1. Herbage production under contour &furrowing on panspot range site.
I.81
16
0.8-
0.6- OCheck
OFurrowed 0.20 ;
0.16 2
0.12 g 2 0.08 8
I 6 I 1 I 1 I I I
1968 69 70 71 72 73 74 75 1976
Fig. 2. N and P content oj thickspike-western wheatgrass under contour furrowing.
dilution effect as the furrowed plots produced 2 to 3 times more vegetation than did the nonfurrowed plots. Also, decreases in N and P contents are associated with decreases in leaf:stem ratios as plants grow more vigorously. Although N and P contents were lower on the furrowed than on the non- furrowed plots, total uptake of N and P was higher on the furrowed plots because of the increased production. As indicated in Figure 2, this situation again reversed itself in about 7 years, with the furrowed plots producing forage higher in N and P contents than did the nonfurrowed plots. After 7 years of increased soil water and productivity on the furrowed plots, the soil nutrients were probably cycling in greater quantities on the furrowed than on the nonfurrowed plots.
Species Composition
Except for the rapid establishment of tumblegrass (Schedo~znardus panicu-
lutus) in the furrows on the panspot
site, the furrows revegetated slowly and for the first 3 years nearly all of the herbage was produced on the ridges (Table 2). However, within about 4 years the major forage species re- established in the furrows and the furrow production was equal to or greater than that of the check plots but only about half that of the ridges. By 1976, furrow production was about 70% of ridge production on the panspot and saline-upland sites. The furrow production was two and a half times that of the check plots on the panspot site, but was not significantly different from that of the check plots on the saline-upland site. Thickspike-western
Table 2. A comparison of herbage production rates (kg/ha) in the furrows (F), ridges (R), and checks (C).
Species
1969 1972 1976
FR C F R C F R C LSD
Saline-upland
Nuttall alkaligrass 0 76 6 56
Alkali sacaton 0 2 66 0
Forbs 0 193 49 87
Total grass 0 155 102 182
Total yield 0 350 159 287
Panspot
Thickspike-western
wheatgrass 0 619 121 406
Foxtail 0 12 0 -
Forbs 0 188 22 97
Shrubs 0 28 10 3
Total grass 0 835 242 614
Total yield 0 1051 274 714
LSD (/‘=(I I) valid for within-year comparisons only.
97 9 110 82
87 40 79 211
186 49 86 131
355 123 188 292 541 206 302 432
880 95
55 27
10 17
984 273 1049 317
423 900 115 20.5
137 22 0 -
388 312 31 185
0 9 40 32
722 1364 365 207 1111 1685 436 244
KXJRNAL OF RANGE MANAGEMENT 31(Z), March 1978 99
46 180 100 121 233 205 178 97 467 236
wheatgrass accounted for most of the herbage production in the panspot furrows. On the saline-upland site, Nuttall alkaligrass was more productive in the furrows than on the ridges or check plots while alkali sacaton favored the ridges and the check plots more than the furrows.
Changes in percent composition 7 years after treatment are shown in Table 3. Most changes were beneficial, with the biggest changes occurring in the major forage species-Nuttall alkaligrass, alkali sacaton, and the thickspike-western wheatgrass. Tum- blegrass and foxtail barley (Hordeum
jubarum), which are of little forage
value, also increased in the furrows of the panspot site. Foxtail barley was restricted almost entirely to those furrowed areas where water remained ponded for a considerable time. How- ever, in 1976 tumblegrass and foxtail barley comprised only 2.0 and I .2%, respectively, of the total grass yield.
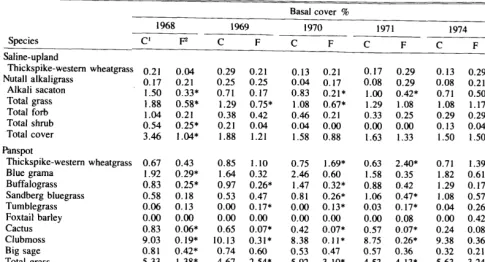
Basal Cover
On the saline-upland site, only the basal cover of alkali sacaton and the shrubs was initially reduced by con- tour furrowing (Table 3). However, by 1974, there were no measurable differ- ences in the check and contour- furrowed plots. On the panspot site, contour furrowing reduced the basal cover of nearly all species except thick- spike-western wheatgrass and tumble- grass; these were increased. Contour furrowing reduced total basal cover from 15.72 to 4.28%, mostly due to a reduction in clubmoss from 9.38 to 0.36%. Disregarding clubmoss, the basal cover 7 years after treatment on the furrowed plots was still only about half that on the nonfurrowed plots (3.86 vs 6.35%). Blue grama and buffalo- grass were also significantly reduced by contour furrowing and accounted for much of the loss in total cover on the hnrowed plots. Except for the first year after treatment on the saline-upland site, there were no measurable changes in shrub cover as a result of contour furrowing.
Soil Water
Table 3. Basal cover and composition of species and species groups on check and furrowed plots.
Species
Saline-upland
1968
C’ F2
Basal cover % Composition %
1969 1970 1971 1974 1974
C F C F C F C F C F
Thickspik e-western wheatgrass n 31 Nutall alkaligrass
“.A 1 0.17
Alkali sacaton 1.50
Total grass 1.88
Total forb 1.04
Total shrub 0.54
Total cover 3.46
Panspot
Thickspike-western wheatgrass Blue grama
Buffalograss Sandberg bluegrass Tumblegrass Foxtail barley Cactus Clubmoss Big sage Total grass Total forb Total shrub Total cover Total minus clubmoss
0.67 0.43 0.85 1.10 0.75 1.69* 0.63 2.40* 0.71 1.39*
1.92 0.29* 1.64 0.32 2.46 0.60 1.58 0.35 1.82 0.61
0.83 0.25* 0.97 0.26* 1.47 0.32* 0.88 0.42 1.29 0.17* 0.58 0.18 0.53 0.47 0.81 0.26* 1.06 0.47* 1.08 0.57* 0.06 0.13 0.00 0.17* 0.00 0.13* 0.03 0.17* 0.04 0.26
0.00 0.00 0.00 0.00 0.00 0.00 0.00 0.08 0.00 0.42
0.83 0.06* 0.65 0.07* 0.42 0.07* 0.57 0.07* 0.24 0.08 9.03 0.19* 10.13 0.31* 8.38 O.ll* 8.75 0.26* 9.38 0.36*
0.81 0.42* 0.74 0.60 0.53 0.47 0.57 0.36 0.32 0.21
5.33 1.38* 4.67 2.54* 5.92 3.10* 4.53 4.13* 5.63 3.24* 10.92 0.50* 11.15 0.85* 9.10 0.54 9.50 0.69 9.74 0.71
0.85 0.65 0.82 0.78 0.64 0.57 0.61 0.46 0.36 0.28
17.10 2.53* 16.64 4.17* 15.65 4.21* 14.64 5.28* 15.72 4.22* 8.07 2.33* 6.51 3.86* 7.28 4.10* 5.89 5.01* 6.35 3.86*
0.04 0.29 0.21
0.21 0.25 0.25 0.33* 0.71 0.17 0.58* 1.29 0.75* 0.21 0.38 0.42 0.25* 0.21 0.04 1.04* 1.88 1.21
0.13 0.21 0.17 0.29 0.13 0.29 0.04 0.17 0.08 0.29 0.08 0.21 0.83 0.21* 1.00 0.42* 0.71 0.50 1.08 0.67* 1.29 1.08 1.08 1.17 0.46 0.21 0.33 0.25 0.29 0.29 0.04 0.00 0.00 0.00 0.13 0.04 1.58 0.88 1.63 1.33 1.50 1.50
6.5 18.6 4.4 13.8 52.0 32.4 74.9 77.1 18.6 19.5 6.5 3.3
5.4 35.5* 15.8 14.6
9.3 4.8 7.7 10.7 0.2 6.2 0.0 1.2 1.8 1.8 47.9 7.0*
2.2 4.6 46.2 77.1* 51.0 16.4
2.7 6.5
’ C = check. ’ F = furrowed.
* Means significantly different from the check (p=O. I
that this increase accounted for about 60% of the herbage production increase on the contour furrowed plots. In this study, contour furrowing increased available soil water, measured as cm- days, 107 and 36%, respectively, on the panspot and saline-upland sites. A regression analysis of the available soil water and yield data indicated that during 1969-75, 67% of the yield variation was explained by soil water differences. However, in 1976, only 40% of the yield variation could be accounted for by available soil water differences. This was due in part to infestations of yellow sweetclover on some of the contour-furrowed sites which, in some instances, more than doubled herbage production. We sus- pect that the ability of sweetclover to fix atmospheric nitrogen was the main reason for the high sweetclover produc- tion, which reemphasizes the role of N in limiting the productivity of these range sites.
Where the inherent productivity is very low, as on the saline-upland site in this study, increases in productivity up to 200% may not be economically feasible. On the panspot site, produc- tivity levels were approaching the range of economic consideration, and treatment application decisions would have to be based on current cost-benefit mtios which are determined primarily by treatment costs, treatment longevity, and livestock values. With a furrowing machine and furrow construction such as discussed by Neff (1973) and Wight (1973), furrowing treatments should cost less than $50/ha ($20/acre).
sulting in increased infiltration and nutrient availability which, in turn, favors increased herbage production. Thus, the beneficial effects of contour furrowing may last well beyond the actual effective life expectancy of the furrows.
Conclusions and Application
The results of this study show that contour furrowing is an effective tool for increasing soil water and herbage production on panspot and saline- upland range sites. Species composi- tion changes were beneficial for in- creased production of grazeable herb- age.
In a previous study on a similar range site, Neff (1973) estimated that furrows lost over half of their water detention capacity within 10 years and had an effective life (at least 1.3 mm water detention capacity) of about 25 years. The furrows in this experiment were carefully constructed with an original water detention capacity of about 40 mm. After 10 years, the furrows were well stabilized and still had about 20 mm water detention capacity. Their effective life should extend well be- yond 25 years. Also, as indicated by the data of Soiseth et al. (1974), the beneficial effects of contour furrowing should be autocyclic-i.e., as more water enters the soil, salinity decreases and herbage production increases, re-
The furrowed panspot site plots averaged 527 kg/ha more herbage than did the check plots. Assuming only 50% utilization of the additional forage
and 370 kg dry matter/AUM for
summer grazing (Cook 1970), contour furrowing would increase the carrying capacity by 0.7 1 AUM/ha per year. For AUM values of $3.00-$6.00, contour furrowing would be worth from $2.13- %.26/ha (0.86-$1.72/acre) per year. The presence of a N-fixing legume, yellow sweetclover, in 1976, greatly enhanced the value of contour furrow- ing on the N-deficient soils. With a yield difference of 1,020 kg/ha be- tween check and furrowed plots; con- tour furrowing would have been worth from $4.14-$8.28/ha per year ($1.67- $3.34/acre per year) in 1976. Also of value, but difficult to give monetary values, are the beneficial effects of contour furrowing for watershed pro- tection and wildlife needs.
Literature Cited
Barnes, 0. K. 1950. Mechanical treatments on Wyoming range land. J. Range Manage. 3~198-203.
Bennett, Hugh Hammond. 1939. Contouring. p. 434-442. In: Hugh Hammond Bennett, Soil Conservation. McGraw-Hill Book Co., Inc., New York and London.
Cook, C. Wayne. 1970. Energy budget of the range and range livestock. Colorado State Univ. Exp. Sta. Bull. TB109.
Neff, Earl L. 1973. Water storage capacity of of contour furrows in Montana. J. Range Manage. 26:298-301.
Neff, E&l L., and J. Ross Wight. 1977. Over- winter soil water recharge and herbage pro- duction as influenced by contour furrowing on eastern Montana rangelands. J. Range Manage. 30:193-195.
Soiseth, R. J., J. R. Wight, and J. K. Aase. 1974. Improvement of panspot (solonetzic) range sites by contour furrowing. J. Range Manage. 27:107-l 10.
Wight, J. Ross. 1973. Range improvement
practices: mechanical arld fertilization. p. 111. In: Proc., The Range Beef Cow, A Symposi- um on Production III. Rapid City, S. Dak. Dec. 17-19.
Wight, J. Ross. 1976. Land surface modifi- cations and their effects on range and forest watersheds. In: Proc. of the Fifth Workshop of the United States/Australia Rangelands Panel: Watershed Management on Range and Forest Lands, Utah State Univ., Logan.
Distribution of Food Reserves in Snowberry
(Symphoricarpus oreophilus)
MELVIN R. GEORGE AND C. M. McKELL
Highlight: A study was conducted in northern Utah in 1974 to determine the distribution of nonstructural carbohydrates (NC) and lipids in snowberry (Symphori-
uzrpus oreophilus). Snowberry biomass was sampled and partitioned into small roots,
large roots, root crowns, old stems, new stems, and leaves, which were analyzed for NC and lipids. The results showed a generally larger pool of NC in stems than in
helowground biomass. Lipids in snowberry remained relatively stable throughout the
growing season and included relatively small amounts of those lipids most likely to
enter metabolism. Thus, lipids apparently do not contribute significantly to the
carbon reserve pool.
Plant food reserves are largely non- structural carbohydrates (NC) but lipids may also be a source of reserve carbon (Cook 1966). Lipids have received little attention as potential food reserves in range plants but have been investigated in alpine plants (Bliss 1962; McCown and Tieszen 1972). Fluctuating lipid concentrations might indicate additional reserve potential because seasonal fluctuations of re- serve compounds imply metabolic use and replacement. Conversely, seasonal constancy of lipid concentrations or qualities indicates that lipids are rela- tively unimportant as reserve com- pounds under normal conditions.
Seasonal trends in NC concentra- tions have been described for many range plants by various researchers (Cook 1966; White 1973), but few researchers have described NC distri-
Authors are assistant professor, Natural Resources Management Department, California Polytechnic State University, San Luis Obispo 93407; and director,
Institute for Land Rehabilitation, Utah State University, Logan 84322.
Manuscript received June 21, 1977.
bution on a quantity basis. Priestly (1962) stated that it was desirable to determine the total quantity of carbo- hydrate reserves in plant storage organs rather than only the concentration of carbohydrate reserves.
Whereas concentration measures of carbohydrates have been used to illus- trate the time sequence of reserve depletion and replenishment, they fail to give an accurate estimate of the amount of carbohydrate reserves in the plant. Reserve amounts can only be determined on an absolute basis, which requires an estimate of total plant biomass.
In this study, NC and lipids were determined both on a concentration and a quantity basis to show the distribution in selected plant parts, and to determine seasonal changes in lipid and NC quantities.
Methods
Biomass of snowberry (Symphoricarpus
oreophilus Gray) was collected in late
April, mid-May and mid-August in 1974 near the Utah State University Forestry
JOURNAL OF RANGE MANAGEMENT 31(2), March 1978
Summer Camp in Logan Canyon 42 km northeast of Logan, Utah. Plants and clones were excavated separately because they have different growth habits. A plant has a single stem at the ground surface with a correspondingly small basal area. In con- test, a clone has a large basal area because many single stems are connected under- ground by the root crown.
Auger samples were taken radially from plants and clones at several depths in each mdial stratification to determine the soil volume that must be excavated to remove root biomass (Schuurman and Goede- waagen 1971). Roots did not extend beyond 31 cm from the stem of single plants or the outer stems of clones. Root depth was limited to 61 cm by the rocky soil at that depth and the claypan at 76-81 cm. Root material belonging to understory species and adjacent shrubs was identified and removed from the soil volume. The remaining root material was sieved, washed and floated from the soil using methods similar to those of McKell et al. (1961). All plant material was dried (80°C) and weighed to determine biomass.
Total biomass over the range of plant and clone sizes varied so greatly that the biomass was separated into four size classes: large clones (7 to 15.5 kg), small clones (2.5 to 7 kg), large plants (0.95 to 3.5 kg), and small plants (0.25 to 0.95 kg). Ten individuals in each size class were excavated. This sample size was great enough to insure a coefficient of variation of & 15% at the 90% level of probability.
During the three periods of biomass sampling, random samples of leaves, new stems, old roots, root crowns, large roots, and small roots (less than 6 mm in