www.ijiset.com
Acute Leukemia Classification based on Image
Processing and Machine Learning Techniques
Najaat AbdullahP
1
P
, Mohammed IbrahimP
2
P
and Adel HaiderP
3
P
1
P
Department of Information Technology, Aden University, Aden, 00967/2, Yemen
P
2
P
Department of Information Technology, Taiz University, Taiz, 00967/4, Yemen
P
3
P
Department of Information Technology, Aden University, Aden, 00967/2, Yemen
Abstract
Acute leukemia is a fast-developing type of blood cancer that gets worse quickly in the children and adults and needs prompt treatment.
Thus, this work displays an attempt that has been made to design a fast and cost-effective computer-aided system for acute leukemia
diagnosis. The white blood cells in the microscopic images of blood smears are initially extracted by the Otsu’s method and a cell
separation algorithm is applied to break up the overlapped cells. Subsequently, several features are extracted from the whole cell,
nucleus, and cytoplasm. The proposed system enhances the acute lymphoid, acute myeloid leukemia and their French, American and
British (FAB) classification accuracy by applying the genetic algorithm to optimize the support vector machine kernel parameters and
feature subset selection. The resulted overall accuracy of 100% for acute lymphoblastic leukemia subtypes and 90.32% for acute
myeloblastic leukemia subtypes are achieved. Therefore, the current system yielded very promising results in terms of classification
accuracy and the extent of acute leukemia subtypes that can be distinguished. However, future research is still needed to develop the
diagnostic accuracy for acute myeloblastic leukemia subtypes.
Keywords: 36Tacute lymphoblastic leukemia, acute myeloblastic leukemia, support vector machine, genetic algorithm, feature subset
selection.
1.
Introduction
Acute leukemia is usually characterized by uncontrolled proliferation of immature cells, either lymphoid or myeloid.
Clinically it is categorized into two classes Acute Lymphoblastic Leukemia (ALL) and Acute Myeloblastic Leukemia
(AML) [1]. Based on the morphology and cytochemical staining of blasts, French-American-British (FAB) divide ALL
into three subtypes; L1, L2, and L3 while AML includes eight subtypes through M0 to M7, which are usually
differentiated based on Peripheral Blood smear (PBS) test. However, the differentiation process subjected to human error
and varies among observers depends upon their experience and interpretation. Thus, computer-aided diagnosis of acute
leukemia based on image processing is suggested as an efficient method to overcome these drawbacks. According to the
literature, most studies in this field can classify the cells in the blood smear images only as cancerous and non-cancerous
cells with only a few some subtypes [2-8]. Hence purpose of this study is to extend the diagnostic process range to include
the other subtypes except that of M6 subtype due to an insufficient dataset. After a literature review in section II. In
details, the methodology used is described in section III, where the location of the cells and the nucleus are firstly
determined. The morphological features such as color, shape and texture features are extracted. Then, the classification
process is performed by using Support Vector Machine SVM kernel functions. Section IV used to summarize the obtained
2.
Related works:
Various techniques have been used in the literature to improve the diagnostic process of non-healthy cells in the blood
smear images. For instance, Rawat, J et al. (2015) [2] offered a system that can differentiate between healthy and
non-healthy cells in an ALL-IDB dataset by using the shape and texture features as the input to the SVM classifier with
achieving an accuracy of 89.8%. When Dumyan, S. and Gupta, A. (2017) [3] used Artificial Neural Network (ANN)
classifier depend on the shape, texture, statistical and moment invariant features extracted from 36 blood smear images to
identify ALL cells, the overall accuracy increased to 97.9%. Negm, A. et al. (2017) [4] proved that ANN and Decision tree
classifier successfully discriminated the leukemia cells by using geometry, color and relative tissue features extracted from
642 images which are collected from a local hospital with achieved an accuracy of 99.519%. However, the study did not
distinguish among the various FAB subtypes.
Due to the need of the pathologist and the difficulties faced those in the routine classification process of different acute
leukemia subtypes, Rawat, J. et al. (2017) [5] used SVM classifier with a rich set of color, shape, and texture features with
genetic algorithm for the recognition of FAB subtypes of ALL, i.e., L1, L2, and L3 as well as AML, i.e., M2, M3, and M5.
The maximum accuracy was 97.1% and 98.5% for ALL and AML subtypes, respectively. Another attempt was introduced
by Kasemi, F. et al. (2016) [6] which focused on the diagnostic methodology of AML subtypes, i.e., M2,M3,M4 and M5,
by using SVM classifier with Hausdorff Dimension (HD), irregularity, texture, color and shape features extracted from
330 digital images admitted to Shariati hospital. The differentiation accuracy was 87%. While Reta, C. et al. (2015) [7]
combined different classifiers to achieve accuracy of 90% in subtypes diagnosis due to the reduction in the number of false
positives and false negatives presented different classifiers.
3.
Methodology
3.1
Database Description:
In order to develop an efficient and robust computer-aided diagnosis system for acute leukemia, different staining images
are used. The first collection of images has been taken from Acute Lymphoblastic Leukemia Image Database for Image
Processing (ALL-IDB), where images have been captured with an optical laboratory microscope coupled with a Canon
PowerShot G5 camera [8]. While the second one was collected from the American Society of Hematology (ASH) image
bank that provides a high-quality web-based image library for hematological blood images labeled by an expert pathologist
[9]. The third set of the collection was pictured from the Sutterstock image bank where is American stock photography
offers the best quality images [10]. The last set of the collection was gathered from Pathpedia.com which is a
comprehensive web-based resource for clinical and experimental pathology that offers hundreds of quality images [11]. The
collection of this study database consists of 132 images of normal and acute leukemia blood smear images labeled by the
pathologist. In details, it comprises of 50 images for normal patients, 27 images for ALL patients and 55 for AML patients.
A total of 413 sub-images consist of 91 sub-images of normal cells, 106 sub-images of ALL cells and 216 of AML cells.
www.ijiset.com
Healthy Cells
ALL AML
Non-Healthy Cells
Fig. 1 Healthy and Non-healthy blood smear images
3.2
Proposed Computer-aided Diagnosis for Acute Leukemia:
The main diagram for acute leukemia diagnostic process in blood smear images is shown in Fig. 2. It consists of four
stages; segmentation, feature extraction, feature subset selection, and classification. The segmentation stage is used to
extract and identify the cells and their nucleus from different images. To differentiate among cells, the morphological
features such as color, geometry and texture features are extracted by feature methods in the second stage. The informative
features that reduce the accuracy are omitted in the following stage. The selected features are then processed by the
www.ijiset.com
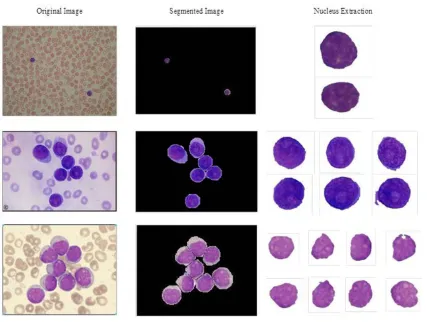
3.2.1 Segmentation Stage
The segmentation stage is used to extract the leukocyte (White Blood Cells (WBCs)), i.e., the region of interest for acute
leukemia diagnostic process from the input images [12]. The general steps used are described as follows.
In the first step, the blood smear image is acquired from the database and converted to the L*a*b* color space in the second
step [13]. Then the Otsu’s method is used to extract the WBCs from the b* component in order to produce the binary
image. In the following step, the remaining background is eliminated by using morphological operations; filling holes and
opening [14]. To identify the single and overlapped cells two measures; the total number of pixels of the object (area) and
the ratio of the area of an object to the area of a circle with the same perimeter (compactness) are used [15]. To properly
distinguish the overlapped cells, the value of less than 0.83 can be used as a threshold in the compactness measure. The area
of the cell should be more than
7000/𝑓𝑎𝑐𝑡𝑜𝑟
, where the selected𝑓𝑎𝑐𝑡𝑜𝑟
depends on the dimension of each image.K-means clustering and modified watershed algorithm were used to separate the overlapping cells as described in Algorithm 1
[15, 16].
Algorithm 1
Step1: In the first step, the image is converted to the L*a*b* color space.
Step2: Then, k-means clustering is applied with a value of k=3.
Step3: To determine the nuclei in which cluster, the cluster with a minimum mean of b* layer is used as the
nuclei cluster.
Step4: Morphological operations are used to save and smooth the shape of the nuclei.
Step5: A modified watershed transform is first applied to separate the nuclei.
Step6: Finally, the modified watershed transform is used to separate the cells based on the gradient method.
Step7: The boundary of each cell is smoothed by using the opening operation.
Finally, the nucleus of the produced cell is extracted by using the k-means cluster, then the cytoplasm is obtained by
subtracting the nucleus from the whole cell in order to select the suitable features that can be used in the feature extraction
Fig. 3 The outcome of the segmentation stage
3.2.2 Feature Extraction Stage
Feature extraction is an important aspect in the pattern recognition and machine learning tasks in which the visual
information, morphological changes in cells, shown in the peripheral blood smear is the first step for diagnosis acute
leukemia [17]. Thus, the morphological features can be used as a magic tool to distinguish between normal and abnormal
cells. In general, there are no specific features can be appropriately used for all kinds of computer vision application.
Therefore, the current morphological features used for normal, ALL and AML cell differentiation are summarized in Table
I [18].
On the basis of Table 1, the goal of this stage is to extract the distinct group of features such as color, geometry and texture
features that can be used by pathologists to recognize acute leukemia cell.
Table 1: the morphological features in normal, myeloblastic and Lymphoblastic cells
Morphological Feature Normal Myeloblastic Lymphoblastic
Size Medium Medium to large Smaller to medium
Cytoplasm Rough Moderate Scanty
Auer Rod Absent May be present Absent
Nuclear Chromatin Clogged Fine Coarse
www.ijiset.com
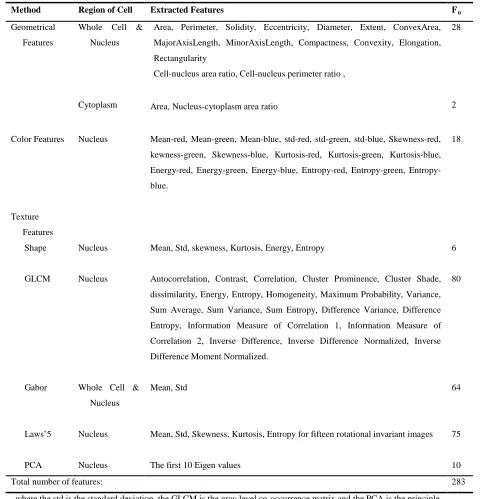
To achieve this goal, different types of features calculated from the sub-images have been extracted namely geometry,
color, shape, statistical method (GLCM), transform domain-based model (Gabor), signal processing based (Law’s mask)
and PCA [19-21]. The brief description of the extracted features of the cell and its nucleus and cytoplasm is given in Table
2.
Table 2: Extracted features of cell and its nucleus and cytoplasm used
Method Region of Cell Extracted Features FRn
Geometrical
Features
Whole Cell &
Nucleus
Area, Perimeter, Solidity, Eccentricity, Diameter, Extent, ConvexArea,
MajorAxisLength, MinorAxisLength, Compactness, Convexity, Elongation,
Rectangularity
Cell-nucleus area ratio, Cell-nucleus perimeter ratio ,
28
Cytoplasm Area, Nucleus-cytoplasm area ratio 2
Color Features Nucleus Mean-red, Mean-green, Mean-blue, std-red, std-green, std-blue, Skewness-red,
kewness-green, Skewness-blue, Kurtosis-red, Kurtosis-green, Kurtosis-blue,
Energy-red, Energy-green, Energy-blue, red, green,
Entropy-blue.
18
Texture
Features
Shape Nucleus Mean, Std, skewness, Kurtosis, Energy, Entropy 6
GLCM Nucleus Autocorrelation, Contrast, Correlation, Cluster Prominence, Cluster Shade,
dissimilarity, Energy, Entropy, Homogeneity, Maximum Probability, Variance,
Sum Average, Sum Variance, Sum Entropy, Difference Variance, Difference
Entropy, Information Measure of Correlation 1, Information Measure of
Correlation 2, Inverse Difference, Inverse Difference Normalized, Inverse
Difference Moment Normalized.
80
Gabor Whole Cell &
Nucleus
Mean, Std 64
Laws’5 Nucleus Mean, Std, Skewness, Kurtosis, Entropy for fifteen rotational invariant images 75
PCA Nucleus The first 10 Eigen values 10
Total number of features: 283
, where the std is the standard deviation, the GLCM is the gray level co-occurrence matrix and the PCA is the principle
3.2.3 Feature Selection Stage
In order to reduce the training time, decrease the associated overfitting risk and improved the classification accuracy, the
unnecessary, redundant or irrelevant features should be removed from a high dimensional dataset. In machine learning,
selecting informative features is done by feature selection methods such as Genetic Algorithm (GA) [22], Practical Swarm
Optimization (PSO) [23], which at the same time use to optimize the SVM kernel function parameters in order to get the
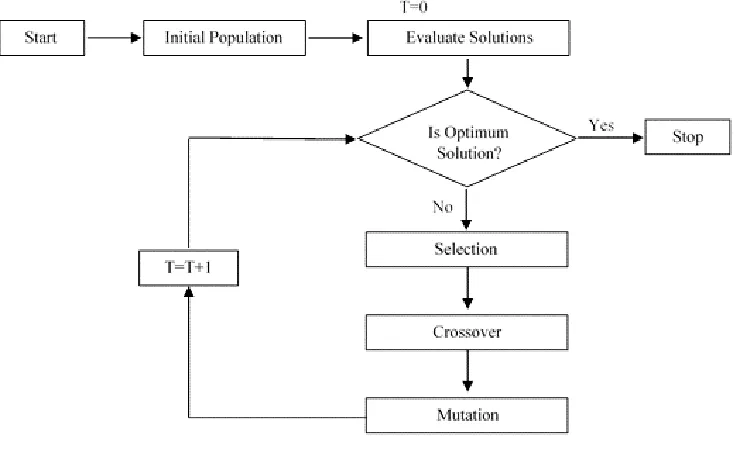
best classification accuracy [5]. Thus, in this study the GA which mimics the biological evaluation simultaneously used to
optimize the SVM parameters and feature subset selection. The basic steps of the genetic algorithm are shown in Fig. 4.
After careful observation of the several preliminary runs the initial genetic algorithm parameters used are listed in Table 3.
Fig. 4 The basic steps of the genetic algorithm used
Table 3. The initial Genetic Algorithm Parameters used
GA Parameter Setting
∁ 0 - 2P
20
𝜸 2P
-20
P
- 0
Generations Number 300
Population Size 100
Selection type Tournament
Crossover type Single-point crossover
Crossover Probability 0.8
www.ijiset.com
3.2.4 Classification Stage
The main purpose of this stage is to discriminate the cancerous cells and find out various subtypes of acute leukemia. The
classification stage of the current study is consisting of four modules; the first module used to recognize the non-healthy
cells from healthy cells (NHCs/HCs). The second module is allocated to classify the non-healthy cells into Acute
Lymphoblastic cells (ALCs) and Acute Myeloblastic cells (AMCs). In the third module, the ALCs are further classified into
subtypes according to FAB classification, while the fourth module is dedicated to classifying the AMCs into their subtypes.
These modules are designed by using the SVM classifier which is considered as a supervised learning model to construct an
optimum hyperplane in the higher dimensional space [24]. Thus, the data points can be separated among different classes
according to their labels with minimum expected risk. In the case of Non-Linear data separation, a kernel function is
introduced to map the data points into the higher dimensional space. Consequently, to obtain a better classification
performance, the kernel parameters
∁
and𝛾
for each set of training data should be set properly [25, 26].4.
Experiments and results
The proposed system was performed in Intel® Core™ i7-2670 QM CPU@ (2.20 GHz, 8 cores), 8 GRAM runs under
windows 7 operating system and the development environment is MATLAB 2017 with Libsvm software [27]. A
computer-aided system was designed for acute leukemia diagnosis from blood smear images. The conducted experiments and the
classification performance are reported in this section. ALL and AML subtypes are diagnosed based on the presence of the
non-healthy cells.
Experiment 1: Classification for HCs/NHCs cells using various SVM kernel functions
In this experiment, the classifier was designed for Healthy Cells/Non-Healthy Cells (HCs/NHCs) differentiation using
various SVM kernel functions. The classifier performance of each kernel function is reported in Table 4. As can be seen
from the table, the highest accuracy of 89.43% is achieved using the RBF kernel function. The obtained Cohen’s kappa
value is 62.70% for RBF, 59.57% for linear and 61.87% for polynomial kernel function using default parameters. While the
f-measure is 84.02% for RBF, 80.79% for linear and 81.21% for polynomial kernel function. According to these results,
RBF kernel function is selected for genetic algorithm implementation in order to enhance the classification accuracy. Table
IV shows that achieved accuracy after applying the GA on the selected kernel function (RBF) is 99.19% with Cohen’s
kappa value of 97.60% and the f-measure of 98.81%.
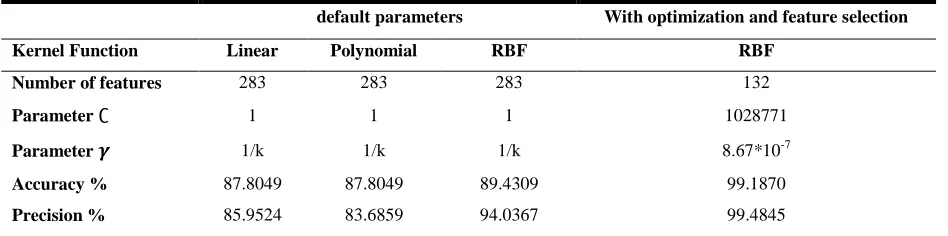
Table 4. Classification performance for HCs/NHCs cells using various SVM kernel functions
default parameters With optimization and feature selection
Kernel Function Linear Polynomial RBF RBF
Number of features 283 283 283 132
Parameter ∁ 1 1 1 1028771
Parameter 𝜸 1/k 1/k 1/k 8.67*10P
-7
Accuracy % 87.8049 87.8049 89.4309 99.1870
Sensitivity % 76.2153 78.8773 75.9259 98.1481
F-Measure % 80.7915 81.2105 84.0164 98.8118
Cohen's kappa % 59.5661 61.8723 62.7012 97.5953
where; k is the number of the features
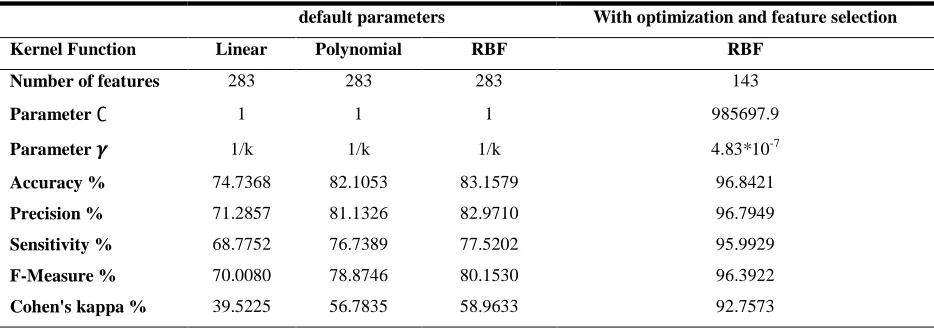
Experiment 2: Classification for ALCs/AMCs using various SVM kernel functions
The classifier in this experiment was built to discriminate Acute Lymphoblastic Cells (ALCs) from Acute Myeloblastic
Cells (AMCs) by using kernel functions and the classifier performance results are presented in Table 5. The highest
accuracy of 83.16% is also achieved using the same kernel function (RBF). The Cohen’s kappa statistic is 58.96% for RBF,
39.52% for linear and 56.78% for polynomial kernel function under default conditions. The f-measure is 80.15% for RBF,
70.01% for linear and 78.87% for polynomial kernel function. On the basis of these results, the genetic algorithm is used to
find suitable kernel parameters with which the SVM classifier achieved the highest accuracy of 96.84%. Cohen’s kappa
statistic has significantly increased to 92.76% and the f-measure becomes 96.39%.
Table 5. Classification performance for ALCs/AMCs using various SVM kernel functions
default parameters With optimization and feature selection
Kernel Function Linear Polynomial RBF RBF
Number of features 283 283 283 143
Parameter ∁ 1 1 1 985697.9
Parameter 𝜸 1/k 1/k 1/k 4.83*10P
-7
Accuracy % 74.7368 82.1053 83.1579 96.8421
Precision % 71.2857 81.1326 82.9710 96.7949
Sensitivity % 68.7752 76.7389 77.5202 95.9929
F-Measure % 70.0080 78.8746 80.1530 96.3922
Cohen's kappa % 39.5225 56.7835 58.9633 92.7573
where; k is the number of the features
Experiment 3: Classification for ALL subtypes using various kernel functions
The experiment was performed in the FAB classification of ALCs into L1, L2, and L3 classes using the default and
optimized SVM kernels. The classifier performance of each kernel function is recorded in Table 6. From Table VI, we can
clearly state that the RBF kernel achieved an overall accuracy of 87.10%. The calculated Cohen’s kappa value is 80.35%
for RBF, 75.67% for linear and 71.03% for polynomial kernel function. When the experimental procedures are not
optimized. The f-measure is 87.99% for RBF, 85.12% for linear and 81.38% of the polynomial kernel. However, after
applying the genetic algorithm to optimize the selected kernel function the classification accuracy greatly increased to the
maximum value of 100% with the Cohen’s kappa statistic of 100% and f-measure also improved to the maximum value of
www.ijiset.com
Table 6. Classification performance for ALL subtypes using various kernel functions
default parameters With optimization and feature selection
Kernel Function Linear Polynomial RBF RBF
Number of features 283 283 283 135
Parameter ∁ 1 1 1 478200.46
Parameter 𝜸 1/k 1/k 1/k 3.95*10P
-7
Accuracy % 83.8710 80.6452 87.0968 100.0000
Precision % 85.6061 80.9091 89.1534 100.0000
Sensitivity % 84.6296 81.8519 86.8519 100.0000
F-Measure % 85.1150 81.3777 87.9876 100.0000
Cohen's kappa % 75.6672 71.0280 80.3487 100.0000
where; k is the number of the features
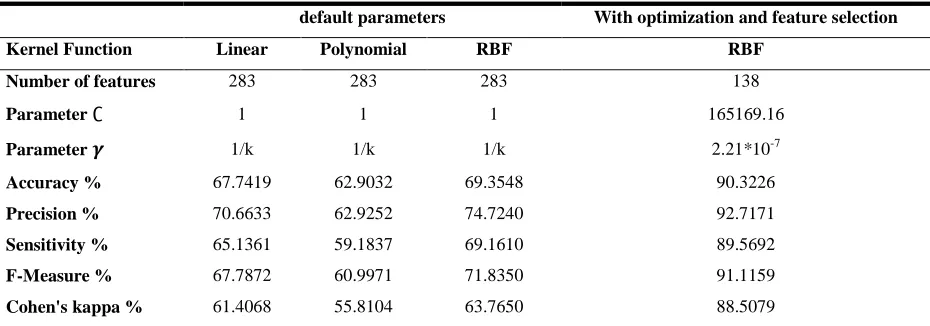
Experiment 4: Classification for AML subtypes using various kernel functions
This experiment was designed for the FAB classification of the AMCs into M0 through M7 except M6 classes using the
default and optimized SVM kernels. The performance values of the designed classifier are reported in Table 7. From Table
VII, it can be observed that the highest accuracy of 69.35% is obtained by the RBF kernel function. The calculated Cohen’s
kappa coefficient value is 63.77% for RBF, 61.41% for linear and 55.81% for polynomial kernel function using default
parameters. The f-measure is 71.84% for RBF, 67.79% for linear and 61.00% for polynomial kernel function. When we
used the genetic algorithm to optimize the selected kernel function, the classification accuracy has gained increased to
90.32% with Cohen’s kappa value of 88.51% and the f-measure becomes 91.12%. The value of the classification accuracy
strongly depends on the feature subset selection and the SVM kernel parameter optimization.
Table 7. Classification performance for AML subtypes using various kernel functions
default parameters With optimization and feature selection
Kernel Function Linear Polynomial RBF RBF
Number of features 283 283 283 138
Parameter ∁ 1 1 1 165169.16
Parameter 𝜸 1/k 1/k 1/k 2.21*10P
-7
Accuracy % 67.7419 62.9032 69.3548 90.3226
Precision % 70.6633 62.9252 74.7240 92.7171
Sensitivity % 65.1361 59.1837 69.1610 89.5692
F-Measure % 67.7872 60.9971 71.8350 91.1159
Cohen's kappa % 61.4068 55.8104 63.7650 88.5079
5.
Discussion:
From the above experiment results, the computer-aided system works essentially perfectly for acute leukemia subtypes
diagnosis. It shows that the obtained results significantly enhanced after applying the genetic algorithm. Comparing these
results with those from work of Negm, A. et al. (2017)[4] which use ANN and Decision Tree classifier rather than SVM,
we see that these authors achieved approximately the same results for discrimination of healthy and cancerous cells. In the
case of AML subtypes classification process Rawat, J. et al. (2017)[5] achieved better results of 98.5% than the present
study of 90.32%, we believe this difference is due to their extremely low number of AML subtypes. However, the present
study achieved the highest accuracy for the 3-classes classification of ALL subtypes of 100%. The promising results
obtained from this study indicate that the computer-aided system can be efficiently used by the pathologist for acute
leukemia diagnosis.
6.
Conclusion
An acute leukemia diagnosis is an important challenge amongst the most Hematopathology issues. Thus, a computer-aided
diagnostic system is utilized for the detection of acute leukemia subtypes by using Otsu’s method to extract the WBCs. The
k-means clustering and the modified watershed algorithm are used to separate the overlapped cells. Then both whole-cell
and nucleus have been extracted. The GA is applied to optimize the SVM kernel parameters and feature subset selection.
The overall accuracy of the developed computer-aided system is 99.19% for healthy and non-healthy cells on selected 132
subset features. The discrimination accuracy for ALL and AML types is 96.84% is gained with 143 subset features. The
highest accuracy obtained from FAB subtypes of ALL is 100% is gained using 135 subset features while the maximum
accuracy for the FAB subtypes of AML is 90.32% achieved by using a radial basis kernel function with 138 subset
features. It concludes that the proposed system could be efficiently employed as a diagnostic tool to give help for FAB
subtypes detection, i.e., L1, L2, L3 as well as M0, M1, M2, M3, M4, M5 and M7.
References
[1] B. J. Bain, A beginner's guide to blood cells. UK: Blackwell, 2004.
[2] J. Rawat, A. Singh, H. Bhadauria, and J. Virmani, "Computer aided diagnostic system for detection of leukemia using microscopic images," Procedia Computer Science, Vol. 70, 2015, pp. 748-756.
[3] S. Dumyan and A. Gupta, "An Enhanced Technique for Lymphoblastic Cancer Detection Using Artificial Neural Network," International Journal of Advanced Research in Computer Science and Electronics Engineering (IJARCSEE), Vol. 6, 2017, pp. pp: 38-42.
[4] A. S. Negm, O. A. Hassan, and A. H. Kandil, "A decision support system for Acute Leukaemia classification based on digital microscopic images," Alexandria Engineering Journal, 2017.
[5] J. Rawat, A. Singh, H. Bhadauria, J. Virmani, and J. S. Devgun, "Computer assisted classification framework for prediction of acute lymphoblastic and acute myeloblastic leukemia," Biocybernetics and Biomedical Engineering, Vol. 37, 2017, pp. 637-654.
[6] F. Kazemi, T. A. Najafabadi, and B. N. Araabi, "Automatic recognition of acute myelogenous leukemia in blood microscopic images using K-means clustering and support vector machine," Journal of medical signals and sensors, Vol. 6, 2016, p. 183.
[7] C. Reta, L. Altamirano, J. A. Gonzalez, R. Diaz-Hernandez, H. Peregrina, I. Olmos, et al., "Segmentation and classification of bone marrow cells images using contextual information for medical diagnosis of acute leukemias," PloS one, Vol. 10, 2015, p. e0130805. [8] R. D. Labati, V. Piuri, and F. Scotti, "All-IDB: The acute lymphoblastic leukemia image database for image processing," in Image
processing (ICIP), 2011 18th IEEE international conference on, 2011, pp. 2045-2048.
[9] ASH Image Bank. (2018). Acute myeloid leukemia. Available: https://imagebank.hematology.org/ [10] shutterstock. (2019). Acute myelogenous leukemia images. Available:
https://www.shutterstock.com/search/acute+myelogenous+leukemia [11] PathPedia. (2019). Histopathology of blood cells. Available:
www.ijiset.com
[12] N. Patel and A. Mishra, "Automated leukaemia detection using microscopic images," Procedia Computer Science, Vol. 58, 2015, pp. 635-642.
[13] V. S. Rathore, M. S. Kumar, and A. Verma, "Colour based image segmentation using l* a* b* colour space based on genetic algorithm," International Journal of Emerging Technology and Advanced Engineering, Vol. 2, 2012, pp. 156-62.
[14] S. Shafique and S. Tehsin, "Computer-Aided Diagnosis of Acute Lymphoblastic Leukaemia," Computational and mathematical methods in medicine, Vol. 2018, 2018.
[15] N. Ghane, A. Vard, A. Talebi, and P. Nematollahy, "Segmentation of white blood cells from microscopic images using a novel combination of K-means clustering and modified watershed algorithm," Journal of medical signals and sensors, Vol. 7, 2017, p. 92. [16] P. P. Acharjya and D. Ghoshal, "Watershed segmentation based on distance transform and edge detection techniques," International
Journal of Computer Applications, Vol. 52, 2012.
[17] H. T. Madhloom, S. A. Kareem, and H. Ariffin, "A robust feature extraction and selection method for the recognition of
lymphocytes versus acute lymphoblastic leukemia," in 2012 international conference on advanced computer science applications and technologies (ACSAT), 2012, pp. 330-335.
[18] W. Ladines-Castro, G. Barragán-Ibañez, M. Luna-Pérez, A. Santoyo-Sánchez, J. Collazo-Jaloma, E. Mendoza-García, et al., "Morphology of leukaemias," Revista Médica del Hospital General de México, Vol. 79, 2016, pp. 107-113.
[19] S. Kumar, "Automated diagnosis of acute lymphocytic leukemia and acute myeloid leukemia using multi-SV," Journal of Biomedical Imaging and Bioengineering, Vol. 1, 2017.
[20] A. Humeau-Heurtier, "Texture feature extraction methods: A survey," IEEE Access, Vol. 7, 2019, pp. 8975-9000.
[21] H. A. Elnemr, "Statistical analysis of law's mask texture features for cancer and water lung detection," International Journal of Computer Science Issues (IJCSI), Vol. 10, 2013, p. 196.
[22] J. Cervantes, X. Li, and W. Yu, "Using genetic algorithm to improve classification accuracy on imbalanced data," in 2013 IEEE International Conference on Systems, Man, and Cybernetics, 2013, pp. 2659-2664.
[23] S. M. H. Bamakan, H. Wang, and A. Z. Ravasan, "Parameters optimization for nonparallel support vector machine by particle swarm optimization," Procedia Computer Science, Vol. 91, 2016, pp. 482-491.
[24] S. T. Ikram and A. K. Cherukuri, "Improving accuracy of intrusion detection model using PCA and optimized SVM," Journal of computing and information technology, Vol. 24, 2016, pp. 133-148.
[25] A. Kharrat, N. Benamrane, M. B. Messaoud, and M. Abid, "Evolutionary Support Vector Machine for Parameters Optimization Applied to Medical Diagnostic," in VISAPP, 2011, pp. 201-204.
[26] J. Virmani, V. Kumar, N. Kalra, and N. Khandelwal, "Prediction of liver cirrhosis based on multiresolution texture descriptors from B-mode ultrasound," International Journal of Convergence Computing, Vol. 1, 2013, pp. 19-37.
[27] LIBSVM. (2018, July 15). Libsvm -- a library for support vector machines. Available: https://www.csie.ntu.edu.tw/~cjlin/libsvm/
Najaat Ahmed Ahmed Abdullah She obtained her B.Sc in the Information Technology from Taiz University 2008. She is currently, a master candidate in the Information Technology department, Faculty of Engineering, University of Aden, Aden, Yemen. She is an employee of the Supreme Commission for Elections & Referendum, Taiz, Yemen. She worked as a teaching assistant in Taiz University for one semester. She has published an article on
Mathematical Model of Computer Aided Detection for Acute Leukemia. Her research interest is in Image Processing and Computer Vision, Pattern Recognition.
Mohammed A. M. Ibrahim born in Taiz city, Yemen, received his BSc degree in computer science from Baghdad University, Iraq, in 1991, also he received his MSc in computer science & engineering from Shanghai University, China, 1996, and his PhD degree in computer science and engineering from Shanghai Jiaotong University, China, 2003, his research interests include grid computing, cloud computing, distributing computing, network computing, network security.