A New Bio Mathematical ABR Model to Estimate the Age
Specific
CHD Mortality Rates Using Normal Distribution
R. Vijayakumar*, Dr. A. Muthaiyan** & G. Vijayaprabha***
* Assistant Professor, Department of Mathematics, Srinivasan Engineering College, Perambalur, Tamilnadu, India
** Assistant Professor, PG Research & Department of Mathematics, Government Arts College, Ariyalur, Tamilnadu, India
*** Assistant Professor, Department of Mathematics, Dhanalakshmi Srinivasan Engineering College, Perambalur, Tamilnadu, India
Abstract:
The gender difference (gender gap) in mortality due to coronary heart disease (CHD) decreases with age. This relationship has not been well characterized in diverse populations. The purpose of this study wad to examine the age specific coronary heart disease mortality rates in men compared with women through multi server queueing model (ABR Model) with the help of normal distribution.
Key Words: Coronary Heart Disease, Hormone Replacement Therapy, Available Bit Rate Model & Normal Distribution.
Introduction:
Although Coronary Heart Disease (CHD) is the leading cause of death in men and women, age-specific CHD mortality rates are strikingly higher in men compared with women. In general, both CHD incidence and mortality rates in women lag 10 years behind those of men [9]. It is well established that the gender difference is more pronounced at younger ages, such that 1 in 17 women has had a coronary event before age 60, in contrast with 1 in 5 men. The gender difference has been reported to decrease with age and after age 60, CHD accounts for 1 in 4 deaths in both sexes. Previous United States based studies addressing gender differences in CHD mortality have been limited to predominantly Caucasian populations [7, 22 & 25]. Many studies have also examined black and white differences in CHD mortality, but none has directly compared the gender gap between ethnic groups [2, 6, 8, 26 & 27]. The gender gap in CHD mortality has been attributed to various factors. Differential prevalence and impact of traditional cardiovascular risk factors have been shown to account for part but not all of the gender difference. Estrogen has been implicated as a possible protective factor in women because of an observed 2-fold increased CHD incidence in surgically postmenopausal vs premenopausal women of the same age. However, the use of hormone replacement therapy (HRT) has not been shown to reduce CHD events in postmenopausal women and the role of endogenous estrogen in the cardio protection of women compared with men is not completely understood. International data suggest that geography, secular trends, and environmental factors also play a role in gender differences in CHD occurrence [26]. The purpose of this study wad to examine the age specific coronary heart disease mortality rates in men compared with women through multi server queueing model (ABR Model) with the help of normal distribution.
The diverse characteristics and service requirements of the different traffictypesthat are carried by ATM (Asynchronous Transfer Mode) networks have led to the definitionof different service categories that should be offered to users of such a network.We briefly discuss those differences, distinguishing three large categories: Constant Bit Rate (CBR) traffic, Variable Bit Rate (VBR) traffic and Available Bit Rate(ABR) traffic.The CBR service class guarantees a fixed pre-determined transmission capacity toits users. Therefore, this service is useful for traffic that requires both very small (orno) delays and very small (or no)
losses. At the burstlevel (where we distinguishdifferent bursts of traffic coming from the same connection, but not the separate ATM cells that form a burst), it is reasonable to assume that all CBR traffic requiresa fixed amount of capacity over time. In all further considerations, we will leave outthe CBR traffic and use the term "capacity" to indicate the total capacity minus thecapacity reserved for CBR traffic.
For VBR traffic, we make a subdivision into real time and non real time connections. For both these subclasses, the users must specify many characterizing parameterssuch as minimum cell rate, mean cell rate, peak cell rate and maximum burst size. The difference lies in the requirements. The main issue for real time connectionssuch as voice and possibly video is the delay of the transmission; the loss ofsmall amounts of information during the transmission is less important for these connections.This traffic lends itself very well for multiplexing. On the other hand, non real time VBR traffic requires small losses and the delays are less important. To ensurethat losses are small, large buffers are used to store non real time VBR trafficwhen the communication network is heavily loaded.
The last category, ABR traffic, was introduced to cope with specific problems thatarise when transmitting data. For this traffic, losses lead to retransmission of data (because of the extreme sensitivity to losses), which introduces a lot of overhead in implementations.Since transmission delays are of less importance for data traffic, the setting of non real time VBR seems to be the appropriate one to carry data traffic.However, data traffic is very bursty and the required parameters for VBR connectionsare difficult to specify by the users. For ABR connections, no parameters need to bespecified. Only a small amount of capacity is reserved for the transmission of ABRtraffic. Additionally, the capacity that is not currently being required by VBR (andCBR) traffic is used for ABR traffic. When the total capacity currently available toABR is too small, ABR traffic is stored in very large buffers, ensuring a small lossprobability, until the available capacity increases again. The advantage here is thatABR traffic gets all the capacity that is left over. For the server, this means a higherutilization of the network’s resources. As pointed out above, the main service guaranteefor ABR traffic is a very small loss fraction or, in principle, no loss at all. No guaranteecan be given on transmission delays.
Model Classification:
A special issue of ABR is that the available capacity should be shared fairly among all ABR users. In queueing models, it seems reasonable to incorporate thiswith the queue discipline of processor sharing. In this discipline, all "customers" receivean equal share of the service capacity.In addition to the large storage buffers, some feedback control mechanism can beused to keep the loss of information small. The buffers can store incoming data that cannot be transmitted immediately, due to a temporarily overloaded system. Feedbackcontrol can be used to slow down data sources when the buffers are heavilyloaded and an overflow may occur. We refer to the ATM Forum for more detailed specifications of ABR.
In [18], Ritter investigates the problem of dimensioning the buffer for ABR traffic in order to avoid large losses. In [19] and [20], Ritter considers the case with feedback control, under the assumptionthat the source of ABR traffic is saturated. A drawback in most studies is the assumption of a fixed available capacity fortransmission of ABR traffic. As it was pointed out above, one of the essential featuresof ABR is that it makes use of the capacity that is left over by VBR traffic.Therefore, there is a need for a detailed performance analysis of ABR in the presenceof other traffic.
Our model is basically a multi-server queue with two types of customers: (i) highpriority customers (real time VBR traffic) and (ii) low priority customers (ABR traffic). We assume that the high priority customers have a waiting room with afinite, typically small capacity - thus modeling the real time requirement and eachaccepted customer is served by a single server. Low priority customers have an infinite waiting room and equally share the
remaining capacity according tothe processor sharing principle - this models the large storage buffers for ABR trafficand the fair sharing of the available capacity between ABR users. The servers at theservicestation are divided into two groups: (i) there are N servers that are dedicatedprincipally to the high priority customers and (ii) NL servers are purely reserved for the low priority traffic. On the normal servers, the high priority customers have preemptive priorityover the low priority customers.
We point out that this is a call level model: A customer represents a request of anABR source to transmit data, and the service requirement of the customer isidentified with the amount of data to be transmitted. In our analysis, we assumethat arrivals occur according to two independent Poisson processes. This assumptionis justified in the case where many sources are connected to the communicationnetwork.Although we present the model in the context of ABR traffic, it can justas easily be seen in the context of existing situations, where real time VBR haspriority over non realtime VBR. In this case, the processor sharing discipline for thelow priority traffic should be replaced by the First Come First Served (FCFS) discipline. Also, the processor sharing among ABR sources is interesting in the light of per Virtual Connection (VC) queueing, where sources do not queue behind one another, but each source gets a separate access to the server.The feature of processor sharing can further be generalized to weighted fair queueing, where the total capacity is divided between the activesources according to some weighting factors.
Related twodimensional Markov models have been studied in a number of papers. The case where both types of customers have an infinite waiting space, and within each customer type the service discipline is FCFS [11]. In [3] treated the preemptive case with processor sharing among the low priority customers.A discretetime variant modeled as an M/G/l type Markov Chain is considered in [4]. A more extensive treatment of the spectral analysis of M/G/l type Markov Chains is given in [5]. A model related to the one presented in this paper, addressing the case withfinite buffer capacity, is treated in [16]. In [1], consider a model similar to ours and give various performance measures in terms of the steady state distribution, rather than analyzing this distribution in greater detail.Our main goal is to give a detailed analysis of the steady state distribution itself.
In our analysis we are inspired, but we make useof methods from other approaches. Instead of transforming the involved distributions into generating functions, the present work focuses directly on the distribution itself.It does so relying mainly on the matrix geometric approach of [15] and the spectral expansion approach [10] & [12]. In this paper, we give a complete characterization of the joint distribution of the numbers of customersof both types in the system at steady state. Numerical results are presentedto illustrate the effect of high priority traffic on the service performanceof low priority traffic.
4. The Equilibrium Distribution:
Consider𝑅 has 𝑁+𝐾+ 1 different eigenvalues in the interval(0,1); therefore, the equilibrium distribution can be written as
𝜋�𝑗 = ∑𝑁+𝐾𝑘=0 𝛼𝑘(𝑟𝑘)𝑗𝑣̅𝑘, 𝑗 ≥0
We orderthe eigenvalues of 𝑅 as 0 < 𝑟0 <𝑟1 < ⋯< 𝑟𝑁+𝐾 < 1 (note that 𝑟𝑘 is the root of𝜏𝑘(𝑧)in the unit interval), and construct the diagonal matrix 𝛬= 𝑑𝑖𝑎[𝑟0,𝑟1, … ,𝑟𝑁+𝐾]. The corresponding eigenvectors 𝑣̅0,𝑣̅1, … ,𝑣̅𝑁+𝐾compose the matrix 𝑉, 𝑣̅𝑘 being the (𝑘+ 1)row of 𝑉. Remember that 𝑣̅𝑘 can befound as the left nullvector of the matrix𝑇(𝑟𝑘). We have the Jordan decomposition 𝑅 =𝑉−1𝛬𝑉. The equilibrium distribution is fully determined as soon as we have 𝜋�0, which must satisfy:
𝜋�0�𝑄00+𝑅𝑇(−)�= 0� (1)
Here𝑄00+𝑅𝑇(−) is an irreducible generator, and therefore (1) has a positive solution, which is unique up to multiplicationby a scalar. Obviously, if we let 𝑒 be the (𝑁+𝐾+
1)dimensional vector withall elements equal to 1, it must be that:
𝜋�0(𝐼 − 𝑅)−1𝑒=𝜋�0∑∞𝑗=0𝑅𝑗𝑒= ∑∞𝑗=0𝜋�𝑗𝑒= 1 (2) Together, (1) and (2) completely determine 𝜋�0. Since we want to have the 𝜋�𝑘 as in (8), or equivalently in matrix form
𝜋�𝑗 =𝛼�𝛬𝑗𝑉 Were write (1) and (2) to:
𝛼��𝑉𝑄00+𝛬𝑉𝑇(−)�= 0� 𝛼�(𝐼 − 𝛬)−1𝑉𝑒= 1 This determines 𝛼�= (𝛼0,𝛼1, … ,𝛼𝑁+𝐾)
An alternative way of finding the coefficients 𝛼𝑘 in the present model is by using𝑝𝑖 = 𝑝0�(𝜌𝐻)𝑖⁄ �𝑖! ,𝑖 = 1,2, … ,𝑁 −1. Denoting by 𝑝̅the vector (𝑝0,𝑝1, … ,𝑝𝑁+𝐾) with
𝑝𝑖 = 𝑃{𝑋𝐻 =𝑖}, it must hold that:
𝛼�(𝐼 − 𝛬)−1𝑉= ∑∞𝑗=0𝜋�𝑗 = 𝑝̅ In particular, the low priority queue length distribution is given by: 𝑃{𝑋𝐿= 𝑗} =𝛼�𝛬𝑗𝑉𝑒= ∑𝑁+𝐾𝑘=0 𝛼𝑘(𝑟𝑘)𝑗𝑣̅𝑘𝑒
If we had used the normalization𝑣̅𝑘𝑒= 1 for the eigenvectors, this would have become 𝑃{𝑋𝐿= 𝑗} =∑𝑁+𝐾𝑘=0 𝛼𝑘(𝑟𝑘)𝑗 (3) However, note that it remains to be verified whether the elements of some 𝑣̅𝑘 sum up to 0. If that is the case, the corresponding term in (3) vanishes.
5. Numerical Results:
In this section, we present some numerical results to illustrate the influence of varyingserver availability on the performance of low priority traffic. For normalizationpurposes we choose 𝜇𝐿 = 1, and in all cases we take 𝑁 = 17. Further, we choose the extremecases where there is no waiting room for high priority customers (𝐾= 0), and no reservedcapacity for low priority customers 𝑁𝐿 = 0.Before discussing the numerical experiments, we first make some intuitive remarksabout the cases when 𝜆𝐻 and 𝜇𝐻 are very large or very small compared to 𝜆𝐿and𝜇𝐿. These intuitions can be proved formally. First, we fix 𝜆𝐿,𝜇𝐿and 𝜌𝐻 and let𝜇𝐻 (or equivalently 𝜆𝐻) go to infinity. Note that with fixed 𝜌𝐻, the mean numberof servers available to the low priority customers, 𝑁 − 𝐸[𝑋𝐻] is also fixed. As
𝜇𝐻 →∞, low priority customers are in the system so long, that the mean number of available servers during thesojourn time of a low priority customer will be close to the mean number of availableservers in steady state (i.e., close to 𝑁 − 𝐸[𝑋𝐻]). Therefore, it is to be expected thatthe low priority traffic in the limit (as 𝜇 → ∞) experiences the system as if it were an M/M/1 processor sharing queue with server capacity 𝑐 = 𝑁 − 𝐸[𝑋𝐻]. For thequeue length distribution, this model coincides with that of the regular M/M/1 queue with traffic load
𝜌𝐿⁄𝑐.
On the other hand, if we let 𝜇𝐻→0, (again for fixed 𝜆𝐿,𝜇𝐿and 𝜌𝐻), the oppositehappens: the number of servers available to low priority customers changes very slowlycompared to their sojourn times. An arrivinglow priority customer finding noavailable server must wait until one becomesavailable before receiving any service. The mean of this waiting time is 1 𝑁𝜇
𝐻
� and tends to infinity as 𝜇𝐻→0. Since the probability of finding all servers occupiedis positive, the expected sojourn time of the lowpriority customers also goes to infinity, and by Little’s law, so does 𝐸[𝑋𝐿]. In our experiments, we are interested in the behavior of the mean and variance ofthe number of low priority customers in the system, at some fixed system load 𝜌 ≔ 𝜌𝐿+𝐸[𝑋𝐻]. Therefore, for different values of𝜇𝐻 and with
𝜇𝐿normalized to 1, wevary 𝜆𝐿 and 𝜆𝐻, keeping 𝜌constant.
Now we have chosen 𝜌 = 7
10𝑁. We consider three values for 𝜇𝐻: 𝜇𝐻 = 1
5, 1,and 5.
Further, we also plot the results for the M/M/1 queue with server capacity 𝑐 =𝑁 − 𝐸[𝑋𝐻]. We have already argued that this model corresponds to the case 𝜇𝐻= ∞. Therefore, in this case:
𝑃{𝑋𝐿= 𝑗} =�1−𝜌𝐿
𝑐� �
𝜌𝐿
𝑐�
𝑗
,𝑗 = 0,1,2, … (4) Since 𝜇𝐿 = 1, in the experiments we vary 𝜆𝐿 from 0 to 7
10𝑁. At the same time, 𝜆𝐻decreases such that at all times 𝜌= 𝜌𝐿+𝐸[𝑋𝐻] = 7
10𝑁. Themean 𝐸[𝑋𝐿] and variance 𝑣𝑎𝑟[𝑋𝐿] of the number of low priority customers areplotted, respectively. On the horizontal axis 𝜆𝐿 is normalizedto 𝜌𝐿⁄𝜌.We see that 𝐸[𝑋𝐿] and 𝑣𝑎𝑟[𝑋𝐿] are particularly sensitive to 𝜇𝐻 when 𝜌𝐿 and 𝐸[𝑋𝐻]are of the same order.
𝐸[𝑋𝐿] = 𝜌𝐿�𝑐
1−𝜌𝐿�𝑐 =
𝜌𝐿
𝑁−𝐸[𝑋𝐻]−𝜌𝐿 =
𝜌𝐿
𝑁−𝜌
𝑣𝑎𝑟[𝑋𝐿] = 𝜌𝐿�𝑐
1−𝜌𝐿�𝑐�1 +
𝜌𝐿�𝑐
1−𝜌𝐿�𝑐�=
𝜌𝐿
𝑁−𝜌�1 +
𝜌𝐿
𝑁−𝜌� (5)
4. Example:
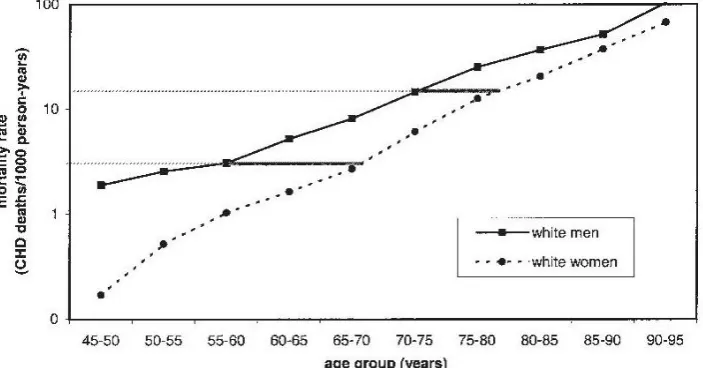
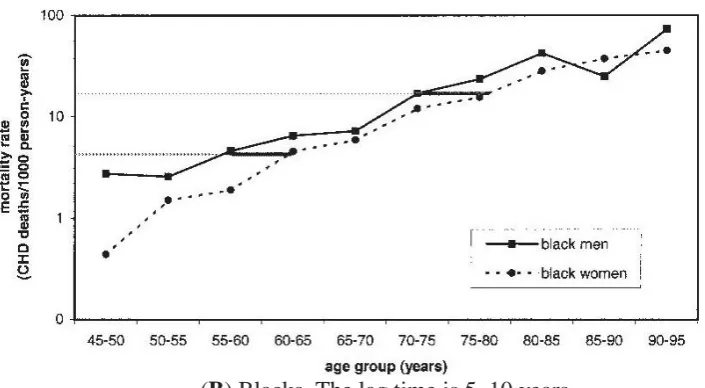
To examine the gender gap in CHD mortality across age groups and to compare the age dependency of the gender gap between blacks and whites, we conducted a prospective cohort study combining data from 9 United States epidemiological studies (Atherosclerosis Risk in Communities Study, Charleston Heart Study, Evans County Study, Framingham Heart Study [original and offspring cohorts], National Health Examination Follow-up Study, Rancho Bernardo Study, San Antonio Heart Study, and Tecumseh Community Health Study). Baseline examinations were performed between 1958 and 1990 (depending on the study), and mean follow up was 13.7 years in general communities in several United States geographic areas. We included 39,614 subjects >30 years and free of cardiovascular disease (CVD) at baseline (18% blacks, 37% men). Completion of follow-up was >97% for all studies. As the main outcome measures, age specific CHD mortality rates and male/female CHD mortality hazard ratios were calculated using Cox hazards regression [13 - 14, 17 & 23 - 24].
Figure (1): Age Specific CHD mortality rates in men compared with women. The horizontal lines illustrate the lag times of CHD mortality rates between men and women.
(A) Whites. The lag time is 10–15 years at younger ages and decreases with age
(B) Blacks. The lag time is 5–10 years
Figure (2): Age Specific CHD mortality rates in men compared with women. The horizontal lines illustrate the lag times of CHD mortality rates between men and women using Normal
Distribution.
(A) Whites. The lag time is 10–15 years at younger ages and decreases with age Red Line: White Men
Blue Line: White Women
(B) Blacks. The lag time is 5–10 years
M
or
ta
lity
R
ate
M
or
ta
lity
R
ate
Red Line: Black Men Blue Line: Black Women
5. Conclusion:
The gender difference in coronary heart disease mortality was more pronounced in whites than in blacks at younger ages. This discrepancy was not explained by adjustment for coronary heart disease risk factors and suggests that other factors may be responsible for the ethnic variation in the gender gap. By using normal distribution the mathematical model gives the result as same as the medical report. The medical reports {Figure (1)} are beautifully fitted with the mathematical model {Figure (2)}; (𝑖.𝑒) the results coincide with the mathematical and medical report.
References:
1. Blaabjerg S, Fodor G, Telek M & Andersen A T, “A partially blocking queueing system with CBR/VBR and ABR/UBR arrival streams”, Information of Telecommunication and Technology, University of Denmark (Internal Report).
2. Cooper R S & Ford E, “Comparability of risk factors for coronary heart disease among blacks and whites in the NHANES I Epidemiologic Follow-up Study”, Annual Epidemiology 1992;2:637.
3. Falin G, Khalil Z & Stanford D A, “Performance analysis of a hybrid switching system where voice messages can be queued”, Queueing Systems, Volume 16, Page Number 51-65, 1994.
4. Gail H R, Hantler S L, Konheim A G & Taylor B A, “An analysis of a class of telecommunications models”, Performance Evaluation, Volume 21, Page Number 151-161, 1994.
5. Gail H R, Hantler S L & Taylor B A, “Analysis of a non preemptive priority multi server queue”, Advances in Applied Probability, Volume 20, Page Number 852-879, 1988.
6. Johnson J L, Heineman E F, Heiss G, Hames C G & Tyroler H A, “Cardiovascular disease risk factors and mortality among black women and white women aged 40–64 years in Evans County, Georgia”, American Journal of Epidemiology, Volume 123, 1986.
7. Kannel W B & Wilson P W. “Risk factors that attenuate the female coronary disease advantage”, Architect International Medicine, Volume 57, Page Number 155-168, 1995.
8. Keil J E, Loadholt C B, Weinrich M C, Sandifer S H & Boyle E Jr, “Incidence of coronary heart disease in blacks in Charleston, South Carolina”, American Heart Journal, Volume 108, 1984.
9. Lerner D J, Kannel W B, “Patterns of coronary heart disease morbidity and mortality in the sexes: A 26-year follow-up of the Framingham population”, American Heart Journal, Page Number 111-113, 1986.
10.Mitrani I & Chakka R, “Spectral expansion solution for a class of Markov models: Application and comparison with the matrix geometric method”, Preference Evolution, Volume 23, Page Number 241-260, 1995.
11.Mitrani I & King P, “Multiprocessor systems with preemptive priorities”, Preference Evolution, Volume 1, Page Number 118-125, 1981.
12.Mitrani I & Mitra D, “A spectral expansion method for random walks on semi infinitestrips”, International Iterative Methods in Linear Algebra (Edited by Beauwens R & P De Groen), Elsevier Science Publishers, Amsterdam, 1991.
13.Muthaiyan A & Ramesh Kumar R J, “Stochastic Model to Find the Testosterone Therapy on Functional Capacity in Congestive Heart Failure Patients Using Uniform
Distribution”, Aryabhatta Journal of Mathematics and Informatics, Volume 6, Number 2, Page Number 343-350, 2014.
14.Muthaiyan A & Ramesh Kumar R J, “Stochastic Model to Find the Prognostic Ability of NT Pro-BNP in Advanced Heart Failure Patients Using Gamma Distribution”, International Journal of Emerging Engineering Research and Technology, Volume 2, Issue 5, August, Page Number 40-50, 2014.
15.Neuts M F, “Matrix Geometric Solutions in Stochastic Models - An Algorithmic Approach”, The Johns Hopkins University Press, Baltimore, 1981.
16.Nfiez Queija R, “A queueing model with varying service rate for ABR”, International Lecture Notes in Computer Science Proceedings of the 10th International Conference on Modeling Technology and Tools for Computer Science, Spain, 1998.
17.Ramesh Kumar R J & Muthaiyan A, “Stochastic Model to Find the Triiodothyronine Repletion in Infants during Cardiopulmonary Bypass for Congenital Heart Disease Using Normal Distribution”, International Journal of Research in Advent Technology, Volume 2, Number 9, September, Page Number 39-43, 2014.
18.Ritter M, “Steady state analysis of the rate based congestion control mechanism for ABR services in ATM networks”, University of Wiirzburg, Institute of Computer Science, Series 114, 1995.
19.Ritter M, “Network buffer requirements of the rate-based control mechanism for ABR services”, Proceedings of IEEE Infocom, San Francisco, Page Number 1090-1097, 1996.
20.Ritter M, “Analysis of a rate based control policy with delayed feedback and variable bandwidth availability”, University of Wiirzburg, Institute of Computer Science, Series 133, 1996.
21.Ritter M, “Analysis of a queueing model with delayed feedback and its application to the ABR flow control”, University of Wiirzburg, Institute of Computer Science, Series 164, 1997.
22.Roger V L, Jacobsen S J, Weston S A, Bailey K R, Kottke T E & Frye R L, “Trends in heart disease deaths in Olmsted County Minnesota, 1979–1994”, Mayo Clinical Proceedings, 1999.
23.Vijayakumar R, Muthaiyan A & Vijayaprabha G, “Find the Long Term Prognostic Significance of 6MWT Distance in CHF Patients Using Mathematical Modelling”, International Journal of Applied Research, Volume 1, Issue 5, Page Number 201-206, 2015.
24.Vijayakumar R, Muthaiyan A & Vijayaprabha G, “Find the Androgen Deprivation Therapy and Congestive Heart Failure Results Using Stochastic Model”, International Journal of Emerging Engineering Research and Technology, Volume 2, Issue 8, Page Number 139-149, 2014.
25.Wingard D L, Suarez L & Barrett Connor E, “The sex differential in mortality from all causes and ischemic heart disease”, American Journal of Epidemiology, Page Number 117-165, 1983.
26.Wild S H, Laws A, Fortmann S P, Varady A N & Byrne C D, “Mortality from coronary heart disease and stroke for six ethnic groups in California, 1985 to 1990”, Annual Epidemiology, Volume 5, 1995.
27.Williams J E, Massing M, Rosamond W D, Sorlie P D & Tyroler H A, “Racial disparities in CHD mortality from 1968 to 1992 in the state economic areas surrounding the ARIC study communities. Atherosclerosis Risk in Communities”, Annual Epidemiology, Volume 9, 1999.