Article
1
Substrate-induced response in biogas process
2
performance and microbial community relates back
3
to inoculum source
4
Tong Liu1, Li Sun1 Åke Nordberg2, and Anna Schnürer1,*
5
1Department of Molecular Science, Swedish University of Agricultural Sciences, Uppsala, Sweden;
6
E-mail: [email protected], [email protected]
7
2Department of Energy and Technology, Swedish University of Agricultural Sciences, Uppsala, Sweden;
8
E-mail: [email protected]
9
*Correspondence: [email protected]; Tel.: +018-67 32 88
10
11
Abstract: This study investigated whether biogas reactor performance, including microbial
12
community development, in response to a change in substrate composition is influenced by initial
13
inoculum source. Test reactors were first started with two different inocula and operated with the
14
same grass-manure mixture for more than 120 days. These reactors initially showed great
15
differences depending on inoculum source, but eventually showed similar performance and overall
16
microbial community structure. At the start of the present experiment, the substrate was
17
complemented with milled feed wheat, added all at once or divided into two portions. The starting
18
hypothesis was that process performance depends on initial inoculum source and microbial
19
diversity, and thus that reactor performance is influenced by the feeding regime. In response to the
20
substrate change, all reactors showed increases and decreases in volumetric and specific methane
21
production, respectively. However, specific methane yield and development of the microbial
22
community showed differences related to initial inoculum source, confirming the hypothesis. The
23
different feeding strategies had however only minor effects on process performance and overall
24
community structure, but still induced differences in the cellulose-degrading community and in
25
cellulose degradation.
26
Keywords: Anaerobic digestion; Co-digestion; CSTR; BMP-test; Illumina sequencing; T-RFLP;
27
Glycoside hydrolase families 5 and 48.
28
29
30
1. Introduction
31
Biogas, produced via anaerobic digestion, represents a valuable renewable energy resource that
32
can replace part of the fossil fuel-based energy used today, resulting in climate and economic benefits
33
[1]. Many types of organic materials can be used for biogas production, but agricultural residues
34
(manure and crop residues, such as stalks, straw, husks, cobs, grass, etc.) are of particular interest
35
due to high abundance and thus high gas potential [2]. However, the high content of lignocellulose
36
and nutrient imbalances often limit the degradation efficiency of agricultural residues [3]. An
37
additional limitation with manure is high water content, making it difficult to achieve high organic
38
loads and volumetric gas production [4]. Some of the obstacles with these types of materials can be
39
overcome by various pre-treatment methods, making the material more accessible to microbial and
40
enzymatic attack [5], or by co-digestion with materials that provide complementary nutrients [6]. For
41
manure-based biogas plants, co-digestion also offers possibilities to increase the organic load. By
42
combining manure with a high water content with more energy-dense material, such as crop/crop
43
residues, the organic load can be increased without significantly decreasing the hydraulic retention
44
time (HRT) [4,6,7].
45
A prerequisite to achieving efficient biogas production is an active microbial community in
46
balance [8]. Parameters shown to impact the community include operating parameters, such as
47
temperature, organic loading rate (OLR), substrate composition, and feeding regime [9-11]. Many
48
studies have looked for correlations between microbial composition and reactor function, but most
49
have not found consistent relationships [12,13]. Some studies suggest positive correlations between
50
diversity and function [14,15], but a correlation between low diversity and high function has also
51
been reported [16]. Still, positive correlations are often seen in connection with a specific type of
52
substrate/environment. For example, for the function of processes operating with protein-rich
53
materials and consequently high ammonia concentrations, the importance of syntrophic
acetate-54
oxidizing bacteria has been highlighted [17]. For degradation of lipids, positive correlations with the
55
level of Syntrophomonas have been shown [18]. For cellulose degradation, positive correlations with
56
the level of Clostridium cellulolyticum have been observed [12]. Feeding regime has also been shown
57
to influence function, diversity, and community structure [9,19-23], but again with some
58
inconsistencies in the results.
59
The aim of the present study was to determine the relationships between function and
60
community structure and specifically to increase understanding of the relationship between
61
community structure and performance and the efficiency of a biogas process operating with
62
lignocellulose-rich substrates. Reactors operated in a previous study were used in the experimental
63
work [15]. These reactors were initially started with different inocula characterized by differences in
64
community structure and diversity, and fed a mixture of cow manure and silage grass. The reactors
65
initially showed significant differences in degradation efficiency and methane yield, with a positive
66
correlation between low diversity, on one hand, and low methane yield and degradation efficiency
67
of cellulose on the other [15]. Over time, after operation for more than 3 HRT, the processes became
68
similar regarding both performance and overall community structure and diversity, as analyzed by
69
targeting 16S rRNA gene [15]. However, specific analysis of the potential cellulose-degrading
70
community, targeting the genes encoding cel 5 and 48 glycosidases, revealed that the reactors still
71
differed in this regard at the end of the experiment. The present study was started at this time point
72
and sought to determine whether a change in substrate composition resulted in different performance
73
and development of community structure in the different processes, i.e., whether the
substrate-74
induced response was influenced by the initial inoculum source. The hypothesis was that, despite
75
their similarity in performance and overall microbial composition, the reactors would respond
76
differently to the change in substrate composition because of the difference in their potential
77
cellulose-degrading community.
78
To test this hypothesis, milled feed wheat (MFW) was added as an additional co-substrate to the
79
processes mentioned above. It was selected as a co-substrate because its high total solids (TS)
80
concentration allowed the organic load to be increased without significantly altering the HRT.
81
Moreover, MFW is used to boost biogas production in a large biogas plant at Lövsta (Sweden), which
82
was the source of the inoculum for one of laboratory-scale reactors used in the present experiment.
83
The MFW was either added all at once, together with the grass-manure mixture, or divided into two
84
portions, in order to evaluate the effect of feeding regime. The reactors were operated for more than
85
3 HRT and their overall performance regarding methane yield stability and changes in microbial
86
community structure were investigated. Degradation of the substrates and of pure cellulose was also
87
investigated in batch cultures started with inoculum from the reactors at the beginning and end of
88
the experimental period.
2. Materials and Methods
96
2.1. Laboratory-scale semi-continuous anaerobic reactors
97
Two laboratory-scale continuous stirred-tank reactor (CSTR) processes in duplicate reactors were
98
initially started with inoculum from two different full-scale biogas processes (codes GB, GC) in
99
Sweden [15]. Operating information on the full-scale plants can be found in our previous publications
100
[12,15]. Based on the inoculum origin, the reactors were named GB1 and GB2, and GC1 and GC2. In
101
the 120 days before the start of the present experiment (day 0), the reactors were fed with the same
102
substrate, a grass-manure mixture (Table 1) [15], for six days a week (once a day), with an average
103
daily load of 2.6 g volatile solids (VS)/L and 40-day HRT. After 42 days of operation in the present
104
study, MFW (Table 1) was added to all four reactors with average daily load gradually increasing
105
from 0.6 to 1.7 g VS/L (6 days a week, from day 42 to 77) (Figure 1), resulting in a total average daily
106
load of 4.3 g VS/L and a HRT of 37 days. From day 77, the reactors were fed with the full load of
107
MFW (1.7 g VS/L day) in different feeding regimes: reactors GB1 and GC1 were fed all MFW at the
108
same time as the grass-manure mixture, while GB2 and GC2 were fed the MFW in two portions, with
109
half the amount fed 2 hours after adding the grass-manure mixture and the remaining half after
110
another 2 hours. In total, the reactors were operated for 231 days, corresponding to 4.5 HRT at a full
111
load of MFW. All reactors were operated at mesophilic (37°C) temperature, a stirring speed of 90
112
rpm, and a HRT of 37 days. Samples of liquid (15 mL) were taken at day 0, 77, 106, 147, and 231 and
113
frozen at -20°C for later analysis of the microbial community structure.
114
Table 1. Composition of the grass-manure mix and milled feed wheat (MFW) substrates. Values (%)
115
based on wet weight.
116
VS Crude protein Starch Crude fat Crude Fiber Ash
Manure-grass mixture 10.2 2.1 0.4 4.9 26.2 9.0
MFW 84.0 16.0 28.0 5.0 6.5 3.5
117
118
2.2. Anaerobic batch test
119
The methane potential of the substrate was analyzed by a bio-methane potential (BMP) test [15],
120
performed on two occasions. On the first occasion (test I), digestate samples from the duplicate
121
reactors, before MFW addition, were pooled and used as inoculum (GB0_0 and GC0_0). On the
122
second occasion (test II), inocula were taken from all the laboratory-scale reactors after 231 days of
123
operation, corresponding to an operating period of 4.5 HRT at full MFW load, and used in separate
124
tests (GB1_231, GB2_231, GC1_231, and GC2_231). The grass-manure mixture, MFW, and cellulose
125
(control group) were evaluated on both occasions, i.e., with all inocula. Before starting the tests, all
126
inocula were kept at 37°C for seven days to decrease biogas prodution from endogenous material. At
127
the start of the BMP test, inoculum and substrate were mixed in a serum bottle (309 mL) under
128
flushing with nitrogen gas (N2). The amount of inoculum and substrate was 12 g and 3 g VS/L,
129
respectively, i.e., the inoculum to substrate ratio was 4:1 [24,25]. Tap water was added to the bottles
130
to reach a final liquid volume of 193 mL. Each substrate was evaluated in triplicate bottles.
131
Additionally, to monitor background gas production from inoculum alone, three bottles were
132
initiated by adding the same amount of inoculum and water to reach the same final liquid volume,
133
but with no substrate. All bottles were incubated on a rotary shaker at 37°C and 130 rpm. Gas
134
production was quantified by pressure measurements, and the methane content was analyzed by
135
sampling (2 mL) followed by analysis by gas chromatography (GC) [26]. After each sampling, the
136
pressure in the bottles was released. The biogas and methane values were standardized to normal
137
atmospheric pressure (atm) at 0°C (273.15 K, 1 bar). The accumulated amount of methane was plotted
138
over time, and the value obtained after leveling off was considered the specific methane production
139
(Nml CH4/g VS).
2.3 Residual methane emissions measurement
141
The residual methane potential of the digestate was measured twice, on the same occasions as
142
the BMP tests, by incubating 50 mL digestate from the four laboratory-scale reactors, i.e., digestate
143
from day 0 and day 231, at 37°C for around 180 days. Sampling and analysis of methane production
144
during the incubation were performed according to the method described above.
145
146
2.4 Analytical methods
147
Gas and liquid samples were taken weekly from the reactors to determine pH [27], methane (by
148
GC; [26]), and volatile fatty acid (VFA) content (by high-performance liquid chromatography
149
(HPLC), [26]). The pH was determined directly after sampling. Liquid samples (400 mL) were also
150
taken on two occasions and sent to a commercial analytical laboratory (Agrilab, Sweden) for
151
determination of the concentration of total nitrogen and ammonium-nitrogen according to standard
152
ISO methods 13878:1998 and 11732:2005, respectively. Total carbon was measured according to
153
standard ISO 10694 and total phosphorus, total sulfur, and total potassium according to Swedish
154
standard SS 28311. Composition of the MFW was determined by Nord Mills Co. and that of the
grass-155
manure mixture by the laboratory at the Department of Animal Nutrition and Management (Swedish
156
University of Agricultural Sciences, Uppsala, Sweden). Starch content was determined by an
157
enzymatic method according to Åman and Hesselman (1984). Crude protein content was analyzed
158
according to the Nordic Committee on Food Analysis (1976) method for nitrogen determination in
159
food and feed (Kjeldahl, No 6, 3th Edn), using a 2520 Digestor, Kjeltec 8400 Analyzer unit, and 8460
160
sample unit (FOSS Analytical A/S Hilleröd, Denmark). Crude fat was determined according to the
161
Official Journal of the European Communities method for determination of crude oils and fat
162
(Commission Directive 98/64/EC, 1998), using a Hydrotec 8000 and Soxtec 8000 extraction unit (FOSS
163
Analytical A/S Hilleröd, Denmark). Weight of total solids and volatile solids in the inocula and
164
substrate samples was measured according to international standard methods published by
165
American Public Health Association (1998).
166
167
2.5 DNA extraction and microbial community analysis
168
Samples from the starting time of the semi-continuous processes (inocula, 0 day) and after 77,
169
119, and 154 days (1, 2, and 3 HRT, respectively) of operation with the MFW and the grass-manure
170
mixture were used to extract total genomic DNA as described previously [15]. The degenerate primer
171
sets 515`F and 805R were used to amplify the 16S rRNA genes of both archaea and bacteria to build
172
amplicon libraries for Illumina sequencing [28]. The raw DNA sequencing data obtained were
173
submitted to National Center for Biotechnology Information database (NCBI) under accession
174
number: from SRR5808389 to SRR5808384, and analyzed through the open-source bioinformatics
175
pipeline Qiime [15]. The potential cellulose-degrading bacterial community in the substrate and in
176
the digestate after 154 days of operation was analyzed by terminal restriction fragment length
177
polymorphism (T-RFLP) targeting the genes of glycoside hydrolase families 5 and 48, according to
178
the procedure described previously [12]. The length patterns of the fragments obtained were
179
compared with the sequences of clone libraries established in our earlier publications [12] [29].
3. Results and Discussion
190
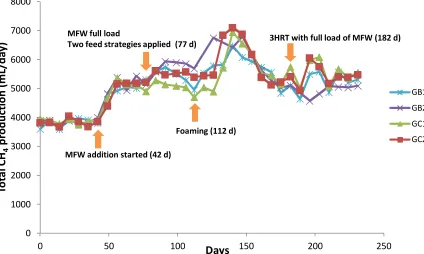
3.1. Biogas production and BMP test
191
The experiment was started with four reactors previously operated in another study [15], where
192
they were initially started with two different inocula and were shown to have very different
193
performance in the initial phase of operation, but similar performance by the end. In the present
194
study, the reactors showed similar initial performance after complementing the grass-manure
195
mixture with MFW. Irrespective of feeding strategy, co-digestion with MFW increased the total
196
methane production compared with the grass-manure mixture alone in all four semi-continuous
197
processes. In the initial phase the level increased gradually from 3818 ± 158 to 5317 ± 304 mL CH4/day
198
(average value for day 0-42 and day 56-112, respectively) and then increased rapidly and reached a
199
peak of 6669 ± 439 mL CH4/day on day 140. Thereafter, total methane production decreased gradually
200
and stabilized at 5362 ± 205 mL CH4/day (day 182-231), i.e., after 3 HRT of operation with a full load
201
of MFW (Figure 1). This final value represented an increase of around 29% over the initial level before
202
addition of the MFW, as also observed in our previous study [15].
203
204
Figure 1. Total average methane (CH4) production (mL/day) in four continuous laboratory-scale
205
biogas reactors originally started with two different types of inoculum (GB, GC) and co-digested with
206
substrates of grass-manure and milled feed wheat (MFW) in two feeding approach (full load, split
207
load) at 37 °C. The methane values were standardized to normal atmospheric pressure (atm) at 0°C
208
(273.15 K, 1 bar).
209
210
As expected, increasing the load by addition of MFW resulted in a significant increase in
211
volumetric gas production, thus giving more efficient use of available digester volume. Several
212
previous studies have shown a similar positive effect of co-digesting energy-dense materials with
213
manure [4,6,7,30]. The increase in OLR also resulted in foaming (day 112) and increased VFA levels,
214
suggesting some instability in the processes (Table S1). Moreover, both specific methane production
215
(SMP) and degree of degradation (VS reduction) decreased in response to MFW addition (Figure S1).
216
The SMP level in all digesters was on average 296 ± 16 mL CH4/g VS before addition of MFW (day
0-217
0 1000 2000 3000 4000 5000 6000 7000 8000
0 50 100 150 200 250
To
ta
l C
H
4p
ro
d
u
ct
io
n
(
m
L/
d
ay
)
Days
GB1 GB2
GC1 GC2
MFW addition started (42 d) MFW full load
Two feed strategies applied (77 d)
Foaming (112 d)
42) and 249 ± 18 mL CH4/g VS after addition (day 182-231). The corresponding VS reduction was 74.1
218
± 3.4 and 63.7 ± 3.5 %, respectively. In line with the total CH4 production (Figure 1), a peak (312 ± 16
219
mL CH4/g VS) was seen on day 140 (Figure S1). This peak might be explained by nutrients
220
accumulating in the foam and being converted to CH4 by microorganisms when the foam
221
disappeared around day 126.
222
The BMP values for the grass-manure mixture and the MFW were similar, i.e., on average 311 ±
223
62 and 310 ± 37 mL CH4/g VS (day 231, student t-test p>0.5), respectively (test II; Table 2). Thus, the
224
observed decrease in SMP for the reactors, combined with the decrease in VS reduction, suggest that
225
the increase in load by addition of MFW resulted in less efficient degradation than when the
grass-226
manure mixture was used as the sole substrate. This decrease in degradation efficiency was also
227
observed in the BMP tests, where significantly longer times were needed to reach 50, 80, and 100 %
228
of the final potential of the substrates in the second (II) compared with the first (I) test (student t-test,
229
p <0.01) (Table 2). For a production plant mainly focusing on volumetric yield, this decrease in
230
degradation efficiency would be somewhat hidden. Unfortunately, decreased degradation efficiency
231
might also increase the risk of methane emissions during storage of the digestate, as shown in several
232
other studies [4,30,31].
233
The risk of residual methane production (RMP) was evaluated by incubation of digestate taken
234
from all reactors before and after MFW addition (day 0 and day 231, respectively). The evaluation
235
showed similar values for all reactors before MFW addition, i.e., 71 ± 5 mL CH4/g VS, on average for
236
reactors GB0_0 and GC0_0 on day 53 (pairwise t-test, p>0.5) (Figure S2). However, after operation
237
with MFW for 189 days the RMP was significantly higher on day 51 (134 ± 12 mL CH4/g VS; pairwise
238
t-test, p<0.01) (Figure S2). Thus, MFW addition clearly increased the risk of methane emissions during
239
storage, which was consistent with the decrease in degree of degradation seen in the reactors.
240
241
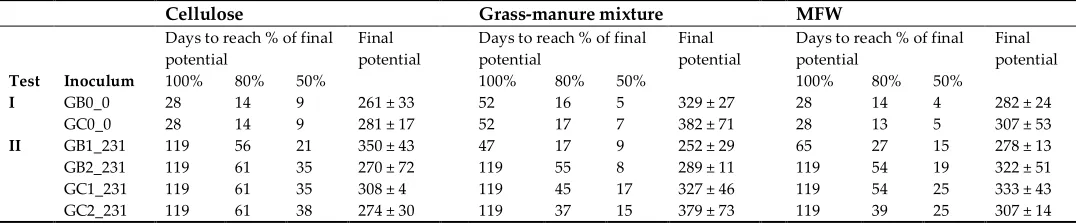
Table 2. Final methane potential (mL CH4/g VS) and time taken to reach 100, 80, and 50% of this
242
potential with cellulose, grass-manure mixture, and milled feed wheat (MFW) substrates for the two
243
different inocula (GB, GC) in the biomethane potential (BMP) test. The methane values were
244
standardized to normal atmospheric pressure (atm) at 0°C (273.15 K, 1 bar).
245
Cellulose Grass-manure mixture MFW
Days to reach % of final potential
Final potential
Days to reach % of final potential
Final potential
Days to reach % of final potential
Final potential
Test Inoculum 100% 80% 50% 100% 80% 50% 100% 80% 50%
I GB0_0 28 14 9 261 ± 33 52 16 5 329 ± 27 28 14 4 282 ± 24 GC0_0 28 14 9 281 ± 17 52 17 7 382 ± 71 28 13 5 307 ± 53
II GB1_231 119 56 21 350 ± 43 47 17 9 252 ± 29 65 27 15 278 ± 13 GB2_231 119 61 35 270 ± 72 119 55 8 289 ± 11 119 54 19 322 ± 51 GC1_231 119 61 35 308 ± 4 119 45 17 327 ± 46 119 54 25 333 ± 43 GC2_231 119 61 38 274 ± 30 119 37 15 379 ± 73 119 39 25 307 ± 14
246
247
Differences in feeding regime did not result in any statistically significant differences in
248
volumetric or specific methane yield. However, there were some minor differences related to process
249
performance, e.g., VFA accumulation. Accumulation of VFA started around day 112 in all reactors,
250
when the OLR reached 4.3 g VS/L day (Table S1). Total level fluctuated somewhat, but was highest
251
at day 224 (1.6-4.6 g/L). Accumulation of VFA is linked to less efficient biogas production and
252
typically occurs when there is an imbalance between different microbial degradation steps. A high
253
propionate to acetate ratio can be taken as an early indicator of a risk of process failure [32]. In this
254
study the propionate to acetate ratio showed some differences depending on the feeding regime, with
255
GB1 and GC1 showing slightly higher values than GB2 and GC2 after day 203 (Table S1). The VFA
256
accumulation was also associated with a foaming event (day 112-113), but in that case no differences
257
related to the feeding regime were observed. Foaming can be triggered by many parameters such as
258
production of surface-active substances, abrupt degassing, viscosity, alkalinity, insufficient mixing,
259
and accumulation of VFAs [33]. In our previous study the reactors had been operated with the
manure mixture for a long time without any VFA accumulation or foaming [15]. Thus, the instability
261
in the present study was clearly caused by the introduction of MFW as a substrate. In comparison
262
with manure, the MFW had higher levels of protein and starch (Table 1). When protein is degraded,
263
ammonium-nitrogen is released. In this study, the ammonium-nitrogen concentration increased from
264
1.05 ± 0.5 to 2.6 ± 0.12 g/L as a result of MFW addition (average of all reactors, from day 0 to 224).
265
Ammonium is in equilibrium with ammonia, a well-known inhibitor of biogas processes (specifically
266
by inhibiting methanogens) [34], and this could have caused the VFA accumulation followed by
267
foaming. However, the levels were still low and below levels previously shown to cause inhibition
268
[35]. Taking into account the pH (7.6-7.7) and temperature (37oC), the level of free ammonia was
269
calculated and found to be at most only around 0.16 g/L. A more likely explanation for the foaming
270
might thus be the introduction of starch, which is typically converted rapidly to VFAs [33].
271
Previous studies investigating the effect of feeding regime on reactor performance have reported
272
somewhat contradictory results and no consistent influence on key process parameters such as gas
273
yield, degree of degradation, and VFA levels [9,19,21-23,36]. For example, lower levels of VFA have
274
been reported when using distiller’s dried grains as a substrate and feeding every 2 days compared
275
with every 2 hours [9] while the opposite has been reported when feeding oleate every 2 days
276
compared with every 6 hours [21]. These inconsistency in results regarding the effect of feeding
277
approaches can be explained by differences in type of substrate, OLR, and feeding frequencies, with
278
2-48 hours between feedings. Still, Mulat et al. (2016) obtained slightly higher (14%) methane yield
279
with a less frequent feeding regime [9]. Similarly, feeding oleate every 2 days compared with every
280
6 hours gave 20% higher methane yield [22].
281
There were only small differences between reactors with differences in feeding regimes in the
282
present study. However, there were differences between the GB and GC reactors, with significantly
283
higher specific methane production for GC reactors in the period after day 182 (student t-test p<0.01)
284
(Figure S1). This suggests that reactor performance was influenced by the original inoculum used for
285
start-up of the reactors in our previous study, where GB reactors produced significantly less methane
286
than GC reactors in the start-up phase (within 1 HRT) [15]. The poor performance of GB reactors in
287
our previous study was attributed to higher ammonium-nitrogen level in the inoculum used for
start-288
up of these reactors [15]. In the present study the ammonium nitrogen increased, but to the same
289
level in all reactors (GB: from 1.1 to 2.5 g/L, GC: from 1.0 to 2.5 g/L). Thus, a more likely explanation
290
for the differing results obtained for GB and GC reactors is differences in the microbial community
291
rather than the ammonia level per se, as discussed below.
292
A difference between the GB and GC reactors was also observed in the BMP tests. In the first
293
BMP test (test I), the final methane potential of all substrates tested reached a mean value of 357 ± 45
294
mL CH4/g VS and showed no significant difference between the different substrates or the different
295
inocula (pairwise t-test, p>0.05) (Table 2). However, in the second BMP test (test II) the final methane
296
potential of the grass-manure mixture using inoculum from the GB reactors decreased slightly
297
compared with test I, from 329 ± 27 (GB0_0) to 252 ± 29 (GB1_231) and 289 ± 11 (GB2 _231) mL CH4/g
298
VS (pairwise t-test<0.01). For GC, however, the values remained more similar to those in test I,
299
decreasing from 382 ± 71 (GC0_0) to 327 ± 46 (GC1_231) and 375 ± 73 mL (GC2 _231) mL CH4/g VS
300
(pairwise t-test, p>0.5) (Table 2). Moreover, the average BMP value obtained for the grass-manure
301
mixture in GC1_231 and GC2_231 (353 ± 62 mL CH4/g VS) was higher than in GB1_231 and GB2_231
302
(270 ± 28 mL CH4/g VS) (student t-test, p<0.02). However, for cellulose and MFW, similar final
303
methane potential values were obtained in tests I and II (student t-test, p>0.05). The average BMP
304
value for both GB and GC reached 291 ± 46 (cellulose) and 300 ± 38 (MFW) mL CH4/g VS (Table 2).
305
However, higher degradation efficiency for cellulose was seen in GB1_231 compared with GB2_231,
306
which might suggest a small effect of the different feeding approaches (Table 2 and Figure S3).
3.3 Microbial communities
312
3.3.1 Diversity indices
313
After quality trim and chimera check, 3 311 869 sequences (from 15 874 to 116 439 per sample)
314
were retained. The triplicate samples were merged in silico and then subsampled based on the
315
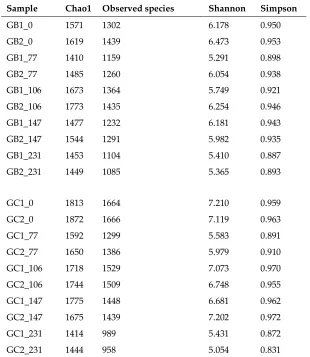
detected lowest sequences of the sample (41 100 sequences per sample). The number of observed
316
species across samples obtained from the rarefaction curve varied from 958 to 1666, with the lowest
317
values for the GC reactors at the end of the experiment. At the start of the experiment, there was no
318
significant difference in Chao1, Shannon and Simpson indices of the observed species between all
319
four reactors (Table 3). However, the indices varied over time (Table 3) and the values appeared to
320
fluctuate consistently with methane production and VFA levels in all four semi-continuous reactors
321
(Table 3). Addition of MFW appeared to cause an overall decrease in diversity compared with
322
operation with only the grass-manure mixture and this decrease was independent of the feeding
323
regime.
324
325
Table 3. Summary of observed OTUs, Chao1, Shannon, and Simpson index values.
326
Sample Chao1 Observed species Shannon Simpson
GB1_0 1571 1302 6.178 0.950
GB2_0 1619 1439 6.473 0.953
GB1_77 1410 1159 5.291 0.898
GB2_77 1485 1260 6.054 0.938
GB1_106 1673 1364 5.749 0.921
GB2_106 1773 1435 6.254 0.946
GB1_147 1477 1232 6.181 0.943
GB2_147 1544 1291 5.982 0.935
GB1_231 1453 1104 5.410 0.887
GB2_231 1449 1085 5.365 0.893
GC1_0 1813 1664 7.210 0.959
GC2_0 1872 1666 7.119 0.963
GC1_77 1592 1299 5.583 0.891
GC2_77 1650 1386 5.979 0.910
GC1_106 1718 1529 7.073 0.970
GC2_106 1744 1509 6.748 0.955
GC1_147 1775 1448 6.681 0.962
GC2_147 1675 1439 7.202 0.972
GC1_231 1414 989 5.431 0.872
GC2_231 1444 958 5.054 0.831
327
Several previous studies have shown a correlation between high methane production and high
328
diversity of microbial community, suggesting that a more diverse microbial community allows
329
activation of multiple metabolic pathways and consequently high methane production [14,15,37
330
7504]. However, no such effect was seen in this study. On the contrary, the GC reactors, which
331
showed significantly higher methane production than GB reactors at the end of the experiment,
332
displayed the greatest decrease in species richness and in the Simpson and Shannon indices.
Previous studies have also shown that microbial community diversity can be affected by
334
different feeding regimes. Digesters fed with lower frequency (every 2 days compared with daily or
335
every 2 hours) have been shown to form a more diverse microbial community [9,19]. In line with this,
336
GB1 and GC1, receiving the MFW all at once, showed slightly higher average number of observed
337
species and Shannon index, respectively, than GB2 and GC2, but this difference was not statistically
338
significant (Table 3).
339
340
3.3.2 Phylogenetic analysis
341
The microbial community composition, analyzed by an unweighted UniFrac principal
342
coordinate analysis (PCoA), was similar at the beginning of the experiment but changed over time in
343
the different processes, resulting in complete separation of the GB and GC reactors by day 231 (Figure
344
2). This community change appeared to relate back to the original inoculum, which was different for
345
the GC and GB processes. For the different feeding regimes, however, no clear seperation between
346
GB1, GB2 and GC1, GC2 was observed.
347
Figure 2. Phylogenetic distance between samples as determined by unweighted UniFrac principal
348
coordinate analysis (PCoA). Sample legend arranged by time (day 0, 77, 106, 147, and 231).
349
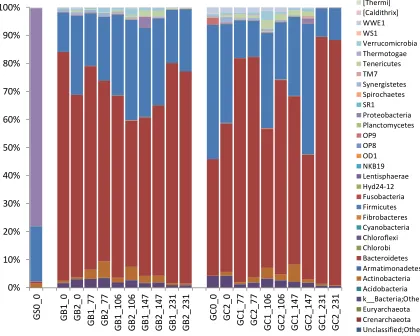
Irrespective of MFW addition, the phyla Bacteroidetes (67.4 ± 12.7 %) and Firmicutes (24.4 ± 9.7
351
%) dominated in all processes and at all-time points, followed by the phylum Actinobacteria (2.2 ±
352
1.8 %) and an unclassified phylum (2.0 ± 1.0 %). The phyla Tenericutes, Verrucomicrobia,
353
Synergistetes, WWE1, and Proteobacteria were also detected in all reactors, but at relatively low
354
abundance (<1%) (Figure 3). This dominance of the phyla Bacteroidetes and Firmicutes has been seen
355
in various anaerobic digesters in many previous studies [15,38,39]. Members of these two phyla can
356
utilize a broad range of organic compounds, and are involved in the hydrolysis, fermentation, and
357
acetogenesis steps of anaerobic digestion [2,40].
358
Figure 3. Relative abundance of bacterial 16S rRNA gene at phylum level in the reactor samples (GB1,
359
GB2, GC1, and GC2), arranged by time (day 0, 77, 106, 147, and 231), and the substrate sample (GS0_0).
360
361
While no significant differences were seen on phylum level, MFW addition, independent of
362
feeding strategy, resulted in a similar shift in the overall microbial community pattern in all reactors
363
at lower taxonomic level. The most pronounced change was an increase in the relative abundance of
364
the genus Paludibacter (family Paludibacteraceae, order Bacteroidales, phylum Bacteroidetes) from
365
<0.1% (day 0) to an average of 49.9 ± 7.5 % (day 231). This increase was seen in all reactors, but was
366
more pronounced in GC1 and GC2 (on average 12.7% higher than in GB1 and GB2). This difference
367
was most likely the cause of the separation in the PCoA analysis at the last time point (i.e., day 231)
368
(Figure 2). The genus Paludibacter was also found in the grass-manure mixture and in the original
369
inocula for GB and GC, as described in our previous study [15], but here only at very low relative
370
abundance (<0.1%). The genus Paludibacter is strictly anaerobic and can utilize various sugars such as
371
arabinose, xylose, cellobiose, fructose, galactose, glucose, mannose, maltose, melibiose, glycogen, and
372
soluble starch while producing acetate and propionate as major fermentation end-products [41].
373
Members of this genus have been found at various relative abundances in other anaerobic digesters
374
and also in other anaerobic environments, such as cow manure, wetlands, sludge from
hydrolyzed rice straw, and plant residues in irrigated rice-field soil [41-43,44 ,45,46]. The genus
376
Paludibacter was initially considered unable to utilize cellulose [41]. However, a recent study found it
377
has cellulose-degrading potential and a novel endoglucanase, cel5Rα (belonging to glycosyl
378
hydrolase family 5), has been discovered in several members of this genus [47]. This
cellulose-379
degrading potential was also indicated in a recent study where Paludibacter was enriched by cellulose
380
addition [45]. In this study, the high level of starch in MFW probably enhanced the growth of this
381
genus.
382
With the increase in Paludibacter, the average relative abundance of an uncultured rumen
383
bacterium clone BF311 (belonging to unclassfied order Bacteroidales) gradually decreased in all
384
reactors after the addition of MFW, from 20.0 ± 10.4 % (day 77) to 0.9 ± 0.2 % (day 231), but with no
385
significant difference between reactors. This uncultured rumen bacterium clone BF311 (GenBank:
386
EU850525.1) is one partial sequence of 16S ribosomal RNA genes from a series of clones made by
387
Satitmanwiwat et al. (2008, article unpublished). However, it was mistakenly assigned as genus
388
BF311 in the Greengene database and thus wrongly cited by other studies [48-50]. Still, BF311 has
389
been reported in cattle rumen and horse feces samples [48,49]. However, to our knowledge no
390
previous publication other than ours has found BF311 in biogas digesters. In our previous study, the
391
relative abundance increased differently in GB and GC reactors, from 0.5% to 15.1% and from 2.5%
392
to 5.2, respectively, when operated with the same grass-manure mixture as used in the present study
393
for over 3 HRT (i.e., 154 day) [15]. BF311 has been suggested to play an important role in
394
lignocellulose degradation in rumen environments [49,50]. In this study, BF311 was possibly
395
outcompeted by representatives from the genus Paludibacter.
396
Class Clostridia (phylum Firmicutes) also slightly decreased in response to MFW addition in all
397
reactors, from average levels of 17.2 ± 4.2 % to 10.6 ± 1.9 %. However, the levels increased again
398
around day 146 (to on average 26.0 ± 8.0 %), i.e., in the period of VFA accumulation and slight reactor
399
instability. During reactor recovery, the levels again decreased, but to different levels in the different
400
reactors, ranging from 18.5% in GB reactors to 9.6% in GC. These changes in the class Clostridia were
401
mainly caused by two unclassified families and the genus Caldicoprobacter (family
402
Caldicoprobacteraceae). Members of this genus can utilize various sugars, but also xylan and
403
pyruvate, and produce acetate, lactate, and hydrogen as end-products [51,52]. The genus
404
Caldicoprobacter has also been found to be enriched in anaerobic digesters fed lignocellulosic biomass
405
under both mesophilic and thermophilic conditions [53,54]. Moreover, it has been shown to dominate
406
in an anaerobic digester with high total ammonium-nitrogen (5 to 25 g/L) and, as in this study, high
407
VFA levels (>4 g/L) [55].
408
Moreover, a slight increase in the genus Clostridium (family Clostridiaceae, phylum Firmicutes)
409
from 1.6 ± 0.2 % (day 0) to 6.9 ± 2.6 % (day 231), irrespective of the total changes in the level of Class
410
Clostridia, was observed after MFW addition in all reactors. This genus contains organisms active
411
both during fermentation and anaerobic oxidation that can utilize proteins and carbohydrates, and
412
their corresponding monomers, while producing different fatty acids as end-products of their
413
metabolism [56-58]. This increase probably related directly to MFW addition and the observed
414
increased in VFA level at the same time point [59]. A slight increase in relative abundance of the
415
phylum Actinobacteria (mostly contributed by the family Coriobacteriaceae), from 1.2 ± 0.6 % to 3.1
416
± 2.1 %, was also seen at the time of VFA accumulation and foaming (day 146). This phylum contains
417
many acid-producing bacteria and has previously been found to increase in the deteriorative phase
418
of an anaerobic process [38]. The family Coriobacteriaceae has been shown to dominate in an
419
anaerobic digester operating with wastewater sludge and is suggested to convert lignocellulose
420
hydrolysates into lactic acid and acetic acid [60,61].
421
Among the Archaea, the phyla Euryarchaeota and Crenarchaeota dominated, with
422
Crenarchaeota only detected in GC samples (Figure 3). However, as seen in several other studies of
423
biogas digesters [15,62,63], the total relative abundance of Archaea was very low, in this study less
424
than 0.3% across all samples (Figure 3). Thus, it is difficult to draw any conclusions regarding effects
425
on this community of the change in operating conditions in this study.
The different feeding regime showed no clear effect on the overall microbial community in this
427
study. Similar results were obtained in a previous study during operation of CSTRs fed with glucose
428
(once and twice a day and every 2 days) [23]. In contrast, a slight increase in microbial community
429
richness was observed in a study using a starch-rich synthetic substrate fed every two days compared
430
with daily [19]. This is consistent with findings in the present study of higher richness in GB1 and
431
GC1 compared with GB2 and GB2. Similarly, previous studies evaluating different feeding regimes
432
have found effects of certain microbial groups. For example, during co-digestion of manure and
433
oleate, the community fraction of the genus Syntrophomonas was higher when the oleate was fed every
434
2 days compared with every 6 hours [22]. However, the interactions between feeding regime, digester
435
performance (including methane production and process parameters), and microbial community still
436
remain somewhat unclear, as various feeding regimes have been shown to cause changes in microbial
437
dynamics without affecting digester performance and vice versa [9,19,21,64].
438
439
440
441
442
443
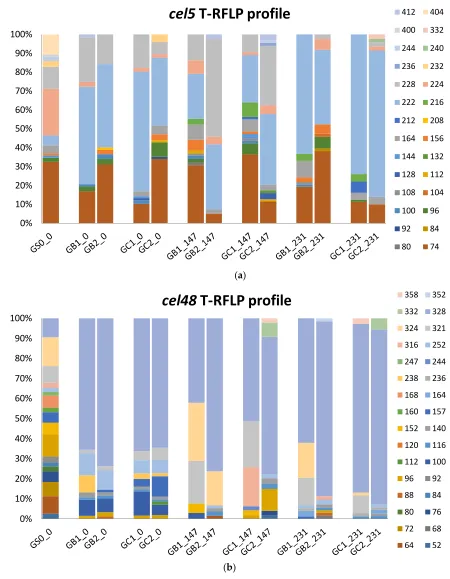
3.3.3 T-RFLP
444
In our previous study, the T-RFLP profiles for glycoside hydrolase families 5 (cel5) and 48 (cel48)
445
genes differed between the original inocula used to start the GB and GC reactors [15]. After 3 HRT of
446
operation with the grass-manure mixture, the various T-RFLP profiles became more similar and the
447
community in both GB and GC reactors and the cel5 and cel 48 profile were dominated by T-RFs 74,
448
222, 228bp, and T-RF 328bp, respectively, according to clone libraries represented by Clostridium
449
cellulovorans (WP_010075948, 60.7% identity), Prevotella buccae (WP_004346180, 55.1% identity),
450
Bacteroides uniformis (WP_061411411, 67.5%, identity), and Herbinix sp. SD1D (WP_058258585, 89.7%
451
identity), respectively [15].
452
In the present study, the addition of MFW as a co-substrate changed both the cel5 and cel48
453
communities, not significantly in composition but somewhat more in relative abundance (Figure 4).
454
For the cel5 community, T-RF 222bp became slightly more abundant across all reactor samples by the
455
end of the experiment (from 48.8 ± 11.6 % to 56.8 ± 21.9 %), while T-RF 228bp decreased from 15.9 ±
456
7.2 % to 1.2 ± 1.4 % (Figure 4a). For the cel 48 community, T-RF 328bp increased in all reactor samples,
457
from 67.5 ± 4.6 % to 80.1 ± 13.7 % (Figure 4b). The three bacteria representing these dominant T-RFs
458
have been found in various anaerobic environments and show potential lignocellulolytic capacity
459
[65-68]. These three bacteria can also utilize starch as carbon resources [69-71], most likely explaining
460
the enrichment induced by MFW addition in the present study.
468
(a)
469
(b)
470
Figure 4. T-RFLP profile representing the community of glycoside hydrolase gene family 5 (cel5) (a)
471
and 48 (cel48) (b) in the reactor samples (GB1, GB2, GC1, and GC2), arranged by time (day 0, 147, and
472
231) and the substrate sample (GS0_0).
473
474
475
476
477
0% 10% 20% 30% 40% 50% 60% 70% 80% 90% 100%
cel5 T-RFLP profile
412 404400 332
244 240
236 232
228 224
222 216
212 208
164 156
144 132
128 112
108 104
100 96
92 84
80 74
0% 10% 20% 30% 40% 50% 60% 70% 80% 90% 100%
cel48 T-RFLP profile
358 352332 328
324 321
316 252
247 244
238 236
168 164
160 157
152 140
120 116
112 100
96 92
88 84
80 76
72 68
A different pattern in the T-RFLP profile was also seen in response to the feeding strategy, with
478
T-RF 216bp (4.6 ± 2.1%, cel5, not identified) and T-RF 321bp (16.7 ± 6.6%, cel48) mainly detected in
479
samples where all MFW and the grass-manure mixture were fed simultaneously (Figure 4). T-RF
480
321bp has previously been shown to correspond to a clone most closely related to Clostridium
481
thermocellum (ACT46162), with 75% identity [12]. This bacterium is reported to be a highly potent
482
cellulose degrader and to be enriched in anaerobic digesters fed lignocellulose-rich materials
483
[12,15,72]. Moreover, a species of this bacterium is reported to be capable of producing an
484
extracellular amylase when grown on starch [73]. The higher abundance of this bacterium possibly
485
explains the higher degradation efficiency of cellulose seen in GB1 and GC1 compared with GB2 and
486
GC2 in BMP test II.
487
488
5. Conclusions
489
Addition of MFW to four semi-continuous processes that had been operated with a
grass-490
manure mixture for ~200 days, and showed similar performance and microbial community structure,
491
resulted in a significant increase in volumetric methane production and a concomitant decrease in
492
specific methane production and substrate degradation efficiency. The magnitude of the decrease
493
varied between the processes and appeared to relate to the initial inoculum used for start-up. This
494
may have been caused by differences in the microbial community prevailing in the initial inoculum,
495
suggesting that the original inoculum can profoundly influence biogas production performance in
496
the long term and affect microbial responses to process operation changes. Applying different
497
feeding strategies for MFW addition had no clear influence on methane production or overall
498
microbial community structure, but had an impact on the development of the cellulose-degrading
499
community. Adding the MFW load all at once rather than in two portions at 2-hour intervals gave
500
slightly higher cellulose conversion activity (as indicated by BMP tests), possibly caused by higher
501
abundance of Clostridium thermocellum.
502
503
504
505
506
507
508
509
510
Supplementary Materials: Figure S1: Specific average methane production of four continuous laboratory-scale
511
biogas reactors, Figure S2: Residual methane production, Figure S3: Accumulated methane production from
512
cellulose, Table S1: Total changes over time in volatile fatty acid concentration.
513
Author Contributions: Conceptualization, Tong Liu, Li Sun, Åke Nordberg and Anna Schnürer; Data curation,
514
Tong Liu, Li Sun and Åke Nordberg; Formal analysis, Tong Liu; Investigation, Tong Liu, Li Sun and Anna
515
Schnürer; Methodology, Tong Liu, Li Sun, Åke Nordberg and Anna Schnürer; Project administration, Anna
516
Schnürer; Supervision, Åke Nordberg and Anna Schnürer; Visualization, Tong Liu; Writing – original draft,
517
Tong Liu; Writing – review & editing, Tong Liu, Li Sun, Åke Nordberg and Anna Schnürer.
518
Funding: This work was supported by the Swedish Energy Agency (ERA-NET Bioenergy), the China
519
Scholarship Council (CSC), [Grant No. 201307930025, 2014], and the STandUp for Energy program.
520
Acknowledgments: The authors thank Simon Isaksson for help with operation of the reactors and chemical
521
analysis.
522
Conflicts of Interest: The authors declare no conflict of interest. The funding sponsors had no role in the design
523
of the study; in the collection, analyses, or interpretation of data; in the writing of the manuscript; or in the
524
decision to publish the results.
References