Clinical Audit
Dovepress
M e T h O D O L O g y
open access to scientific and medical research
Open Access Full Text Article
Identification of a reliable subset of process
indicators for clinical audit in stroke care:
an example from Australia
Dominique A Cadilhac1,2
Monique Kilkenny1,2
Leonid Churilov1,2
Dawn harris3
erin Lalor3
on behalf of the National Stroke Foundation
1National Stroke Research Institute,
heidelberg heights 3081, Vic, Australia;
2Department of Medicine, The
University of Melbourne 3010, Australia; 3National Stroke
Foundation, Melbourne 3000, Australia
Correspondence: Dominique A Cadilhac National Stroke Research Institute, Level 1 Neurosciences Building, Repatriation Hospital, 300 Waterdale Road, Heidelberg Heights, Vic, Australia 3081
Tel +613 9496 2078 Fax +613 9496 2650 email [email protected]
Abstract: In 2007, the National Stroke Foundation (Australia) conducted the first national audit of acute inpatient services for stroke with .30 indicators. Routine collection of many variables can be a burden for clinicians, and methods to identify practical subsets are needed.
Purpose: To identify a subset of indicators to facilitate meaningful longitudinal comparisons, and to reliably represent the full suite of indicators.
Methods: 3 steps taken:
1) Value-based judgments to establish a subset were made by the National Advisory Committee (of the National Stroke Foundation) given: level of evidence, clinical relevance, consumer importance, and ability for international comparisons
2) Statistical analyses were used to identify subsets that could predict patient outcome and total process score
3) Comparisons of steps 1 and 2: logistic regression and estimation of agreement using intra-class correlation coefficient and Lin’s concordance coefficient.
Results: Value-based judgments resulted in 14 indicators being selected; parametric methods identified 12. Six indicators were consistently selected: stroke unit care; aspirin, physiotherapy assessment, and speech pathology assessment within 48 hours; a care plan; and antihypertensive medication at discharge. The scoring method based on the value-based indicator subset demonstrated excellent agreement with total process scores of hospitals.
Conclusion: Selection of an indicator subset requires consideration of several factors. Indicators selected by experts were robust.
Keywords: stroke, processes of care, performance, acute care, Australia
Introduction
To ensure that high quality care is delivered to patients, health care delivery must be routinely monitored, in order to provide evidence regarding clinical practice, and associated improvements in patient outcomes. An example of this is in the area of stroke care. In Australia, about 60,000 new stroke events occur each year.1 In addition,
stroke is the second leading cause of death (9% of all deaths) and is also a major cause of adult disability in Australia.1,2 This situation is similar to that experienced in many
other countries.3 One method of reducing deaths and disability associated with stroke is
to ensure high quality healthcare, whereby evidence-based interventions are provided in hospitals. However, it is not possible to measure every aspect of clinical practice in stroke. Therefore, selection of a core group of measureable, meaningful and reliable variables is required. This is of particular importance in the area of stroke where: a) variability in the quality of clinical care has been shown to result in worse outcomes,4–6 b) the wide
Clinical Audit downloaded from https://www.dovepress.com/ by 118.70.13.36 on 20-Aug-2020
For personal use only.
Number of times this article has been viewed
This article was published in the following Dove Press journal: Clinical Audit
Dovepress
Cadilhac et al
variety of impairments associated with stroke (eg, speech and l anguage, physical, sensory, cognitive) require m anagement by a multidisciplinary team during hospitalization; and c) vari-ous evidence-based treatments, such as access to stroke care units (ie, a dedicated ward, or ward area, with specialized staff focused on the management of stroke, and who provide early rehabilitation), and prevention strategies (for example, blood pressure lowering) are available.7 Therefore, the breadth of
potential quality of care assessment indicators for acute stroke is large, because there are many different clinical activities that could be measured.
Various national audit programs have been established in the area of stroke care, and several countries have established core sets of clinical indicators to evaluate the quality of stroke care services.8–10 The majority of these core sets have been
decided upon using expert opinion, rather than through ana-lytic methods of inquiry. For example, in the United Kingdom (UK), the National Sentinel Stroke Audit has a large number of variables, with a core subset of 12 clinical indicators main-tained since 2002 to permit longitudinal comparisons.8 These
12 UK variables were agreed upon using expert consensus, and validated using statistical models, to determine how the subset correlated with total process scores of 40 variables.11
Between 2006 and 2008, this UK subset was reduced to 9 key indicators, in consultation with the Department of Health and the Healthcare Commission.12 In the United States, an expert
panel was convened by the Centers for Disease Control and Prevention, who decided on 9 consensus-based data elements to be used in the Paul Coverdell National Acute Stroke Reg-istry.13 One of the l imitations of expert consensus methods is
that robust investigation of whether a variable is epidemiologi-cally sound, reliable, and valid, is rarely considered in a for-malized and objective way, even though this may be important to maximize the utility of collecting these variables.
Clinical process indicators provide a sensitive and direct measure of the quality of care provided by clinicians.14 The
use of such indicators enables clinicians and health care organizations to monitor and evaluate what happens to patients, as a consequence of how well each of these elements function to provide for the needs of patients.15 When subjective
approaches to developing indicators or to d eciding on variables for use in clinical audits are used, these can compromise the ability to make comparisons between audits within the same area of interest. A recent literature review of published clini-cal process indicators revealed that about 161 indicators of acute care clinical processes had been published for stroke. The authors reported that among these indicators there was much variability regarding the methods of data collection, and
definitions (especially of time criteria), with under one third of indicators cited six or more times in the literature.16 When
these common indicators were mapped to the 2003 Australian
Clinical Guidelines for Acute Stroke Management,17 it was
revealed that most (79%) were found in these guidelines. Over half (59%) of the indicators were based on expert opinion, and 12% were based on evidence from systematic reviews of randomized controlled trials (Level 1 evidence).16,18 The
most frequently-published indicators were for brain imaging within 24–48 hours, and dysphagia s creening within 24–48 hours.16 Purvis et al concluded that either little research is
available to inform quality assessment measures in stroke, or that expert opinion overrides the evidence base.16 Clearly,
the recent growth in clinical guideline development, and the assimilation of the evidence base for stroke, provides a more robust background from which to decide which process indi-cators should be measured.
In 2007, the National Stroke Foundation (NSF) developed and conducted a clinical audit, in collaboration with acute public hospitals admitting people with stroke in Australia.19
Clinical indicators to be measured in this audit (>31 indicators) were established, based on the 2003 Clinical Guidelines for Acute Stroke Management r ecommendations, with review and refinements made by a multidisciplinary National A dvisory Committee.17 Following this initial audit program, the NSF
sought to establish a core subset of ‘primary’ clinical process indicators that would provide a mechanism for monitoring the quality of care provided over time, recognizing that the other variables may change. It was also envisaged that these selected indicators might provide sufficient utility to become: a) part of a national hospital indicator dataset maintained by the Australian Council on Health Services for accreditation purposes,20 and b) part of the work program for a National
Indicator Program for Clinical Quality Registries being devel-oped by the Australian Commission on Safety and Quality in Healthcare.21 The advantages of inclusion in these initiatives
would be that these data would become embedded in routine national data collection systems, and allow comprehensive and prospective reporting.22
It is noted that the selection of a subset of indicators requires consideration of a range of factors. This includes the potential for an indicator to reliably reflect quality of care, defined as a process of care having a plausible link to patient outcome. In addition, an indicator should be: easily- and consistently-collected, relevant to clinicians and consumers, and useful for informing clinical practice change. Because we had process of care and patient outcomes data from the 2007 NSF audit to assist us with decision-making about
Clinical Audit downloaded from https://www.dovepress.com/ by 118.70.13.36 on 20-Aug-2020
Dovepress How to identify a reliable subset of process indicators for quality assessment in stroke care
which indicators to include in a national subset, but we also recognized the importance of ‘relevance’, we chose to use quantitative statistical methods and qualitative information from a convenience sample of experts to identify potential subsets and test which subset combination of indicators would be the most useful and valid.
The aims of this study were to use the data from the 2007 NSF acute stroke services audit to identify a subset of indicators that would be meaningful for ongoing quality assessment, and reliably represent the full suite of i ndicators, as well as demonstrate an association with patient outcomes.
Methods
Research design
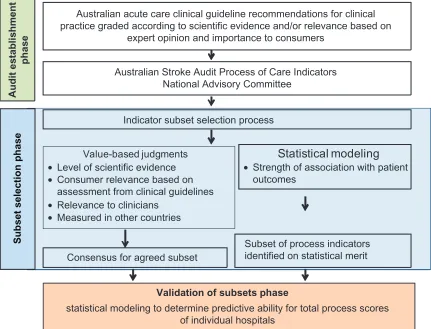
Mixed-methods using quantitative statistical (technical) analysis and guided (value-based) qualitative review methods were used to identify and test different indicator subsets (Figure 1). Mixed methods can be considered as the use of qualitative and quantitative methods in a single study, and is usually undertaken by researchers wanting to address a wider range of questions than quantitative methods alone would
allow.23 The use of mixed methods for decision-making in
health care recognizes the complexity of health care and the need to integrate evidence-based data and subjective values in judgments for clinical decision making.24
Clinical audit dataset used in this study
The NSF 2007 Clinical Audit involved a retrospective audit of 2,724 patient case notes, admitted from 1 October 2006 to 31 March 2007, in the 89 participating hospitals (up to 40 c onsecutive admissions per hospital).25 All Australian public
hospitals admitting stroke patients were eligible and invited to participate (n = 338). Two-hundred and fifty-four completed a survey about their stroke services, and 89 (26%) agreed to participate in the clinical audit of medical records. The median number of cases audited per hospital was 40 (2 min, 45 max). The lower-than-expected case ascertainment at some participating hospitals is explained by the differences in size of the hospitals, and the variation in the numbers of people admitted during the audit time period. Few rural hospitals (n = 19, 21%), defined as having a population of less than 25,000, contributed data to the national audit. Most hospitals
Indicator subset selection process
Value-based judgments
• Level of scientific evidence
• Consumer relevance based on
assessment from clinical guidelines
• Relevance to clinicians
• Measured in other countries
Statistical modeling
• Strength of association with patient
outcomes
Australian acute care clinical guideline recommendations for clinical practice graded according to scientific evidence and/or relevance based on
expert opinion and importance to consumers
Australian Stroke Audit Process of Care Indicators National Advisory Committee
Consensus for agreed subset
Subset of process indicators identified on statistical merit
Validation of subsets phase
statistical modeling to determine predictive ability for total process scores of individual hospitals
Subset selection phase
Audit establishment
phase
Figure 1 Summary of research design.
Clinical Audit downloaded from https://www.dovepress.com/ by 118.70.13.36 on 20-Aug-2020
Dovepress
Cadilhac et al
that participated in the audit were tertiary referral centers, with access to brain imaging and neurosurgeons (n = 29), or large hospitals with good infrastructure but no access to neurosurgeons (n = 54), and in 48 hospitals there was a dedicated Stroke Unit.19 Patients with an ICD10 code of I61.0–
I61.9 (I ntracerebral hemorrhage), I63.0–I63.9 ( Cerebral infarc-tion), I64 (Stroke not specified as hemorrhage or infarction) and I62.9 ( Intracerebral hemorrhage unspecified) were eligible for inclusion. Patients presenting with transient ischemic attack or subarachnoid hemorrhage were excluded. Data were entered into a secure web-based data-entry tool.19
Adherence to processes of care was generally calculated on the entire sample (excluding missing data). Care was taken to ensure estimation of adherence for applicable cases only. For example, adherence to use of antithrombotics on discharge was calculated only for patients with ischemic stroke.26 Further details about the audit are reported in a
companion paper by Harris et al 2010.25
Methods for selecting and testing
indicator subsets
The process of selecting the subset of indicators included two discrete processes: 1) obtaining expert opinion about the importance of the indicators, with input from the National Advisory Committee (‘value-based’ judgment or qualitative method); and 2) assessing the statistical r elationship between the process indicators and clinical outcome, to determine which ones would be more useful to measure, when assessing quality of care. Comparisons of results from both approaches were then undertaken, whereby the validity of each indica-tor subset to provide a quality of care adherence score was compared to using the entire indicator set. Figure 1 provides an outline of each process that led to the i dentification of the indicator subsets and validation.
Qualitative assessment: value-based
judgments
Value-based judgments were made using four criteria to assist in defining which subset of indicators might be the most appropriate to collect from the larger indicator set. The criteria are not presented in order of importance, and were developed to inform the selection process. Details relevant to each criteria, and how they were used, are also provided:
Criteria 1
What is the level of scientific evidence for the p rocess indicator? The level of scientific evidence was previously-defined, according to national standards, during the establishment of
the 2007 Clinical Guidelines for Acute Stroke Management, whereby each recommendation received a grading of s cientific merit (for example, Level 1 systematic review of randomized controlled trials, and Level 4 evidence from cases series out-comes).7,18 These clinical guideline recommendations were
the basis for defining the full process indicator suite for the national audit, and the levels of evidence were provided to the National Advisory Committee directly from this document, for this present study.
Criteria 2
What is the clinical relevance of the indicators? This required members of the National Advisory Committee to provide expert judgment for each process indicator, using subjective categories of low, medium and high.
Criteria 3
What is the importance to consumers of these indicators? Detailed assessment of consumer relevance was previously undertaken, as part of the development of the 2007 Clinical Guidelines for Acute Stroke Management.7 The
average consumer ratings, which provide a score out of 10 (with 10 being extremely important) for the stroke care recommendations, were derived from focus groups, and the results provided to the National Advisory Committee directly from this document, for this present study.
Criteria 4
Is the indicator in the UK indicator set to enable international comparisons or benchmarking? A mapping process was undertaken and the results provided to the National Advisory Committee for this present study.
The National Advisory Committee members individually examined the information provided for each criterion above, and then collectively discussed which indicators should be included in a subset, as part of a teleconference to provide a consensus-based response.
Quantitative indicator subset derivation
In order to assess the importance of process indicators in determining patient outcome, the association between process indicators (independent variables) and functional i ndependence at time of hospital discharge (dependent variable) was evaluated by using forward multivariate logistic regression models. This required dichotomizing the modified Rankin score data for all patients, into those who were consid-ered independent, and those who had died, or were dependent at time of hospital discharge. Independence was defined,
Clinical Audit downloaded from https://www.dovepress.com/ by 118.70.13.36 on 20-Aug-2020
Dovepress How to identify a reliable subset of process indicators for quality assessment in stroke care
using a modified Rankin score of 0–2, which ranges from no symptoms at all (score = 0) to slight disability; unable to carry out all previous activities, but able to look after own affairs without assistance (score = 2).27 Death or dependency is a
modified Rankin score of 3–6. We used basic demographic (age and gender) and four validated stroke severity prognostic variables (presence of an arm deficit, speech difficulties, and ability to walk at time of hospital admission, and incontinence within 72 hours of admission)28 to account for differences in
patient case-mix which may have influenced the association of various process indicators, and patient outcomes, using statistical models.
Additional statistical analyses:
classification and regression trees
Because stroke units represent a bundle of clinical care processes, as well as being a structural or organizational approach to providing stroke care, we used Classification and Regression Trees (CART) analyses as a nonparametric method of investigating the relationship between stroke unit care and the other process of care indicators. The CART algorithm successively chooses the ‘best’ independent v ariable that allows it to split the data into two groups, in order to reduce the variability of the dependent variable in these groups.29,30 As such, its primary aim is to classify the data into
groups that are more homogenous, as far as the dependent variable is concerned. As a by-product of this analysis, CART reports the ‘relative importance’ scores for the independent variables that were used while building the classification or regression tree. The maximum importance score assigned to a variable in the CART 5.0 software implementation of the algorithm is 100. It is important to note that as the primary aim of CART algorithm is classification, the relative impor-tance ranking of independent variables produced by CART should be treated with a degree of caution.
Validation of indicator subsets
Lastly, each indicator subset was assessed, to determine if it was predictive of the total process indicator score for individual hospitals, drawing on the methods previously used in the UK.11
A ‘total process score’ is a summary measure, used to provide a general and comparable score for a hospital regarding quality of stroke care. Although the identified indicator subsets in this study may be considered to have face- and content-validity, assessment against the overall performance, in using all process indicators, enhances the validity of a subset.8 A ‘total
process score’ was determined as the mean adherence of all the indicators for each hospital. Another ‘process score’ (subset
score) was then calculated for each hospital, only using the indicator subset of interest, for example the value-based set. A process score could not be calculated for a hospital if there were missing data for one or more indicators. This reduced the sample size from 89 to 69 hospitals included for these analyses. Agreement between the individual subset scores and the total process score was evaluated independently using intraclass correlation coefficient and Lin’s concordance coefficient,31 and
further confirmed with reduced major axes regression.
Results
Qualitative ‘value-based judgment’
assessment
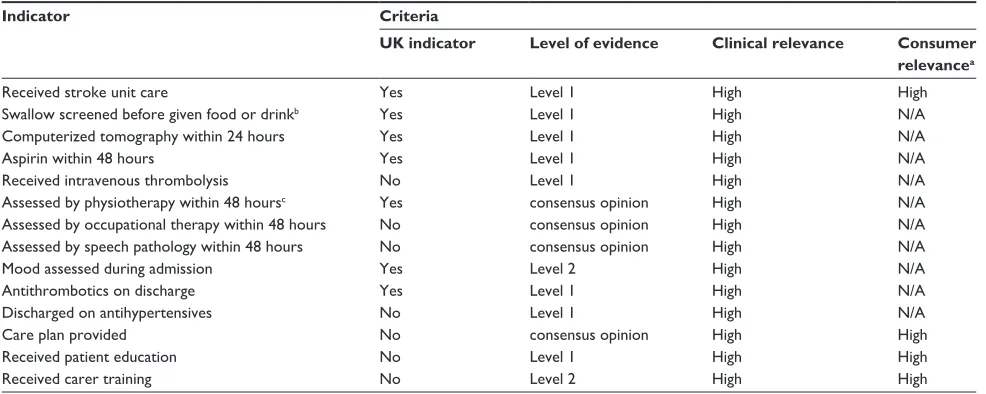
The proposed subset of clinical ‘process’ indicators derived from the value-based selection approach is presented in Table 1. Fourteen indicators were proposed by the National Advisory Committee. All indicators are considered to be very clinical relevant, and eight have Level 1 evidence to support their inclusion as an indicator.
Parametric data analyses
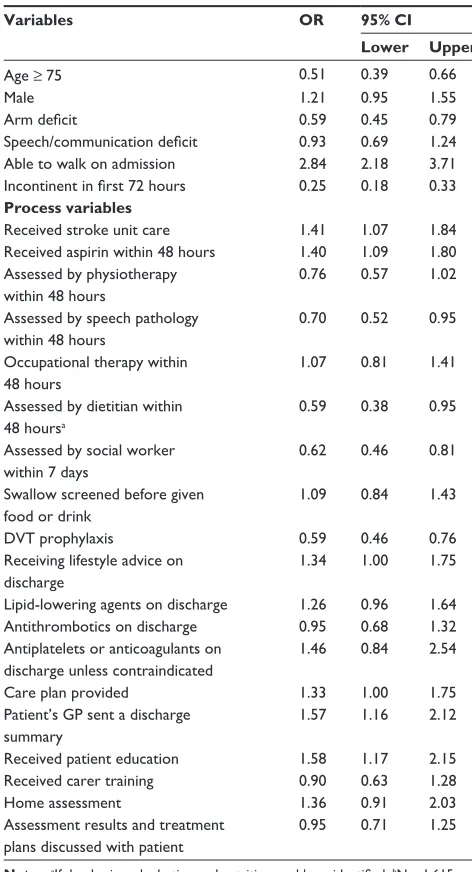
Table 2 provides the results for the process indicators that were determined to be important from the logistic regression model for patients being independent at discharge. The process indicators that most strongly predicted independence at discharge included receiving stroke unit care, and aspirin within 48 hours of ischemic stroke. A clinically important trend for improved outcome was reported if cholesterol-lowering agents were given at discharge (if ischemic stroke) was also noted. Unsurprisingly, patients who were discharged home from hospital were more likely to receive lifestyle advice on the benefits of quitting smoking, healthy eating and exercise; receive a care plan; have a discharge summary sent to their GP; and receive education. Variables found to be i mportant in determining whether a patient was less likely to be i ndependent at discharge included being assessed by speech pathology within 48 hours; assessed by a dietitian within 48 hours (if presenting with dysphagia or nutrition problems); assessed by a social worker within 7 days; and receiving deep vein thrombosis (DVT) prophylaxis.
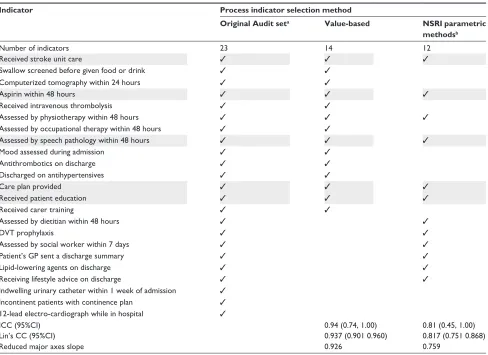
The results from each of the methods for selecting a subset of clinical indicators for acute inpatient stroke care applied in this study are summarized in Table 3. Six indicators were nominated consistently, using each method:
• received stroke unit care
• aspirin within 48 hours of ischemic stroke
• assessed by physiotherapy within 48 hours
• assessed by speech pathology within 48 hours
Clinical Audit downloaded from https://www.dovepress.com/ by 118.70.13.36 on 20-Aug-2020
Dovepress
Cadilhac et al
• care plan provided at discharge; and
• received patient education.
In both subsets the ‘access to Stroke Unit’ indicator was nominated. The relative ranking of independent classifiers/ predictors in terms of their importance for obtaining the result-ing CART model, for those patients who received stroke unit care, is reported in Table 4. This model groups all process variables associated with stroke unit care. These results show that many of the processes measured in the National Stroke Audit-Acute Services were strongly associated with care of patients in a stroke unit. More medically-orientated processes, such as receiving aspirin within 48 hours had a low level of association with stroke units, compared with allied health assessments. Computerized Tomography (CT) scans and Electrocardiograph (ECG) had a low level of association with stroke units, reflecting that these processes probably occur regardless of the care setting in which they are provided.
Comparison of hospital variation
between ‘total process score’ and ‘subset’
indicator scores
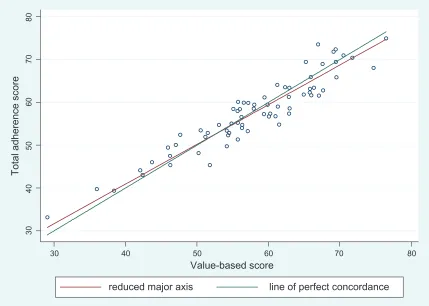
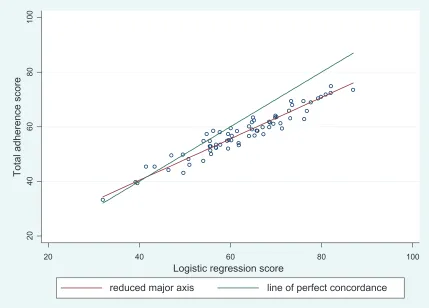
Table 3 summarizes the results of agreement analysis between the mean individual hospital scores using the subset scores compared to the original audit set (total process score). Figures 2 and 3 show graphs of mean individual hospital scores using the subset scores compared to the original audit set (total process score). Figure 2 shows the agreement between value-based subset and total process score. The scoring based on the 14 key process indicator subset derived
from the value-based approach was found to have excellent agreement with the total process score (ICC = 0.94). Figure 3 shows the agreement between parametric methods derived subset and total process score. The scoring based on 12 key process indicators chosen by the parametric method exhibited good-to-excellent agreement with the total process score (ICC = 0.80).
Discussion
A major strength of this study is that the identification of a reliable set of indicators for stroke was not based solely on expert opinion,32,33 but verified through analytical methods
using national data from an Australian acute hospital stroke services audit. We assessed the statistical r elationship between the process indicators and clinical outcome using two differ-ent statistical approaches. Both statistical approaches were used to assess whether the patients were independent on dis-charge (based on a modified Rankin Score 0–2 [independent] vs 3–6 [dead or dependent]).27 The various methods used
produced consistent findings, which supports the preferred selection process, which includes value-based judgments and validation through statistical modeling.
It was reassuring that several of the nominated variables had Level 1 evidence and were shown to be important in the statistical approach used for determining independence at dis-charge. Notably, these were: receiving stroke unit care, aspirin within 48 hours, and discharged on antihypertensive medica-tion. Using results from logistic regression analyses, in patients who received stroke unit care, the odds of being independent at
Table 1 Proposed subset of ‘process’ indicators based on value judgments of experts
Indicator Criteria
UK indicator Level of evidence Clinical relevance Consumer
relevancea
Received stroke unit care yes Level 1 high high
Swallow screened before given food or drinkb yes Level 1 high N/A
Computerized tomography within 24 hours yes Level 1 high N/A
Aspirin within 48 hours yes Level 1 high N/A
Received intravenous thrombolysis No Level 1 high N/A
Assessed by physiotherapy within 48 hoursc yes consensus opinion high N/A
Assessed by occupational therapy within 48 hours No consensus opinion high N/A
Assessed by speech pathology within 48 hours No consensus opinion high N/A
Mood assessed during admission yes Level 2 high N/A
Antithrombotics on discharge yes Level 1 high N/A
Discharged on antihypertensives No Level 1 high N/A
Care plan provided No consensus opinion high high
Received patient education No Level 1 high high
Received carer training No Level 2 high high
Notes:aConsumer relevance preferences were obtained as part of the development of the Australian 2007 Clinical Guidelines for Acute Stroke Management. Initial consultation with consumers was that they felt not well qualified to provide detailed feedback on all topics and therefore seven broad areas with 18 topics provided in lay language were reviewed by consumers in a focus group format7; bUK indicator use ,24 hours of admission; cUK indicator use 72 hours.
Abbreviations: N/A, not available; UK, United Kingdom.
Clinical Audit downloaded from https://www.dovepress.com/ by 118.70.13.36 on 20-Aug-2020
Dovepress How to identify a reliable subset of process indicators for quality assessment in stroke care
discharge was about 40% greater than for those not treated in a stroke unit. A similar result was also observed for those given aspirin within 48 hours (OR 1.40, 95% CI 1.09 to 1.80). These findings are consistent with the results from meta-analyses of clinical trials for these interventions.6,34 The discharge
indica-tors of receiving a care plan, patient education, and a home assessment, as well as a discharge summary being sent to the patient’s GP, were more commonly adhered to in patients who were classified as independent at discharge. This was expected, since in these circumstances patients were commonly dis-charged directly to a home setting.
The findings highlight the importance of multidisci-plinary management for stroke. Allied health variables
consistently appeared as important factors for predicting patient outcome. Several indicators were found to predict a greater chance of death or dependency, including speech assessment within 48 hours; dietitian assessment within 48 hours, if dysphagia or nutritional problems on admission; DVT prophylaxis; and assessment by a social worker within 7 days of admission. These findings need to be interpreted with caution, since they reflect cases with more severe stroke and who have greater care needs, rather than indicating potentially inappropriate care. This is because multidisciplinary care is one of the major cornerstones of best practice management in acute stroke.6 DVT prophylaxis in this study included
either use of TED (anti-thrombotic) stockings, or heparin. DVT p revention is a contentious issue, and the evidence is unclear for use of stockings in improving outcomes for stroke patients.7
Although the logistic regression takes into account age and other baseline severity factors, the results may not account for all such differences between those discharged as independent and those discharged as dependent.35 In fact, the strongest
predictor of being independent at discharge was whether patients were able to walk on admission (OR 2.84 95% CI 2.18 to 3.71). Thus, the purpose of why the indicators need to be collected is important. If we are only interested in who gets to be independent following an acute hospital admission ( usually of 10-days duration) then such variables might also be important to consider. However, these are beyond the con-trol of the health system, and t herefore, considering which clinical processes influence patient outcome is more useful if i mprovements in care provision are to be made. This is an area where further research is needed. For example, further analyses to determine the processes of care that may be important among patients with severe stroke.
A CART analysis was used to assess the association between stroke unit care and the other process indicators. Process variables found to be important for stroke unit care included DVT prophylaxis, and assessment by allied health team members, such as physiotherapy, speech pathology and social work. Interestingly, receiving aspirin was not found to be an important process variable in receiving stroke unit care, but it was shown in previous analyses to be very important in determining whether a patient would be independent at discharge. This information is illustrative of the complex nature of health care.
The analysis using the subset of indicators selected by experts provides some evidence that expert opinion can be just as good as independent statistical assessments in determining which indicators it might be important to
Table 2 Fitted logistic regression model for modified Rankin score at discharge (mRS 0–2 vs 3–6)b
Variables OR 95% CI
Lower Upper
Age ≥ 75 0.51 0.39 0.66
Male 1.21 0.95 1.55
Arm deficit 0.59 0.45 0.79
Speech/communication deficit 0.93 0.69 1.24 Able to walk on admission 2.84 2.18 3.71 Incontinent in first 72 hours 0.25 0.18 0.33 Process variables
Received stroke unit care 1.41 1.07 1.84 Received aspirin within 48 hours 1.40 1.09 1.80 Assessed by physiotherapy
within 48 hours
0.76 0.57 1.02
Assessed by speech pathology within 48 hours
0.70 0.52 0.95
Occupational therapy within 48 hours
1.07 0.81 1.41
Assessed by dietitian within 48 hoursa
0.59 0.38 0.95
Assessed by social worker within 7 days
0.62 0.46 0.81
Swallow screened before given food or drink
1.09 0.84 1.43
DVT prophylaxis 0.59 0.46 0.76
Receiving lifestyle advice on discharge
1.34 1.00 1.75
Lipid-lowering agents on discharge 1.26 0.96 1.64 Antithrombotics on discharge 0.95 0.68 1.32 Antiplatelets or anticoagulants on
discharge unless contraindicated
1.46 0.84 2.54
Care plan provided 1.33 1.00 1.75
Patient’s gP sent a discharge summary
1.57 1.16 2.12
Received patient education 1.58 1.17 2.15 Received carer training 0.90 0.63 1.28
home assessment 1.36 0.91 2.03
Assessment results and treatment plans discussed with patient
0.95 0.71 1.25
Notes:aIf dysphagia or hydration and nutrition problems identified; bN = 1,615.
Abbreviations: DVT, deep vein thrombosis; gP, general practitioner.
Clinical Audit downloaded from https://www.dovepress.com/ by 118.70.13.36 on 20-Aug-2020
Dovepress
Cadilhac et al
measure. This might have been enhanced by the use of structured criteria to facilitate the value-based judgment decision-making process, including the level of evidence for a variable. In our study, eight of the 12 processes indicators
selected by experts were also determined to be variables that should be included in the logistic regression models, and five of these were found to be strongly associated with outcome. The six indicators that were consistently selected, irrespective of method used were: received stroke unit care; aspirin within 48 hours of ischemic stroke; assessed by physiotherapy within 48 hours, and assessed by speech pathology within 48 hours, care plan and antihypertensive medication at discharge.
The agreement between each subset of indicators in predicting the overall ‘process score’ was assessed. The sub-set of indicators selected by experts again provided further evidence that expert opinion reliably identified the important aspects of care, because this subset had excellent agreement with the total process scores of hospitals. This provides reassurance that this subset would be a fair representation of all the standards (indicators) measured in this audit. Similarly, the parametric approach also demonstrated excellent agreement with the total process score, and
Table 3 Comparison of recommended ‘process’ indicators based on value judgments of experts and derived from statistical analyses
Indicator Process indicator selection method
Original Audit seta Value-based NSRI parametric
methodsb
Number of indicators 23 14 12
Received stroke unit care ✓ ✓ ✓
Swallow screened before given food or drink ✓ ✓
Computerized tomography within 24 hours ✓ ✓
Aspirin within 48 hours ✓ ✓ ✓
Received intravenous thrombolysis ✓ ✓
Assessed by physiotherapy within 48 hours ✓ ✓ ✓
Assessed by occupational therapy within 48 hours ✓ ✓
Assessed by speech pathology within 48 hours ✓ ✓ ✓
Mood assessed during admission ✓ ✓
Antithrombotics on discharge ✓ ✓
Discharged on antihypertensives ✓ ✓
Care plan provided ✓ ✓ ✓
Received patient education ✓ ✓ ✓
Received carer training ✓ ✓
Assessed by dietitian within 48 hours ✓ ✓
DVT prophylaxis ✓ ✓
Assessed by social worker within 7 days ✓ ✓
Patient’s gP sent a discharge summary ✓ ✓
Lipid-lowering agents on discharge ✓ ✓
Receiving lifestyle advice on discharge ✓ ✓
Indwelling urinary catheter within 1 week of admission ✓
Incontinent patients with continence plan ✓
12-lead electro-cardiograph while in hospital ✓
ICC (95%CI) 0.94 (0.74, 1.00) 0.81 (0.45, 1.00)
Lin’s CC (95%CI) 0.937 (0.901 0.960) 0.817 (0.751 0.868)
Reduced major axes slope 0.926 0.759
Notes: Shading highlights indicators that were selected irrespective of method; aas presented in the audit report (17); bfitted multivariable logistic regression model.
Abbreviations: ICC, intra-class correlation coefficient; Lin’s CC, Lin’s concordance coefficient; DVT, deep-vein thrombosis; GP, general practitioner; NSRI, National Stroke Research Institute.
Table 4 Variable importance by stroke unit care using classi-fication and regression tree nonparametric methods
Variable Score
Assessed by physiotherapy within 48 hrs 100.00
DVT prophylaxis 69.92
Assessed by speech pathology within 48 hrs 57.29 Assessed by a social worker within 7 days 55.59 Occupational therapy within 48 hrs 40.71 Swallow screened before given food or drink 32.05
Mood assessed during admission 17.47
CT scan within 24 hrs 11.50
Antithrombotics on discharge 8.52
Assessed by a dietitian within 48 hrsa 6.28
eCg while in hospital 3.29
Received aspirin within 48 hrs 1.36
Notes: DVT: deep vein thrombosis; aif dysphagia or hydration and nutrition problems identified.
Clinical Audit downloaded from https://www.dovepress.com/ by 118.70.13.36 on 20-Aug-2020
Dovepress How to identify a reliable subset of process indicators for quality assessment in stroke care
included 6 overlapping indicators with the value-based set. The difference in the process score between the value-based and logistic regression model may be explained by a number of factors. These factors may include: that there were two extra variables in the value-based subset, improving the precision of this model; that the regression method assumes a particular relationship, which approximates the true relationship between an indicator and patient outcome, and this approximation may introduce some error component; and lastly, regression models are limited in their ability to discriminate between variables in a multidimensional way, whereas clinicians have a more complex understanding of the nature of the relationship between indicators, health care and patient outcome.
Stroke process indicator sets have been developed in other countries, and some similarities can be found with the Austra-lian subsets presented here. Similar to Australia, the majority of programs in other countries include indicators relating to stroke unit care or allied health interventions, and specific aspects of stroke education.33,36,37 Differences in indicator
sub-sets, or definitions for indicators, may prevent international comparisons. Another area of future research is to promote use of a core set of clinical indicators internationally for
stroke, and this may be facilitated by undertaking a similar process, as outlined in this paper.
Conclusion
The selection of a subset of indicators requires consideration of a range of factors. This includes not only the potential for an indicator to be able to reflect quality of care, defined as a process of care having a plausible link to patient outcome, but also whether an indicator is able to be reliably and easily collected; is relevant to clinicians; and is useful for informing clinical practice change. Use of objective criteria to guide decision-making in selecting a subset of i ndicators, and the ability to test and validate this approach using st atistical methods, were shown to be important features of this process. There is a growing body of literature outlining the benefits of structured decision processes incorporating detailed technical analysis.24 Our study supports the use of mixed methods and
provides evidence that structured decision-making that can then be tested for reliability using relevant data is robust, and can provide equivalent or superior results to undertaking technical analysis alone. The methods applied in this study add value to the literature in the area of clinical audit, clinical indicator development and healthcare decision-making.
30
40
50
60
70
80
Total adherence score
30 40 50 60 70 80
Value-based score
reduced major axis line of perfect concordance
Figure 2 Agreement between total process scores of original audit set compared to the value-based subset.
Clinical Audit downloaded from https://www.dovepress.com/ by 118.70.13.36 on 20-Aug-2020
Dovepress
Cadilhac et al
Acknowledgments
We acknowledge the National Advisory Committee who con-tributed to the development of the National Stroke Audit: Acute Services (Chair: Professor Graeme Hankey, Members: Dr Dominique Cadilhac, Dr David Dunbabin, Dr Richard Gerraty, Dr Erin Godecke, Mr Craig Harris, Ms Dawn Harris, Mr Kelvin Hill, Dr Susan Hillier, Dr Mahmoud Khan, Dr Erin Lalor, Ms Jane Levy, Dr Harry Randhawa, Ms T ennille Rowland, Dr David Schultz, Professor Cate Storey, Dr Alistair Wright).
Dominique Cadilhac and Monique Kilkenny were c ontracted by the National Stroke Foundation to u ndertake the statistical analyses for the National Stroke Audit: Acute Services. Leonid Churilov provided s tatistical advice on the CART component of these analyses.
We would like to thank all who participated in the audit includ-ing all members of the National Stroke Audit Collaborative.
Disclosure
The authors report no conflicts of interest in this work.
References
1. Senes S. How we manage stroke in Australia. AIHW cat no CVD 31. Canberra: Australian Institute of Health and Welfare; 2006.
2. Australian Bureau of Statistics. 3303.0 Causes of death 2206: Australia. Canberra: ABS; 2008. 3303.0.
3. Strong K, Mathers C, Leeder S, Beaglehole R. Preventing chronic diseases: how many lives can we save? Lancet. Published online October 5 2005;DOI:10.1016/S0140–6736(05)657341–2:5.
4. Cadilhac DA, Pearce DC, Levi CR, Donnan GA. Improvements in the quality of care and health outcomes with new Stroke Care Units following implementation of a clinician-led, health-system redesign programme in New South Wales, Australia. Qual Saf Health Care. 2008;17:329–333.
5. Cadilhac DA, Ibrahim J, Pearce DC, et al. Multicenter com-parison of processes of care between Stroke Units and con-ventional care wards in Australia. Stroke. 2004;35(5): 1035–1040.
6. Stroke Unit Trialists’ Collaboration. Organised inpatient (stroke unit) care for stroke (Cochrane Review). Oxford: Update Software. Cochrane
Database Syst Rev. 2003(1):CD000197.
7. National Stroke Foundation. Clinical guidelines for acute stroke
management. Melbourne: National Stroke Foundation; 2007.
8. Royal College of Physicians of London. National Sentinal Audit
of Stroke Phase I (organisational audit) 2006 Phase II (clini-cal audit) 2006. Report for England Wales and Northern Ire-land. United Kingdom: Royal College of Physicians of London;
April 2007.
9. Mainz J, Krog BR, Bjornshave B, Bartels P. Nationwide continuous quality improvement using clinical indicators: the Danish National Indicator Project. Int J Qual Health Care. 2004;16 Suppl 1: i45–50.
10. Heuschmann PU, Kolominsky-Rabas PL, Kugler C, et al. [Quality assurance in treatment of stroke: basic module of the German Stroke Registry Study Group]. Gesundheitswesen. 2000;62(10): 547–552.
11. Rudd A, Lowe D, Hoffman A, Irwin P. Potential indicators for the
quality of care for stroke patients: results of statistical analysis
February 2002.
20
40
60
80
100
Total adherence score
20 40 60 80 100
Logistic regression score
reduced major axis line of perfect concordance
Figure 3 Agreement between the total process score and parametric subset score of the parametric subset.
Clinical Audit downloaded from https://www.dovepress.com/ by 118.70.13.36 on 20-Aug-2020
Clinical Audit
Publish your work in this journal
Submit your manuscript here: http://www.dovepress.com/clinical-audit-journal
Clinical Audit is an international, peer-reviewed, open access journal focusing on the processes and outcomes of clinical audit in any area of healthcare. All aspects of patient care are addressed within the journal and practitioners from all disciplines are invited to submit their work. Areas covered include: Publication of audits; How an audit has changed practice;
Practical tips on how to do audits and to avoid pitfalls; How audits have changed patient care; Calls and justifications for new audits. The manuscript management system is completely online and includes a very quick and fair peer-review system, which is all easy to use. Visit http://www.dovepress. com/testimonials.php to read real quotes from published authors.
Dovepress
Dovepress
How to identify a reliable subset of process indicators for quality assessment in stroke care
12. Royal College of Physicians of London. National Sentinel Stroke Audit
Phase II clinical audit 2008. Report for England, Wales and Northern Ireland 2008. London: Clinical Effectiveness and Evaluation Unit,
Royal College of Physicians of London; April 2009.
13. Wattigney WA, Croft JB, Mensah GA, et al. Establishing data elements for the Paul Coverdell National Acute Stroke Registry: Part 1: p roceedings of an expert panel. Stroke. 2003;34(1):151–156. 14. Mant J. Process versus outcome indicators in the assessment of quality
of health care. Int J Qual Health Care. 2001;13(6):475–480. 15. Mainz J. Defining and classifying clinical indicators for quality
i mprovement. Int J Qual Health Care. 2003;15(6):523–530. 16. Purvis T, Cadilhac D, Donnan G, Bernhardt J. Systematic review of
p rocess indicators: including early rehabilitation interventions used to measure quality of acute stroke care. Int J Stroke. 2009;4(2): 72–80.
17. National Stroke Foundation. National guidelines for acute stroke
management. Melbourne: National Stroke Foundation; 2003.
18. National Health and Medical Research Council. How to use the
evidence: assessment and application of scientific evidence: Handbook series on preparing clinical practice guidelines. Canberra: NHMRC;
2000.
19. National Stroke Foundation. National Stroke Audit Clinical
Report: Acute Services. Melbourne: National Stroke Foundation;
November 2007.
20. Collopy BT. Developing clinical indicators: the ACHS Care Evaluation Program. Aust Clin Rev. 1990;10(2):83–85.
21. Barraclough B. The role of safety and quality councils in improv-ing the quality of healthcare: an Australian perspective. Health Pap. 2006;6(3):24–32; discussion 58–61.
22. Australian Commission on Safety and Quality in Health Care. Operating
Principles and Technical Standards for Australian Clinical Quality Registries. Sydney: ACS&QHC; November 2008.
23. O’Cathain A, Murphy E, Nicholl J. Why, and how, mixed methods research is undertaken in health services research in England: a mixed methods study. BMC Health Serv Res. 2007;7:85.
24. Hunink M, Glasziou P, Siegel J, et al. Decision making in health and
medicine: integrating evidence and values. Cambridge: Cambridge
University Press; 2001.
25. Harris D, Cadilhac D, Hankey GJ, Hillier S, Kilkenny M, Lalor E. National Stroke Audit: The Australian Experience. Clinical Audit. 2010;2:25–31.
26. Betteridge DJ, Belch J, Brown MM, et al. Guidelines on the management of secondary prophylaxis of vascular events in stable patients in primary care. Int J Clin Pract. 2004;58(2):153–168.
27. Burn JPS. Reliability of the modif ied rankin scale. Stroke. 1992;23(3):438.
28. Counsell C, Dennis M, McDowall M, Warlow C. Predicting outcome after acute and subacute stroke: development and validation of new prognostic models. Stroke. 2002;33(4):1041–1047.
29. Steinberg D, Phillip C. CART-Classification and Regression Trees. San Diego, CA: Salford Systems; 1997.
30. Ridley S, Jones S, Shahani A, Brampton W, Nielsen M, Rowan K. Classification trees. A possible method for iso-resource grouping in intensive care. Anaesthesia. 1998;53(9):833–840.
31. Lin LI. A concordance correlation coefficient to evaluate reproducibility.
Biometrics. 1989;45(1):255–268.
32. Holloway RG, Vickrey BG, Benesch C, Hinchey JA, Bieber J. Development of performance measures for acute ischemic stroke.
Stroke. 2001;32(9):2058–2074.
33. Heuschmann PU, Biegler MK, Busse O, et al. Development and implementation of evidence-based indicators for measuring quality of acute stroke care: the Quality Indicator Board of the German Stroke Registers Study Group (ADSR). Stroke. 2006;37(10):2573–2578. 34. Sandercock P, Counsell C, Gubitz GJ, Tseng MC. Antiplatelet therapy
for acute ischemic stroke. Cochrane Database Syst Rev. 2008;(3): CD000029.
35. Lingsma HF, Dippel DW, Hoeks SE, et al. Variation between hospitals in patient outcome after stroke is only partly explained by differences in quality of care: results from the Netherlands Stroke Survey. J Neurol
Neurosurg Psychiatry. 2008;79(8):888–894.
36. Asplund K, Hulter Asberg K, Norrving B, Stegmayr B, Terent A, Wester PO. Riks-stroke – a Swedish national quality register for stroke care. Cerebrovasc Dis. 2003;15 Suppl 1:5–7.
37. Reeves MJ, Arora S, Broderick JP, et al. Acute stroke care in the US: results from 4 pilot prototypes of the Paul Coverdell National Acute Stroke Registry. Stroke. 2005;36(6):1232–1240.
Clinical Audit downloaded from https://www.dovepress.com/ by 118.70.13.36 on 20-Aug-2020