ABSTRACT
CHRISTIAN, CAROLINE MARIA. The Development and Validation of a Visual-Spatial Chemistry Specific (VSCS) Assessment Tool. (Under the direction of Maria T. Oliver-Hoyo).
Visual-perceptual skills are often overlooked in chemistry classrooms despite
research showing a positive correlation between college students’ visual-perceptual abilities and problem-solving skills and negative correlations between visual-perceptual aptitudes and failure rates. Chemistry instructors are rarely formally trained in the nature of visual-spatial fields and may not be aware of its importance and relevance. Extensive research has been performed on general assessments intended to analyze students’ visual-perceptual abilities, yet these tests have not been combined into one easily administered and valid predictor of visual-perceptual ability for chemistry student. There has also been postulated a connection between success in chemistry and students’ ability to perceive molecules in different
representations. The Visual-Spatial Chemistry Specific Assessment tool has been developed to address these concerns based on a theoretical framework. Its validity has been examined with regards to content, concurrent, and construct validity. The VSCS has been
administrated to 816 students enrolled in general, organic, inorganic, and physical chemistry courses.
The Development and Validation of a Visual-Spatial Chemistry Specific (VSCS) Assessment Tool
by
Caroline M. Christian
A thesis submitted to the Graduate Faculty of North Carolina State University
In partial fulfillment of the Requirements for the degree of
Master of Science
Chemical Education
Raleigh, North Carolina February 25, 2009
APPROVED BY:
_______________________________ ______________________________
Maria T. Oliver-Hoyo Jerry Whitten
Committee Chair
________________________________ _______________________________
DEDICATION
I dedicate this work to the greatest teacher, mentor, and friend a person could ever
hope and ask for, my mother, Alicemae Christian. She was the person who taught me to love
education and reading by taking me to the library every weekend when I was a child, and it
was there that I first learned that it was possible for me to reach for the stars. She also taught
me how to think like a scientist, analytical and pragmatic, and taught me that if it isn’t your
best it’s not worth doing. As a mentor, my mother helped shaped me into the woman,
scientist, and educator I have become. When my mom was growing up, woman and scientist
were rarely ever heard in the same sentence together, but in spite of these barriers my mother
became a scientist. She was the person who taught me to go after my goals, no matter what
they may be. My mother has been supportive of all my dreams and she has also been
supportive in my failures. As a friend, my mother, has guided me, given me practical advice
(even when I didn’t want to hear it), and helped me on my own pathway to success.
Although my own path is not yet clear, I know that my mother will assist me in whatever
way she can. The most amazing thing about my mother is that she did all this for me as a
single parent, and she did it not once, but twice as she also raised my brother. She is also
helping in the growth and development of my niece and nephew as well. So this work is
BIOGRAPHY
Caroline Christian is an educator because she likes to make a positive difference in
students’ lives. She is a scientist because she is intrigued by the natural and physical world
and hopes to find truth in the world by studying chemistry. She loves chemistry because it is
in everything around us: everything we make has been influenced by a chemist, everything
we do is controlled by our bodies’ biochemical processes, and everything that is living or
nonliving has chemical properties.
She was born in Illinois on November 30, 1977, the second child to Bill and Alice
Christian. When she was seven years old, her parents divorced and she moved to a small
cottage next to a park. During these early years of her life she attended St. Andrews
Lutheran School in Park Ridge, Illinois. It was at this small, private school that she got her
early love of learning, teaching, and her good study habits. These habits have followed
Caroline her whole life, turning her into a lifelong student, always thirsty for new knowledge.
Peter, Caroline’s brother, got accepted to the University of South Florida when Caroline was
eleven, so this prompted the whole family to move to Florida. While in Florida, Caroline
developed her love for singing, singing in two duet and four solo competitions, five musicals,
countless ensemble and choir competitions, and even made it to three all-state invitationals.
She also found a new love in tenth grade, chemistry.
She attended Concordia University in River Forest, IL with a dream of becoming a
high school chemistry teacher, but she quickly changed her career focus and decided instead
to pursue college teaching. Caroline next went to the University of Illinois in
responsible for a twice weekly discussion section, and then a 4-day a week lecture section
where the students only saw her to teach them chemistry. Needless to say, Caroline loved
this interaction, and unfortunately her Ph.D. studies suffered for it. She decided to get a
Masters’ Degree in Chemical Biology after four years of doing biophysical chemical research
on a pathogenic bacterium – Vibrio Cholera. Then another teaching opportunity opened up
for Caroline – a Masters’ degree in Education, where Caroline would be certified to teach
middle and high school science. Caroline’s love for teaching lead her to complete this
program in May of 2005, and graduate with two Masters’ degrees from the number six
school in the country for chemistry programs.
Then another schooling opportunity opened up for Caroline, to pursue her dream of
becoming a college chemistry instructor somewhere warmer, at North Carolina State
University in Raleigh, NC. When she arrived, she came just as she had done three previous
times in her life, with a chance to reinvent herself with no one who knew her, and
unfortunately, no plans for any chemical education research. After about a year and a half of
searching, she finally found a project that suited her – development of a Visual-Spatial
Chemistry Specific assessment tool. Here she has found her place, where she wakes up
every morning enthusiastic for the day to begin, yearning to go to work, and willing to learn
new things. Caroline will be receiving her third Masters’ degree with the completion of this
thesis and its defense, and she is excited to start on the next phase of her life where she hopes
to get a job with a school board developing assessments.
ACKNOWLEDGMENTS
I would like to acknowledge the help of my mentor, Maria T. Oliver-Hoyo, for
helping me understand this topic, decide upon an assessment framework, listening to me at
numerous group meetings, and helping me to revise pages and pages of text. She has been a
generous and wonderful mentor, advisor, and friend. I would also like to acknowledge the
help of the professors that have implemented the assessment in their classrooms, and the
members of my committee, Dr. Jones, Dr. Ghiladi, and Dr. Whitten.
I would also like to thank the present and past members of my research group for
listening to my group meetings, and giving me advice on how to make my research stronger.
A big advantage of my research study is the use of statistical consultants at North
Carolina State University. I would like to acknowledge all the help that I received from the
consultants: Dr. Brian Reich, Q Burkhart, Danny Modlin, Muhtar Osman, but especially
Stacey Wood. With her help the statistics in this thesis are much more clearly explained.
I would also like to thank the people in my life that made these last three and a half
years the best years of my life. All my “school” friends: Laura, Deborah, Rich, Rachel,
Steven, and others, all my “old” friends: Aimee, and Diana, all of my church, movie, and
choir friends, but especially all of the students with whom I have interacted.
I would also like to acknowledge the help of my soul mate and one true best friend,
Patrick Sloan, who helped me with the visualization and editing process of this thesis.
Finally, where would I be without the one constant force in my life, pushing me to do
right, to be a better person, and to find my hour of peace a week, Dear Lord, thank you for
TABLE OF CONTENTS
LIST OF TABLES………...………….vii
LIST OF FIGURES………...………ix
1. Introduction……….………...1
1.1 References………...……….5
2. Literature review ………...…..………..……7
2.1 Theoretical frameworks……..……….……7
2.2 Visual-Spatial Tests/Assessments….……….………....14
2.2.1 General Visual-Spatial Assessments………...…15
2.2.2 Chemistry Visual-Spatial Assessments………...19
2.2.3 Assessments for other science disciplines………...24
2.3 Validation of published tools………..26
2.4 References………...29
3. Methodology ………34
3.1 Research Design………..34
3.2 Research Questions……….35
3.3 Implementation……….…………...36
3.4 Data Analyses……….………….37
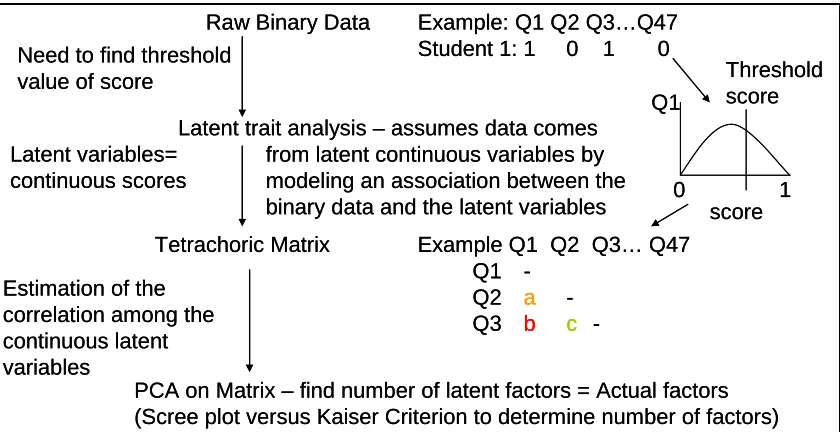
3.4.1 Construct validity: Factor Analysis………..…37
3.4.2 Extracting number of principal components………...…..39
3.4.3 Reliability test……….…..40
3.4.5 Concurrent Validity test………..…42
3.4.6 Sources of variation……….…...43
3.5 References………..44
4. The Instrument: Visual-Spatial Chemistry Specific (VSCS) Assessment Tool…...……...46
4.1 References………..………....62
5. Results……….……63
5.1 Concurrent Validity………...…63
5.2 Construct Validity………..…64
5.3 Reliability……….…..70
5.4 Possible interventions………….………...71
5.5 Differences among students………...…..72
5.6 References………...77
6. Conclusions and Future Work……….…78
6.1 Validity……….….78
6.2 Drawbacks to testing format……….….79
6.3 Other student differences………...80
6.4 Essential visual-perceptual skills………...82
6.5 References………..83
7. Appendix...………....86
LIST OF TABLES
Table 1.1 Definitions of eight theoretical visual-perceptual skills proposed for chemistry…..3
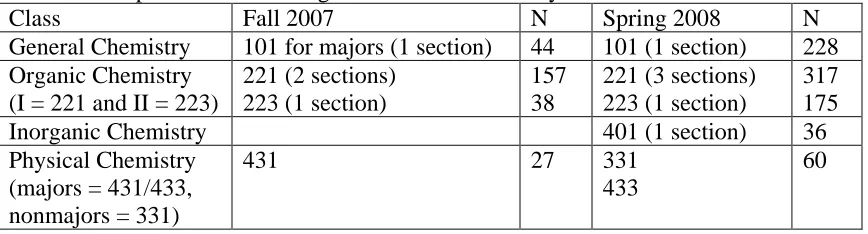
Table 3.1: Courses and number of students involved in Visual-Spatial Chemistry Specific
assessment implementation during the 2007/2008 school year………...…35
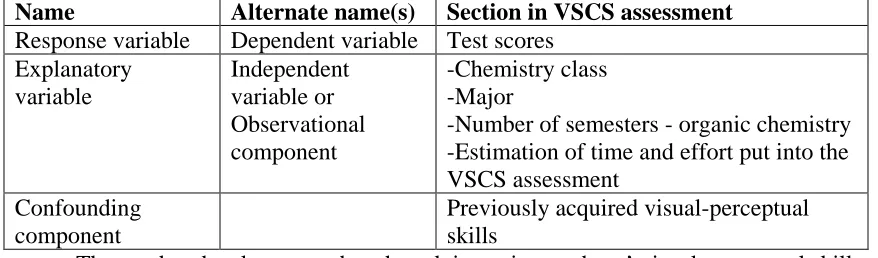
Table 3.2: Variation components and variables for the Visual-Spatial Chemistry Specific
assessment...43
Table 4.1: Summary of questions, skills assessed, and what the students are asked to do…..46
Table 4.2: Sulfur (white) ions in visual sequencing figure and their order………...56
Table 5.1: Factor number and its associated eigenvalue, the proportion of variance it
describes and the cumulative variance……….……....65
Table 5.2: Factor loading correlations of the one factor from the Principal Component
Analysis on the 47 questions of the VSCS assessment...………...68
Table 5.3: Factor numbers and their factor loadings that are above the cutoff value of 0.3 for
the 47 questions on the VSCS assessment tool………69
Table 5.4: p-values about correlations between student score and categorical and opinion
questions………...………...74
Table 5.5: Number of students taking the Visual-Spatial Chemistry Specific assessment, their
mean score, and standard deviation...74
Table 5.6: Differences in student score per class, expressed as p-values…………..……….75
Table 5.7: Percentages of different majors from seven different chemistry classes from the
Table 5.8: Raw mean scores and the comparison of those scores with the associated
LIST OF FIGURES
Figure 2.1: Hierarchical stages of visual learning………..………...9
Figure 2.2: Example question from the Shepard and Metlzer test……...………...16
Figure 2.3: Example question from the Cube Comparison test…………...………17
Figure 2.4: Example question from the Surface Development test…………..………...17
Figure 2.5: Example question from the Embedded Figures test………..………18
Figure 2.6: A diagram of the four depth cues in an octahedral molecule……..…...………...20
Figure 3.1: Statistics flowchart of the PCA done on the Visual-Spatial Chemistry Specific assessment...39
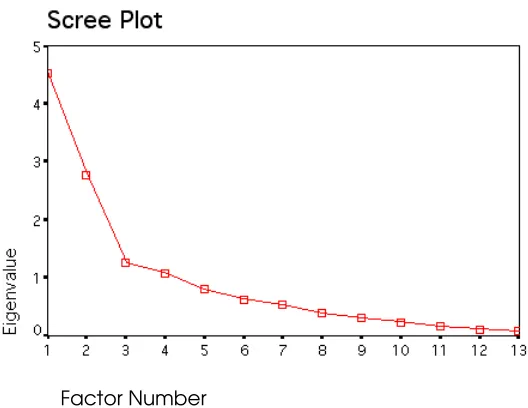
Figure 3.2: An example of a scree plot……….………...40
Figure 4.1: Example question from the visual discrimination skill set…….………...47
Figure 4.2: Example question from the visual figure ground skill set……….………....49
Figure 4.3: Example question from the visual orientation (rotation) skill set…….…………51
Figure 4.4: Example question from the visual orientation (reflection) skill set………….….53
Figure 4.5: Example question from the visual form perception skill set……….……...54
Figure 4.6: Example question from the visual sequencing skill set……….…………...55
Figure 4.7: Example question from the visual memory skill set……….57
Figure 4.8: Example question from the visual constancy skill set………..….59
Figure 4.9: Example question from the visual association skill set……….61
Figure 5.1: Scree plot from Spring 2008 data………...66
Chapter 1. Introduction:
Chemistry is a subject that requires its practitioners to think in the macroscopic,
microscopic, and symbolic realms.1 Macroscopic includes what can be seen with the naked eye, while microscopic encompasses the particulate nature of matter. The symbolic realm
entails the equations and mathematics used in chemistry. Embedded in all three realms are
visual-perceptual skills, which are defined as the skills being involved in forming mental
images of visual objects. However, visual-perceptual skills are often overlooked in
chemistry classrooms and chemistry instructors are rarely trained or aware of the relevance
of visual-perceptual skills in chemistry. It should be noted that there is a pedagogical
difference in this thesis’ two main terms: visual-spatial and visual perceptual skills.
Visual-spatial skills refer to the ability to observe relations of objects in space. Chemistry students
need visual perceptual skills because before they can see the relation of an object in space
(visual-spatial skills), they first need to cognitively form a mental image of that object
(visual-perceptual skills). Only after students grasp what the object looks like in
three-dimensions are they able to compare other objects to it. Visual-spatial is only referred from
now on by its connection with the tests and assessments used to measure these types of skills.
Visual-perceptual skills dictate the necessity of visual-spatial assessments in order to test
them.
Visual-perceptual skills are important to scientists, especially chemists, because of the
spatial nature of representations of molecules. Molecules, atoms, and the ways they interact
experimental research and data. The three most common ways to represent molecules are
space-filling, ball and stick, and line drawings. Space filling models show more accurately
what the atoms look like in the molecule by representing their electron clouds according to
modern quantum theory. Ball and stick models show how the atoms are connected together
with balls representing the atoms, and sticks representing the bonds between atoms. Line
drawings are the most simplified way to represent molecules, and often the most confusing to
chemistry students.2 In line drawings, lines represent carbon to carbon bonds, and students must interpret what the molecule looks like in three-dimensions from a two-dimensional stick
drawing in order to understand the structure-function relationship of the molecule.
Visual-perceptual skills make understanding the different representations of chemistry molecules an
achievable goal.
Eight theoretical visual-perceptual skills have been proposed as important for
chemistry students to have.3 They are: visual association, visual constancy, visual discrimination, visual figure-ground, visual form perception, visual memory, visual
orientation, and visual sequencing. Their definitions are listed in Table 1.1. Published
visual-spatial tests generally test only one type of visual-perceptual skill, visual orientation,
which is basically the ability to rotate three-dimensional objects that are represented in
two-dimensions.4 The eight visual-perceptual skills have only been theorized about, and have never been tested before. The main goal of this research is to develop and validate a
visual-spatial assessment that includes these eight visual-perceptual skills for its use in college
chemistry classrooms. Ultimately this assessment may be used to screen students’
Table 1.1: Definitions of theoretical visual-perceptual skills proposed for chemistry3 Visual-perceptual skill Definition (Ability to)
Visual association relate concepts written as text to their representation in pictures
Visual constancy see diagrams of objects that are the same size, shape, or color from others that are not
Visual discrimination perceive dominant features in objects and to discriminate one object from another
Visual figure ground distinguish objects from their background
Visual form perception represent in two- or three-dimensions objects that are three-dimensional
Visual memory recollect the dominant features of a diagram
Visual orientation rotate the positions of objects in space in relation to other objects and the observer
Visual sequencing see objects in a particular order
The foundation of this theory is a compilation of case studies of students assessed as
having average intelligence and who exhibited one or more learning deficits.3 Examples of these deficits include: motor-memory dysfunction, reversals, insertions, deletions, errors in
visual perception and interpretation. The visual-perceptual theoretical framework that this
visual-spatial assessment is based on was first hypothesized as being important for
engineering, astronomy, and anatomy students.5 The researchers hypothesized that students who lack specific cognitive or visual perceptual learning abilities may fail courses in their
academic careers. The study concludes that students who have these difficulties overcome
them by compensating with their strengths, such as a student who has a visual input disorder
supplementing with an auditory input. They also advocated helping these students, “By
clearly identifying the underlying componential perceptual and visual skills essential for
mastery, the need to overcome the students’ deficiencies as quickly as possible may be
The development of a chemistry specific assessment of these eight visual-perceptual
skills started by identifying test questions from various sources,6, 7, 8, 9 evaluating those questions to ensure that they tested visual-perceptual skills, and aligning them to the
theoretical framework of visual-perceptual skills. (See Chapter 4.) Only those questions
with relevant chemistry content were used. Testing conditions considered included length of
test, number and difficulty of questions, clear and understandable wording of questions, and
ordering of questions from easiest to hardest within the specific categories. The
Visual-Spatial Chemistry Specific (VSCS) assessment is intended to test all eight visual-perceptual
skills by asking spatial ability questions to different levels of chemistry undergraduates.
An important goal of an assessment such as this is to verify its validity. According to
Fink, there are four different types of validity for an assessment tool; content, construct,
predictive, and concurrent validity.10 Content validity refers to how the VSCS assessment thoroughly and appropriately assesses the visual-perceptual skills it is intended to measure.
Researchers often maximize the content validity by testing students using a specific
theoretical framework. In this case the visual-perceptual framework from Rochford’s work
was used to select items for the visual-spatial assessment.3 Construct validity is related to how correlated the assessment is to the visual-perceptual framework that is being tested.
Predictive validity refers to the extent to which the assessment measures future performance.
Concurrent validity may be demonstrated when two assessments agree, and the Purdue
Rotation of Visualization Test was chosen since this assessment tool also measures visual
The purpose of the VSCS tool is to test college students’ visual-perceptual skills by
conveying visual-spatial questions in the context of chemistry molecules. The purpose of
this research is to develop and validate this visual-spatial assessment tool that college
chemistry students and instructors can use to evaluate visual-perceptual skills.
1.1 References:
1. Johnstone, A. H. (1993) The Development of Chemistry Teaching A Changing Response to Changing Demand. Journal of Chemical Education, 70, 9, 701-705.
2. Ferk, V., Vrtacnik, M., Blejec, A., Gril, A. (2003) Students’ understanding of
molecular structure representations. International Journal of Science Education, 25, 10, 1227-1245.
3. Rochford, K., Archer, M. A. (1991) Academic underachievement and cognitive learning disabilities: 10 case studies. SAJHE/SATHO, 5, 2, 52-73.
4. Bodner, G. M, and Guay, R. B. (1997) The Purdue Visualization of Rotations Test. The Chemical Educator, 4, 2.
5. Rochford, K. (1993) Visual Perceptual Deficits Among Electrical Engineering, Science and Technical Students; A Theoretical Analysis, in An Aptitude Test and Associated Research on Basic Electrical Circuits edited by Zenon J. Pudlowski, 93-106. Quote on page 104.
6. Rochford, K, Irving, A. (1989) Academic Underachievement and Spatial
Visualization Problems of University Chemistry Students. Teaching Method Unit, 12 (1), Test – Visualization of Pictures of Molecular Structures (VMPS).
7. Seddon, G. M., Tariq, R. H., Dos Santos Veiga, J. (1982) The visualization of spatial transformations in diagrams of molecular structures. European Journal of Science Education, 4, 409-420.
9. Barke, H.D. (1993) Chemistry education and spatial ability. Journal of Chemical Education, 70, 12, 968-971.
Chapter 2. Literature Review:
Although there are a considerable number of research studies and papers that describe
spatial ability, this review will concentrate on visual-spatial tests and visual-perceptual skills,
which are skills required to produce a mental reproduction of an image. This literature
review has three main sections:
• Theoretical Frameworks – discussing the frameworks that have shaped this and
others’ work in the field.
• Visual-Spatial Tests/Assessments – discussing the past and present tools that have
been developed to assess these skills.
• Validation of the Tools – discussing the procedures and means used to validate
visual-spatial assessments.
All the research studies discussed in this review have been performed with college students,
unless otherwise stated. The three sections in the literature review will follow a
chronological order.
2.1 Theoretical frameworks:
Theories regarding the teaching of chemistry that tie into visual-perceptual skills
began with Johnstone’s theory of the three realms of chemistry: macroscopic, microscopic,
and symbolic.1 In this researcher’s view, to comprehend chemistry a student must first be able to recognize a molecule, combine it with other molecules to form chemicals, and break
the molecules down to form atoms. All of these processes require that students form mental
pictures of these concepts. Macroscopic chemistry processes utilize visual-perceptual skills
grasp for most students, microscopic chemistry requires the student to form mental images of
modeled structures prior to understanding the chemistry involved.1 Symbolic chemistry’s connection with visual-perceptual skills comes from the hypothesis that the initial step to
solve a problem is to visualize the steps involved.2
Dual Coding theory explains human behavior and performance by invoking
educational theory and looking at three realms: education, affective skills, and
perceptual-motor processes.3 Some researchers have used Dual Coding theory as a theoretical framework for their visual-spatial research.4, 5 According to this theory, which was first published in 1986, there are two important systems required to teach: nonverbal imagery or
imagens, and verbal linguistic or logogens.3 Both of these systems are separate yet
interconnected because they are both used to explain the senses; however both of the systems
are different in internal structure because they are describing two parts of one whole. One
system can trigger activity in the other, but the pathways are usually incomplete which is
why it is imperative to teach with both systems especially in chemistry classrooms.
Chemistry is a particularly visual subject and, for example in organic chemistry, visual
representations of hydrocarbons and other molecules are used interchangeably with verbal
descriptions of them. If the pathways in human performance are incomplete in regards to
their verbal and nonverbal systems, then teachers must make these connections explicit for
students.
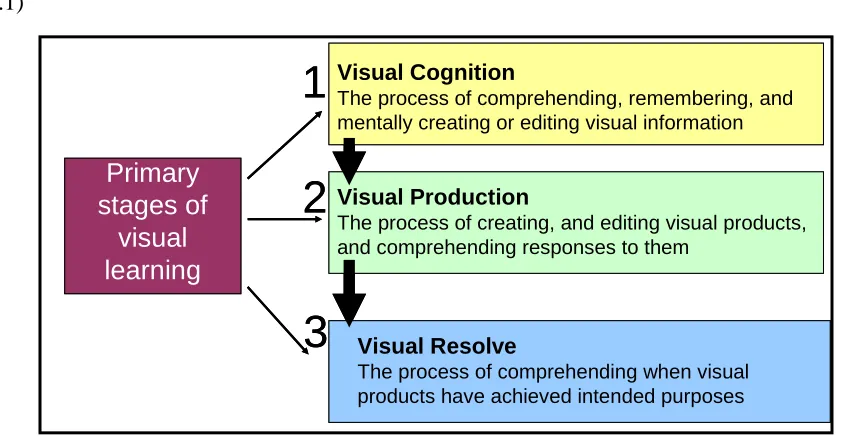
Wiley’s Hierarchy of Visual Learning, published in 1990, focused on college
pass through while on their way to visual maturity. The three stages of primary visual
learning are visual cognition or perceiving a visual image, visual production or creating a
visual object and visual resolve or comprehending the purpose of a visual object. (See Figure
2.1)
Visual Cognition
The process of comprehending, remembering, and mentally creating or editing visual information
Visual Production
The process of creating, and editing visual products, and comprehending responses to them
Visual Resolve
The process of comprehending when visual products have achieved intended purposes
1
2
3
Primary
stages of
visual
learning
Visual CognitionThe process of comprehending, remembering, and mentally creating or editing visual information
Visual Production
The process of creating, and editing visual products, and comprehending responses to them
Visual Resolve
The process of comprehending when visual products have achieved intended purposes
1
2
3
Primary
stages of
visual
learning
Figure 2.1: Hierarchical stages of visual learning6
The first stage, visual cognition, is involved in forming mental images of visual
objects; this is the definition of visual-perceptual skills. According to this theory, the other
two stages of visual learning cannot be achieved by students until they attain adequate
visual-perceptual skills. Piaget assigned children ages to specific cognitive stages, 7 and although Wiley did not specify such age ranges, he talks about the engineering graphics community
lack of focus on the visual skills of college students. The hierarchy of visual learning by
college graphic engineering students concentrates on the difficulties that college students
could have while developing their visual maturity and it also represents the kinds of problems
concluded that students who are not in the advanced levels of this hierarchy will not be
successful in engineering graphics classes. This paper also points out that researchers have
developed new and recycled old terms to describe visual-perceptual skills such as spatial
cognition and spatial visualization, 6 although in this thesis the terms visual-spatial and visual-perceptual will be defined consistently throughout.
Rochford theorized that there were eight important visual-perceptual skills needed to
succeed in science and engineering classes.8 The visual-perceptual framework was proposed by Rochford after looking at case studies of above average intelligence students who were
poor visualizers. These case studies showed that the students were having trouble with
various aspects of visualization, such as discrimination or orientation skills. The researchers
theorized that students may fail subjects such as engineering, astronomy, and anatomy if they
lack these specific visual-perceptual abilities. It is argued in this thesis that these same skills
are necessary for college chemistry students to succeed as well.
Visual-perceptual skills have two different components that are regularly tested,
analytic versus holistic skills.9 Analytic skills are defined as those being utilized when solving visual-spatial questions via logical means. An analogy to the use of analytic skills is
like looking at landmarks in order to arrive at a destination. The students are basically
dividing the objects into pieces and then altering parts of the object to find the correct
answer. Holistic skills on the other hand are used when an individual studies the entire
figure, and transcribes it in their mind by looking at the whole object. An analogy for using
holistic skills is looking at a map to understand where one is going, encompassing the entire
visual-spatial assessments since they are represented by looking at the full object, forming a mental
picture of it, and then comparing it to the other objects.9
Another theory that emphasizes visual-perceptual skills when solving visual-spatial
questions is the Schema Theory of Cognitive Structures.10 Schema may be defined as a personal scientific pattern imposed on an experience to assist in explaining it. Students can
solve chemistry problems by activating an appropriate schema such as an equation that will
help students find the correct answer. Although equations and algorithms may be the easiest
way to solve problems in some cases, they usually do not lead to understanding what the
question is asking.2 The Schema Theory encourages students to use different representations when solving chemistry problems, which in turn may help them answer the question. It has
been found that performance on problem solving tasks increases when high school students
use drawings or are shown drawings about chemistry questions.10 They also found that students’ ability to switch from one representation to another in an organic chemistry
classroom is the main difference between students who are successful and students who are
not.10 A representation can be a drawing of a molecule, a verbal description of a molecule, or the molecule’s formula. The results of this study led researchers to believe that the cause of
these students’ ability comes from thinking of chemical systems in terms of the microscopic
nature of matter.10
Recent research in this field has mainly focused on the development of computer
simulations and programs aimed at improving students’ visual-perceptual skills, while giving
interpret chemical representations, provide equivalent representations for a given
representation, or make transformations from 2-D to 3-D representations. In their study they
state that with improved visual-perceptual skills all these conceptual mistakes can be
corrected. They used a computer visualizing tool, eChem, to help students develop their
understanding of chemical representations. eChem provides three different ways a student
can interact with the program: “construct” lets students build covalent compounds,
“visualize” lets students see multiple representations of molecules from different angles, and
“analyze” lets students experience the connections between the microscopic (molecular
structures) and the macroscopic realms (collective physical behaviors). They found that,
“Students who were highly engaged in discussions while using eChem made referential
linkages between visual and conceptual aspects of representations. The findings also suggest
that computerized models can serve as a vehicle for students to generate mental images…”.4 Electrochemistry is a cognitively complex topic, and visual computer animations
were employed by Greenbowe to help chemistry students understand electrochemistry.5 These animations not only show the math behind calculating electrochemical potentials, but
also use animations to illustrate what is happening inside a flashlight and its battery. In this
study, two groups of students were used: one was given computer graphics animations
representing electron and ion movement in batteries, while the other group was shown static
pictures of the same concepts. All the students were given a diagnostic test to assess the
students’ chemistry knowledge before they started the class, a knowledge pretest and
posttest, and a visual-spatial assessment - the Purdue Rotation of Visualization Test (ROT).
different rotations, surmise the rotation between them, and make the same rotation with
another three-dimensional solid object to choose which object has the same rotational pattern
from among five different choices.10, 12 This test assesses the visual orientation skill set, which is defined as rotating the positions of objects in space in relation to other objects and
the observer. On a transfer post-test students who saw the animations did better on it, as well
as the students with higher scores on the Purdue ROT. This research study strongly suggests
a need for further research on the connections between spatial ability and computer
animations.
Problem solving skills have been shown to be highly correlated with
visual-perceptual skills.11 For example in 2003, Wu’s literature review12 comprised studies that correlated spatial abilities and chemistry problem solving,2, 5 literature that identified student’s conceptual mistakes and struggles understanding visual representations,13, 14 and research in how to design visualization tools to transfer knowledge into different visual
representations.4, 15 (The visualization tools covered were only computer animation systems, not assessment tools.) The results of Wu’s literature review reflected that students’
conceptual errors in chemistry are due to difficulties in working in different visual-spatial
representations, for example translating a chemical formula into its molecular structure.
They suggested five principles for designing chemistry classroom visualization tools: “(1)
providing multiple representations and descriptions, (2) making linked referential
connections visible, (3) presenting the dynamic and interactive nature of chemistry, (4)
promoting the transformation between 2D and 3D, and (5) reducing cognitive load, making
some argument whether or not the conceptual errors identified in Wu’s literature review arise
from a lack of higher order formal thought or from a lack of visual-perceptual skills.16 Research is vital to determine whether achievement in chemistry is due to increased formal
thought ability, increased visual-perceptual ability, or a combination of the two.
Most theories of visual versus verbal learners consider only one type of visual learner
(such as the Dual Coding theory). This unitary theory of visual learning was rejected in 2006
by Blanjenkova et al17 when they developed a new self-reporting instrument, the Object-Spatial Imagery Questionnaire (OSIQ). This group supports a dual theory of visual learners:
object imagers or individuals who prefer processing colorful and pictorial images and spatial
imagers or people who prefer processing schematic and spatial relationships. Object imagers
utilize primarily holistic skills as they prefer viewing high-resolution objects while spatial
imagers utilize primarily analytic skills as they prefer to encode objects part by part. Visual
artists would most likely be object imagers, while scientists would most likely be spatial
imagers. The researchers found that the OSIQ discriminates between object and spatial
imagers.
2.2 Visual-Spatial Assessments/tests:
Different theoretical frameworks have spawned different types of assessments to test
chemistry students’ visual-perceptual skills, 18, 19, 20, 21 including those that use general diagrams and are therefore not related to science fields, but have been used in chemistry
coined the term factor analysis to determine the primary factors involved in the different
mental capabilities. He also ran the first factor analysis to determine what the essential skills
were, by giving 240 volunteers 56 different general visual-spatial assessments. Factor
analysis is a data reduction technique used when a large number of variables are observed
and the goal is to reduce these variables to a smaller number of latent (unobserved) factors.
Thurstone hypothesized two such factors; the first was the skill to see in 2-dimensions, and
the second the skill to see in the 3-dimensions. He tested both of these skills with a number
of visual-spatial assessments and concluded that although they were considered separate
categories tentatively for visualizing in flat and solid space, the analysis did not show a
division.22 Since then, others have published general tests and guidelines for assessing these types of skills, 10, 18, 19, 20 and others have used factor analysis to find various important features about the visual-perceptual skills they are testing.21, 23, 24
2.2.1 General visual-spatial assessments:
A general visual-spatial test based on assessment questions developed by Shepard and
Metzler25 was created by Vandenberg and Kuse.26 The Shepard and Metzler test asked people to just look at two different rotations of block figures (two dimensional drawing of a three
dimensional figure) to find out if the blocks were the same or different.25 This study tested if the response time would increase when increasing the angle of rotation between the two
figures. (See Figure 2.2) The results showed an increased response time, in fact a linear
increase. Vandenberg and Kuse made a paper-and-pencil type test using the same type of
Rochford's framework, which are defined as recollecting the dominant features of a diagram.
The test presents one reference figure with four others rotated in different directions, and the
goal is to find the two that are the same as the reference figure. Most of the incorrect
answers are mirror images of the reference figure. They gave the test to elementary school
children, and they claim that it may be useful in studies of spatial ability development.
Figure 2.2: Example question from the Shepard and Metzler test25
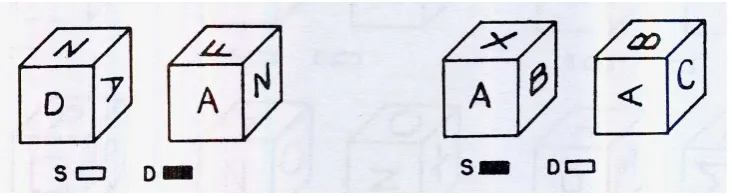
Psychologists studied another set of achievement tests using factor analysis and
showed that there are at least ten different achievement factors for students to master before
they leave school.30 Two of the achievement factors have counterparts in the eight visual-perceptual skills highlighted in this thesis. The first achievement factor is spatial orientation
which is related to visual orientation skills, or the ability to rotate positions of objects in
space in relation to other objects and the observer. Spatial orientation is defined as
“perception of position and configuration of objects in space, perhaps best thought of as
space with the observer himself as a reference point”.30 An example of a spatial orientation question from the Cube Comparison test shows a picture of two six-sided cubes, with only
three sides visible to decide if the cubes are the same or different (See Figure 2.3). The
the cube and form a mental picture of it, to see if it matches with the other cube in a set
amount of time.
Figure 2.3: Example question from the Cube Comparison test
The second factor identified is the visualization factor, which corresponds to the
discrimination skill, or the ability to perceive dominant features in objects and to discriminate
one object from another. Visualization factor is described as “the ability to manipulate or
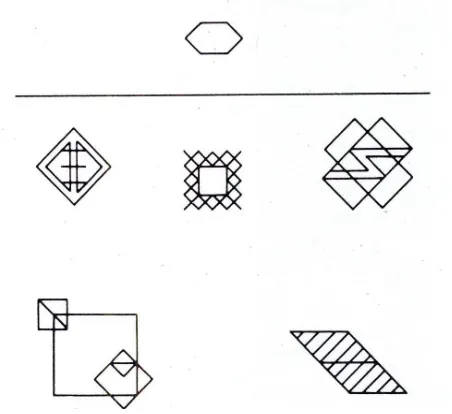
transform the image of spatial patterns into other visual arrangements”.30 An example of a test of this sort is the Surface Development test. An example question in this test is a picture
of a two-dimensional piece of paper cut so that it can be folded into the three-dimensional
object given. One is required to match the folds on the piece of paper with the edges on the
three-dimensional object (See Figure 2.4). This test has been used in intelligence and career
assessments.31
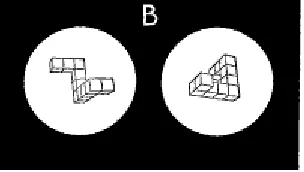
The Embedded Figures test was first developed for military purposes, 28 and it differentiates between field independence and dependence, or analytic versus holistic
thinkers. A holistic thinker likes to look at the whole picture first, while an analytic thinker
likes to break things up into parts. Students who have a field independence cognitive
learning ability (analytic thinkers) tend to perform better on this test. An example test
question is featured in Figure 2.5 where the students are given a simple shape and asked to
identify the shape in different patterns.29 A form of the Embedded Figures test was developed by Witkin in 1977, 27 and it has also been used in science classrooms to test the embedding ability of field dependence/independence.2
Figure 2.5: Example question from the Embedded Figures test
Children observed to have difficulties with the visual-spatial realm of learning were
developed and published for children with these types of disorders as well.33 A nonverbal learning disability is more severe than not being able to solve visual-spatial questions.
Children who have these disorders have motor and social problems along with visual-spatial
problems but they have very strong verbal skills and usually memorize well.32 The
assessments rely on the strengths of the students, by asking them to remember the position of
objects in a grid, giving a blank grid, and asking the students to recall the location of the
objects.33 These assessments used to test children are simpler than the questions described in this thesis, although they can be made more challenging by adding more spaces on the grid
and more objects to the assessment.
2.2.2 Chemistry assessments:
Organic chemistry is a strongly visual-spatial dependent field because of its inherent
nature to draw molecules as simplified representations of their true form. Therefore, students
with visual-spatial handicaps tend to find organic chemistry very challenging.34 One research study used specific training sessions employing three-dimensional molecular models. This
research found that the students who received this specialized training improved their
performance in a college-level general chemistry course.34 Another research study published ten years later, used specific training conditions for their experimental group that emphasized
the development of visual-spatial skills by giving students workbooks that demonstrated
visualization skills.35 This study showed that students who received this special training scored significantly higher on exams that included questions using three-dimensional models
than the control group who received the same amount of training on nomenclature of
There have been a number of visual-spatial assessments developed especially for
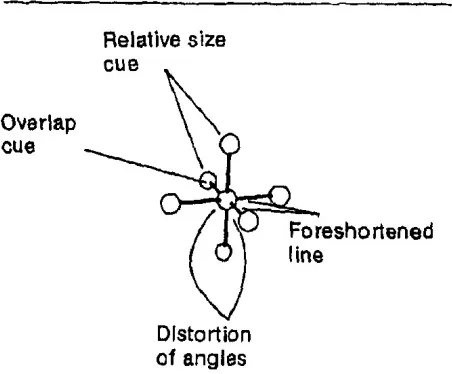
chemistry students. One of these tests is the Depth Cues assessment by Seddon et al.36, 37, 24 There are four different depth cues as illustrated in Figure 2.6: relative size cue, or the size of
the atoms with respect to one another; overlap cue, or the amount of overlap that happens
between the ball (atom) and stick (bond); foreshortened line cue, or the lengths of the bonds;
and distortion of angles cue, or the angle variation that happens in the molecular structure.
Figure 2.6: A diagram of the four depth cues in an octahedral molecule
The Depth Cues assessment has ten questions for each of the four depth cues, and it tests
students’ ability to look at the model from the correct viewpoint, and choose which one of
the diagrams is the best representation.38, 39 They used both photographs and drawings of the molecules and found that the students performed about the same with either representation.38 Additionally, these studies showed that high school and college aged students regularly
missed questions concerning the relative size of objects and the foreshortening of straight
Seddon also developed the Molecular Rotation, Reflection and Inversion tests that
assess visual orientation skills.36, 40, 24 These tests are intended to identify high school students from different cultures who were spatially prepared. The Molecular Rotation test
had thirty different questions, with ten different molecules around three different axes of
rotation, and Molecular Reflection test had twenty-six reflection questions. In one study
Seddon showed molecules rotating in successive steps using an overhead projector and found
that with this type of visual aid students understood better if the diagrams were in color.
Interestingly enough the results also illustrated that there was a limit to the amount of colors
that should be shown.24 Additionally, results pointed to the fact that to rotate correctly in the X- and Y- axes depth cues are needed, but in the Z-axis no depth cues are needed to solve the
problem.40
Although all the previous chemistry assessments mentioned up to this point have only
tested visual orientation skills, there have been others who published test questions that this
researcher believes test the additional visual-perceptual skill categories. Rochford et al.
wrote the Visualization of Molecular Pictorial Structures assessment tool with questions that
were not associated to any of the visual-perceptual skills, but could be used to test these
skills.41 Rochford correlated students’ scores on this visual-spatial assessment with achievement rates of chemistry students. He found that there was a positive correlation,
meaning that students who did not do well on this assessment would underachieve
significantly in college chemistry courses. Rochford, however, never related the
eight visual-perceptual skills.8 This critique of their research methodology is a weakness that this research aims to address.
Tuckey’s research study looked at the steps involved in solving a rotation type
problem and found that at the university level, students still have problems with rotating a
molecule around an axis.14 The study broke down the skills necessary to solve a visual orientation problem into six elementary steps which include: 1) visualizing the molecule on
the paper, 2) recognizing the axis, 3) recognizing the molecule in reference to the axis, 4)
visualizing three dimensions, 5) drawing the structure, and 6) picking the correct answer by
comparing the possible choices. They developed an assessment that tested the six elementary
steps and a short two hour intervention program where they basically went over the steps
necessary to solve this type of problem. The experimental group did statistically better on
the posttest than the control group did. The study concludes that the university students had
troubles with their visual-perceptual skills, and that these problems were corrected with a
short intervention that covered these simple steps. “It is therefore recommended that student
competence in the basic concepts and skills required for three-dimensional thinking be tested
and any shortcomings rectified”.14
The Space Test42, 43 provides test questions that fit with the visual association skill set, which are relating concepts that are in words and pictures. These test questions utilized
pictures of unit cells and asked students to count, infer, and deduce how many different
training to both genders using molecular models. Their results showed that when girls were
given molecular models they scored as well as the boys on their spatial ability test.42 General visual-spatial tests have also been employed in more recent research studies
looking at chemistry students’ visual-perceptual skills.9 One such test is the Purdue Rotation of Visualization Test, and although this test has been reported before it was described most
clearly in 1997.9 The Purdue ROT has been used in chemistry classrooms, but it was not designed specifically for chemistry students. With this test visual-perceptual skills have been
shown to be positively correlated to chemistry students’ problem solving skills.2 They postulate this is because one of the first steps in solving a chemistry problem is visualizing
the chemical compounds, goals, steps, and mathematical process. They determined this by
giving students the Purdue Rotation of Visualization Test at the beginning of the semester,
and then statistically correlating various grades received on various assignments, tests, and
final exams to this visual-spatial test score. Results showed that the grades received on
problem solving activities were positively correlated with the visual-spatial test score. This
implies that visual-perceptual skills are important for students to use when solving chemistry
problems.
Savec et al. updated Seddon’s Molecular Rotation and Reflection test questions, and
used computer technology to let high school and college students manipulate the molecules
before making their selections.44, 20 The study looked at which of six molecular
representations students used to solve increasingly complex problems: 3-dimensional model
in box, photo of the 3-dimensional model, computer generated model, colored schematic
stereochemical formula.44 Results of their research indicate that the correct perception of the 3D molecular structure is crucial for all further intellectual operations. Students’ scores on
this assessment tool decreased significantly when the task became more complex even
though the students used the same representation of the molecules. When the task used
several mental processes, the score was even lower. They concluded that in chemistry
education close attention must be paid to how complex the task of rotation is, the students’
age and mental ability, and the type of representation given for the molecule.44 The second study by the same researchers tested how different molecular representations, either a
computer representation or a physical model, would help chemistry students.20 They found that the computer representations are a bridge between 3-D molecular representations and
2-D representations, and that the physical models, virtual representations, and a combination of
both types, are equally useful to students in supporting perception of the molecular structure.
2.2.3 Assessments for other science disciplines:
Blade and Watson showed that students in the engineering field developed their
visual-spatial abilities even during their first year of studies.45 In another study by Rochford first year engineering students were given a series of tests such as the Geometric Battery
Test, which included several different assessments such as the Surface Development test
described above, and Engineering Drawing tests.46 They found that offering remedial attention to the students who fail the visual-spatial exams increased their retention in the
program. It was recommended that a visual-spatial exam be the key in identifying students
Rochford’s anatomy test included pictures of an organ drawn incompletely where
medical students had to analyze the drawing to identify the organ.47 In this research study the scores received on this specialized anatomy visual-spatial test were highly correlated with
scores on other classroom assessments, such as the Geometric Battery Test. Students who
did not do well on this specialized anatomy visual-spatial assessment were more likely to
drop out of medical school.47 The researchers postulate this is because anatomy and other science subjects are highly visual subjects.48 Students were given this specialized visual spatial test at various times throughout their college and medical school careers. They found
that visual-spatial scores were negatively correlated with the failure rates of the students.47 This means that students who did poorly on the visual-spatial assessments were more likely
to fail these science classes, and ultimately drop out of medical school.
In 1998 Rochford conducted a study to assess astronomy students’ visual-perceptual
skills as well, by correlating scores on regular astronomy exams to a specific astronomy
visual-spatial assessment.49 The astronomy visual-spatial assessment scores were used to divide the students into visually able and visually deficient groups. The visually able group
of students were more likely to pass the astronomy exams and hence the class.
A content based geospatial examination was developed and tested on geology
students to see whether their skills would increase after training using QuickTime virtual
reality instructional modules.50 Skills did increase on this uniquely designed geology visual-spatial examination with interesting differences in the genders. Although the females
improved to have equal scores with the males. The experimental group demonstrated
increased spatial ability as compared to the control group at the end of the experiment.
2.3 Validation of published tools:
A variety of visual-spatial assessments have been developed, tested and
validated for different areas of education. The four main sources that were used to develop
the Visual-Spatial Chemistry Specific tool were Seddon’s Molecular Reflection and Rotation
assessment,36, 40, 24 Savec’s reworking of these questions,44, 20 the Space Test,42, 43 and Rochford’s Visualization of Pictorial Molecular Structures test.41
Validation is defined as the degree to which an assessment measures what it is
intended to measure. Researchers have recognized the importance of visual-perceptual skills
and visual-spatial assessments and have validated tests of this domain of educational study.
Seddon et al. have tested different groups of students from different countries that included
Nigeria, Portugal, England, Pakistan, and Cape Verde. The Molecular Rotation and
Reflection assessments that test visual orientation skills had the construct validity verified
with high school and college students in Pakistan and Cape Verde. The questions asked
students to rotate molecules around a specific axis of rotation, to find which of the axes were
psychologically distinct in the student’s minds.37 They found that this task was not successful in transference of the learning to any of the different axes or planes. These studies strongly
suggest that the X, Y, and Z axis are factorially and psychologically distinct concepts in
students’ minds.23, 24
Rochford validated the Visualization of Pictorial Molecular Structures assessment
spatial visualization abilities of chemistry students at the University of Cape Town and 2)
their academic achievements in class tests and examinations in chemistry”.51 Students who failed this assessment underachieved significantly after a semester of general chemistry and
those who did better on the assessment did better in chemistry classes. Language was ruled
out as an issue since on an English proficiency test the students who underachieved did as
well as their spatially prepared peers.47
The Space Test, 42 a German test, tried to identify the age that students first cultivate spatial ability. This spatial ability was related to concrete formal thinking processes as
formulated by Piaget.7 The Space Test was given along with a general intelligence test to seventh, eighth, and ninth grade students. A correlation between the two scores indicated
that the spatial ability of the students developed as strongly as general intelligence. The
results found that in seventh grade the two scores were not correlated, but became correlated
in the eighth and ninth grade. The authors suggest that teachers should avoid problems that
require the use of spatial ability to students in seventh grade. In eight and ninth grade,
however, teachers should begin to use problems that use concrete structures because at this
age, most students are in Piaget’s “concrete operations of thinking” stage.42
Kovac tested the construct validity of selected spatial ability tests by correlating the
students’ class grades with the scores of three commercially available visual-spatial tests.52 They were trying to determine if the tests were only measuring holistic ability, or if they
were measuring analytic trial and error ability for eight graders. Their results showed that
reports that claim visual-spatial tests do measure holistic ability, more specifically the Purdue
Rotation of Visualization Test9.
Ferk, et al44 did a face validity study on a rotation and reflection assessment in 2003 by testing students using computer animations of the molecular representations, where the
students could manipulate the figures with the mouse. Students were interviewed and asked
whether they would prefer the computer models or physical models to solve the questions.
Students expressed preference for either the computer models or the physical models but
when given both, the students scored lower because their attention was divided.
Johnson and Bouchard tested which of three educational models of intelligence fits a
study of assessments by using principal factor analysis.53 They gave 436 people 42 different mental ability tests, and published the results in 2005. Prior to this study others had
categorized students’ test scores and then developed a theory from the results. In this paper
three theories were considered and individuals were tested using known psychological
mental ability tests to see which theories fit better. A statistical Principal Components
Analysis (also called factor analysis) indicated that a verbal-perceptual model of viewing
intellectual thought was the best fit. This model had three different factors: a general
intelligence factor, a verbal and educational factor, and a spatial, practical and mechanical
abilities factor. This third factor is the one that is being tested with the VSCS assessment
tool.
This literature review strongly suggests that visual-perceptual skills are crucial when
switching from one chemistry representation to another because of the need to visualize in all
involved in mental representation of objects could be attained by interventions such as
explicitly showing students different visual-spatial representations. The need for high quality
visual-spatial assessments still exists as well.14
2.4 References:
1. Johnstone, A. H. (1982) Macro- and microchemistry. School Science Review, 64, 377-379.
2. Bodner, G.M, & McMillen, T. L. B. (1986) Cognitive restructuring as an early stage in problem solving. Journal of Research in Science Teaching, 23, 8, 727-737.
3. Paivio, A. (1986) Mental Representations: A Dual Coding Approach Oxford Psychology Series, No. 9, Oxford University Press, New York.
4. Wu, H., Krajcik, J. S., Soloway, E. (2001) Promoting Understanding of Chemical Representations: Students' Use of a Visualization Tool in the Classroom. Journal of Research in Science Teaching, 38, 7, 821-842. (Quote on page 821)
5. Yang, E., Andre, T., Greenbowe, T. J. (2003) Spatial ability and the Impact of Visualization/animation on Learning Electrochemistry. International Journal of Science Education, 25, 3, 329-349.
6. Wiley, S. E. (1990) A Hierarchy of Visual Learning. Engineering Design Graphics Journal, 54, 3, 30-35.
7. Piaget, J. (2003) Part I: Cognitive development in children: Piaget Development and Learning. Journal of Research in Science Teaching, 40, SI, S8-S18.
8. Rochford, K., Archer, M. A. (1991) Academic underachievement and cognitive learning disabilities: 10 case studies, SAJHE/SATHO, 5, 2, 52-73.
9. Bodner, G. M, and Guay, R. B. (1997) The Purdue Visualization of Rotations Test. The Chemical Educator, 4, 2.
11. Carter, C. S., LaRussa, M. A., Bodner, G. M. (1987) A Study of Two Measures of Spatial Ability as Predictors of Success in Different Levels of General Chemistry. Journal of Research in Science Teaching, 24, 7, 645-657.
12. Wu, H., Shah, P. (2003) Exploring Visuospatial Thinking in Chemistry Learning. Science Education, 88, 3, 465-492. (Quote is on page 465)
13. Ben-Zvi, R., Eylon, B., Silberstein, J. (1987) Students' visualization of a chemical reaction. Education in Chemistry, July 117-120.
14. Tuckey, H., Selvaratnam, M., Bradley, J. (1991) Identification and Rectification of Student Difficulties Concerning Three-Dimensional Structures, Rotation, and Reflection. Journal of Chemical Education, 68, 460-464. (Quote is on page 464)
15. Kozma, R., & Russell, J. (2005) Students becoming chemists: Developing
representational competence. Visualization in Science Education edited by John K. Gilbert, Springer, 121-145.
16. Coleman, S. L., Gotch, A. J. (1988) Spatial Perception Skills of Chemistry Students. Journal of Chemical Education, 75, 2, 206-207.
17. Blanjenkova, O., Kozhevnikov, M., Motes, M. A. (2006) Object-Spatial Imagery: A New Self-Report Imagery Questionnaire. Applied Cognitive Psychology, 20, 239-263.
18. Tuckey, H., & Sekvaratnam, M. (1993) Studies involving 3-Dimensional
Visualization Skills in Chemistry; a Review. Studies in Science Education, 21, 99-121.
19. Seddon, G. M., Tariq, R. H., Dos Santos Veiga, J. (1982) The visualization of spatial transformations in diagrams of molecular structures. European journal of Science Education, 4, 409-420.
20. Savec, V. F., Vrtacnik, M., Gilbert, J. K. (2005) Evaluating the educational value of molecular structure representations, in Visualization in Science Education edited by John K. Gilbert, p 269 – 297.
21. Seddon, G. M., Moore, R. G. (1986) The Structure of Abilities in Visualizing the Rotation of Three-Dimensional Structures presented as models and diagrams. British Journal of Educational Psychology, 56, 2, 138-149.
23. Seddon, G. M., Alonge, E. I., Jusoh, I. (1985) Factorial effects of Testing Bilingual Students in Different Languages on a Spatial Task. Educational Psychology, 5, 2, 135-145.
24. Seddon, G. M., Moore, R. G. (1986) The structure of abilities in visualizing the rotation of three-dimensional structures presented as models and diagrams. British Journal of Educational Psychology, 56, 2, 38-149.
25. Shepard, R. N., Metzler, J. (1971) Mental Rotation of Three-Dimensional Objects. Science, 741, 701-703.
26. Vandenberg, S. G., and Kuse, A. R. (1978) Mental Rotations, A Group Test of Three-Dimensional Spatial Visualization. Perceptual and Motor Skills, 47, 599-604.
27. Witkin, H. A., Moore, C. A., Goodenough, D. R. and Cox, P. W. (1977) Field-Dependent and Field-Independent Cognitive Styles and Their Educational Implications. Review of Educational Research, Winter, 1-64.
28. Guay, R, McDaniel, E, Angelo, S. (1978) Analytic Factor confounding spatial ability measurement, Correlates of performance on spatial aptitude tests; a final report on Grant No. DAHC 19-77-G-0019 US Army Research Institute for the Behavioral, Purdue University.
29. Tasker, R. and Dalton, R. (2006) Research into practice: Visualisation of the
molecular world using animations. Chemistry Education: Research and Practice, 7, 2, 141-159.
30. Ekstrom, R. B., French, J. W., Harman, H. H. (1976) Educational Testing Service, Princeton, NJ. (Quotes on pages 38-39, and page 47)
31. Bennett, G. K. (1990) Differential aptitude tests, Fifth edition. The Psychological Corporation.
32. Rourke, B. P. (1989) Nonverbal Learning Disabilities. The Guilford Press, New York.
33. Cornoldi, C., Rigoni, F., Tressoldi, P. E., Vio, C. (1999) Imagery Deficits in Nonverbal Learning Disabilities. Journal of Learning Disabilities, 32, 1, 48-57.
35. Small, M. Y., Morton, M.E. (1983) Spatial Visualization Training Improves
Performance in Organic Chemistry. Research in College Science Teaching, Sept/Oct, 41-43.
36. Seddon, G. M., Tariq, R. H. and Dos Santos Veiga, J. (1982) The visualization of spatial transformations in diagrams of molecular structures. European journal of Science Education, 4, 409-420.
37. Seddon, G. M., Shubber, K. E. (1985) Learning the visualisation of
three-dimensional spatial relationships in diagrams at different ages in Bahrain. British Educational Research Journal, 3 97 -108.
38. Nicholson, J. R., Seddon, G. M. (1977) The understanding of pictorial spatial relationships by Nigerian secondary school students. Journal of Cross-Cultural Psychology, 8, 4, 381-400.
39. Evans, G. S., Seddon, G. M. (1978) Responsiveness of Nigerian Students to Pictorial Depth Cues. Educational Communication and Technology, 26, 4, 313-320.
40. Seddon, G. M., Tariq, R. H., Dos Santos Veiga, J. (1984) The transferability of two pictorial scientific tasks between different spatial dimensions. British Journal of Educational Psychology, 54, 276-283.
41. Rochford, K, Irving, A. (1989) Academic Underachievement and Spatial
Visualization Problems of University Chemistry Students, Teaching Method Unit, 12, 1, Test – Visualization of Pictures of Molecular Structures (VMPS).
42. Barke, H. D. (1993) Chemistry education and spatial ability. Journal of Chemical Education, 70, 12, 968-971.
43. Barke, H. –D., Kuhrke, R. (1992) Einfurhrung in die Chemie; Lang: Frankfurt, New York.
44. Savec, V., Vrtacnik, M., Blejec, A., Gril, A. (2003) Students' understanding of molecular structure representations. International Journal of Science Education, 25, 10, 1227-1245.
46. Millroy, W and Rochford, K. (1985) The early prediction of Failure in Engineering Drawing among first year University Students. International Journal of Engineering education, 1, 6, 439-445.
47. Keen, E. N., Fredman, M., Rochford, K. (1988) Relationships between the academic attainments of medical students and their performance on a test requiring the visual synthesis of anatomical sections. South African Journal of Science, 84, 204-208.
48. Rochford, K. (1987) Conference title - Annual convention for the council on exceptional children. Title of paper - Students' Visual Learning Disabilities and Under-Achievement in Selected Science Subjects, Chicago.
49. Rochford, K and Sass, A. (1988) Tests of three-dimensional visual perception as predictors of academic performance by University engineering students. South African Journal of Science, 84.
50. Pilburn, M.D., Reynolds, S. J., McAuliffe, C., Leedy, D. E., Birk, J. P., Johnson, J. K. (2005) The role of visualization in learning from computer-based images.
International Journal of Science Education, 27, 5, 513-527.
51. Rochford, K., Irving, A. (1989) Academic Underachievement and spatial visualization problems of university Chemistry students. Methomix, Teaching Methods Unit, 12 (1) 5-6. (Quote is on page 5)
52. Kovac, R. J. (1989) The Validation of Selected Spatial Ability Tests via Correlational Assessment and Analysis of User-Processing Strategy. Educational Research
Quarterly, 13, 2, 26-34.