First indication of LPM effect in LHCf, an LHC experiment
M. Del Prete1,2,aon behalf of LHCf collaboration
1INFN section of Florence, Italy 2University of Florence, Italy
Abstract. The Large Hadron Collider forward (LHCf) experiment is dedicated to the measurement of very forward neutral particle production in the high energy hadron-hadron collisions at LHC. The aim of the experiment is to improve the cosmic ray air shower development models and its setup gives an important opportunity to directly measure the Landau Pomeranchunk Migdal (LPM) effect in heavy absorber. This work presents the analysis for LPM effect on data taken in 2010 and 2013 at √s=7 TeV and
√
sNN =5.02 TeV respectively. We study the interactions of gamma, mainly produced byπ0decay, in one of the calorimeter pairs of LHCf. This is composed by 16 Tungsten
layers as absorbers and 16 plastic scintillators for energy measurements (Arm2). We use three parameters to describe the mean shower profile with respect the photon mean en-ergy. The results are compared with Epics MonteCarlo simulation with LPM active and inactive models, shows a first evidence of LPM effect.
1 Introduction
LHCf, LHC-forward experiment, measures neutral particles production in a very forward region in proton-proton and proton-ion collisions at the Large Hadron Collider. LHCf has the aim to improve hadronic interaction models of Monte Carlo simulations used in cosmic rays. Highest energy cosmic rays can only be detected from secondary particles which are produced by the interaction of the primary particle with nuclei of the atmosphere, the air showers. It is possible to reconstruct the kinematic parameters and the type of primary particle studying the development of air showers. Since the energy flow of secondary particles is concentrated in the forward direction, the measurement of particle production at small angles is very important.
LHC accelerator gives the possibility to study collision at very high energies, which corresponds to an energy range in the laboratory frame from 1014eV to 1017eV. This energy range covers the ”knee” region of cosmic rays spectrum, which occurs at 1015eV. The capability to measure the photon shower development in a range of energies up to∼1013eV and the specific setup of the experiment give a
unique opportunity to study the Landau Pomeranchunk Migdal effect in heavy absorbers.
In the 1953 Lev Landau and Isaak Pomeranchuk noticed that at high energies and large densi-ties the bremsstrahlung and pair production does not follow the Bethe-Heitler formula [1, 2] In the 1956 Arkady Migdal elaborated the proper quantum mechanic treatment for the cross sections. The final cross sections of the bremsstrahlung and pair production are suppressed since the momentum
LHCf detectors occupy the first 30cmof the TAN slots, facing the interaction point and minimizing the material between them and IP1. This is the best condition for measuring fluxes and energy spectra of high energy forward neutral particles produced by the interacting beams. Each detector is made of two sampling and imaging calorimeters called towers. The longitudinal dimension of towers is of 44 radiation lengths, which correspond to 1.6 nuclear interaction lengths. The transverse cross sections are for Arm1 20x20 mm240x40 mm2 for the small and for the large tower respectively, for Arm2 transverse cross sections are 25x25 mm2for the small tower and 32x32 mm2for the large tower.
Each tower is composed of 16 tungsten layers and 16 plastic scintillator layers to measure energy and also contains 4 position sensitive layers that are different for the two detector [5–8]. Arm1 uses scintillating fiber to measure position of the neutral particles in the towers, in Arm2 the position is measured by silicon microstrip detectors.
The pseudo-rapidity range isη>9.6 for the small tower and 8.4<η<9.4 for larger tower. Energy resolution obtained with these detectors configuration is better than 5 % for photons and of about 40 % for neutrons.
3 LPM effect and LHCf
LHCf measures photons of very high energy and at small angles. The fine longitudinal segmentation of its calorimeters is well suited for the measure of the shower development. For these reasons is the optimal tool to detect LPM effect in the bremsstrahlung and pair production processes. LPM effect is characterized by the material dependent componentELPM, computed as [9]:
ELPM =m
2c3
4παX0 (1)
This definition ofELPM is the most used but theoretical calculations differs of numerical factors de-pending of the models used [10–12]. LHCf has tungsten absorbers withZ=74 and radiation lengths X0=3.5 mm, so we have from equation (1)ELPM=2.7 TeV.
We test the capability of LHCf to detect LPM effect by comparing MC simulations to the shower development measured in the small tower, the one at smaller angle and thus with larger statistic. We use EPICS montecarlo to simulate mono-energetic 1000 photons impinging the small tower with a energyEγ=2.48 TeV and with and without LPM effect. We select photons 2X0away from the edge
of the calorimeter. After the cuts the events studied are 382, the results are in figure 1 where is evident that the shower development is delayed and elongated when the LPM effect is active in the simulation.
3.1 Data and MCs used
data-Figure 1. Simulation of photons showers, of energy∼ 2.48 TeV. The figure shows the average longitudinal development of the photon shower in the small tower, where LPM as turned on (red) and off(blue).
MCs is not as good as in p-Pb data. This problem is being investigated. In this paper the differenc is attribuited to systematic effects.
The montecarlo simulations are done with EPICS to simulate 3000 mono-energetic photons im-pinging the small tower with different mean energies and with LPM effect turned on and off. The energies simulated are from 200 GeV to 3200GeVin steps of 40 GeV.
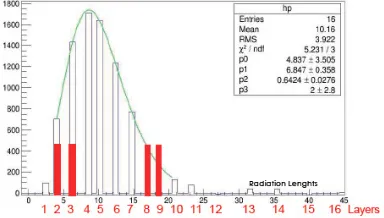
Figure 2. Figure shows the shower profile of one event from LHCf data. The fit (see text) is green, in red the scintillators interested in this analysis. The 16 entries are the scintillators in ARM2, in the panel are shown the fit parameters. The fit is done from layer 2 to layer 10 to better identify the maximum position.
We have to consider that up now the MC software have not been checked for LPM effect at high energy where LHCf works. All the tests have been done comparing the test beam data at fixed target with the simulation for energies below∼400 GeV. Therefore we do not expect that EPICS prediction to be in perfect agreement with the data of much larger energies, as those collected by LHCf [13].
3.2 Data analysis
In this work we select, for data and MCs, a fiducial region of the Small Tower of ARM2 2X0(X0=3.5
mm) away from the lateral edge to avoid leakage problems. The events studied are in the energies range of 50 GeV<Eγ<3100 GeV to have stable data and statistically significance.
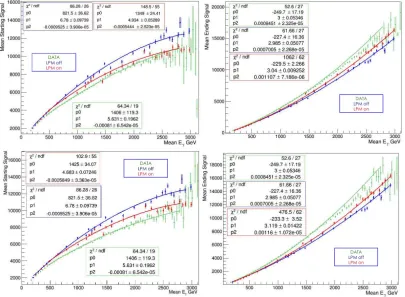
Figure 3. Figure shows the parametersSst andSend for the p-Pb and p-p data in the first and second raws respectively. We have a good agreement between the data and LPM on simulations. The curves are fitted with a second order polynomial function.
and energy intervals of±20 GeV we compute three parameters and their mean. We define a ’starting
point’,Sst, a ’ending point’,Send(see figure 2):
Sst=S ignallayer2+S ignallayer3 Send=S ignallayer8+S ignallayer9
These parameters are sum of the respective scintillator signals. The longitudinal position of the shower maximum,Xmax, and its amplitude ,Ymax, are defined as the maximum of the fit function, the Longo Landau function [15]:
f(x)=p0·p2·(x+p3)p1·p2p1·exp(−p2·(x+p3)) (2)
In this function the variable x is the longitudinal coordinate,p0is a normalization factor,p1andp2are
parameters that describe the development of the shower by Gamma function andp3s the translation
parameter that define the starting point of the shower.
Figure 4. Figure shows the parametersXmax, in the first raw, andYmax, in the second raw. On the left column shows p-Pb run and on the right the p-p run. The curves ofXmaxare fitted with the logaritminc functionp0·ln(p1· E).
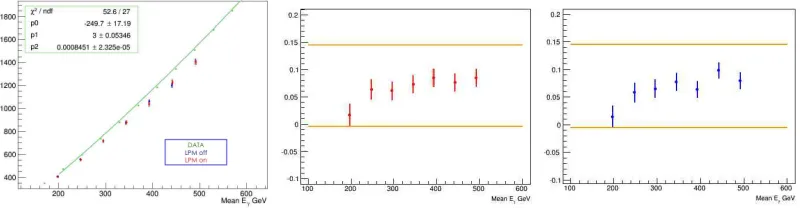
Figure 5.Figure shows the values of the parametersSendin the regionEγ<600 GeV, where EPICS makes equal
predictions (first plot). We compare the MCs with the data values obtained by fit interpolation.DSend% for LPM on and offusing the data from the p-Pb run are shown in the second and third plots.
The first step is to compare the described parameters which are obtained by EPICS simulations with and without LPM effect to what obtained in LHCf experiment data. In figures 3 and 4 are shown the parametersSst,Send andXmaxfor the p-Pb and p-p runs. In particular figure 3 shows the results of more direct parametersSst andSend for the p-Pb run in the first and p-p run in the second raw respectively. We have for both the parameters a better, but not perfect, agreement between the LHCf data and the simulations with LPM turned on. Figure 4 shows the parametersXmaxandYmax, on the left for the p-Pb and on the right for p-p runs. In this part of the analysis we have not so clear evidence of the difference between the simulations for LPM on and offand a poor agreement between the data and the LPM on curves. For this elaborated analysis based on the fit with empirical function we need to understand better the fit function, moreover this parameter could be sensitive to LPM effect at higher energy [12].
In this energy region we compute the percentage difference between data and MC and define a maximum acceptable variation of the parameters, the ’compatibility region’. In this energy region we compare the data to EPICS expectations by computing the percentage differences data-MC forSst,
SendandXmax:
DSst%=
Sdata st −SMCst
Sdatast DSend%=
Sdata end −SendMC
Sdataend DXmax%=
Xdata max −XmaxMC
Xmaxdata
Figure 5 shows the results for the p-Pb data and EPICS simulations forEγ <600 GeV. The left plot
showsSend (data and MC), the second and third plots DSend% computed from EPICS with LPM turned on and off. DSend% depends onEγ, but in the same way for LPM on and off. We take the
range of values ofDSend% as the amount of disagreement data-MC for the parameterSend.
For the time being we take this range of DSend% values as ’compatibility region’, a measure of the confidence for MC predictions on this energies range. The same analysis was done for the parametersDSst% and DXmax%. The definition of compatibility region for DSst%, DSend% and DXmax%are (−0.1,0.125), (−0.005,0.145) and (0,0.055) respectively. We obtain similar values for the data collected in p-p collisions. We will assume that, at higher energies, the ’compatibility region’ still describes the uncertainties in the comparison data-MC.
A summary of this analysis is presented in figure 6, TheDSst% as a function ofEγis presented in the first and second raws (at the left p-Pb at the left p-p data). Data are compared to EPICS predictions with LPM turned on (first raw) and turned off(second raw). SimilarlyDSend% andDXmax% follow.
Conclusions are not the same for all the three parameters that we have studied, probably due to different sensitivity to the LPM effect. The clearest results comes fromDSst% and DSend% that measure the shower delay. Both parameters cluster in the ’compatibility region’ when the data are compared to MC LPM turned on. The comparison of the data to EPICS LPM turned offshows the parameters stay outside the region. This supports the description of data with LPM effect. DXmax% provides more ambiguous results and the parameter does not either of the EPICS modes. A possible explanation is that the fit with empirical function (2) is too sensitive to experimental uncertainties. More work on this issue is in progress.
4 Conclusion
From this first study we can say that the statisticsSstandSendare reasonable well described by Epics software with LPM effect, for energies, Eγ < 3.1 TeV where the LPM effect is very small. More
elaborated analysis based on fit needs more work,Xmaxis not in clear agreement with simulations of LPM on or off. In any case to have stronger evidence we need more MCs for comparison and data at higher energies.
Data taken at 13 TeV, in June of 2015 will have more statistics in the optimal energies range and will confirm this evidence, there will more useful the study ofXmax,Ymaxand the definition of a size of shower profile, for example the size of the shower at23 ofYmax, to avoid some possible problem of the softwares in the simulation of the amplitude of the LPM effect at high energy.
References
[1] A. B. Migdal, Phys. Rev.,103,1811-1820 (1956).
[13] K.Yanagisawa, K.Yoshida, Y.Komori, T.Kobayashi and J.Nishimura, 0732, 33RD ICRC (2013) [14] K.Yoshida, Y.Komori, K.Yanagisawa, T.Kobayashi, Y.Sato and J.Nishimura, 0733, 33RD ICRC
(2013)